HAL Id: hal-02368206
https://hal.archives-ouvertes.fr/hal-02368206
Submitted on 18 Nov 2019
HAL is a multi-disciplinary open access
archive for the deposit and dissemination of
sci-entific research documents, whether they are
pub-lished or not. The documents may come from
teaching and research institutions in France or
abroad, or from public or private research centers.
L’archive ouverte pluridisciplinaire HAL, est
destinée au dépôt et à la diffusion de documents
scientifiques de niveau recherche, publiés ou non,
émanant des établissements d’enseignement et de
recherche français ou étrangers, des laboratoires
publics ou privés.
DiffServ-Aware Flow Admission Control and Resource
Allocation Modeling
Gilles Bertrand, Géraldine Texier
To cite this version:
Gilles Bertrand, Géraldine Texier. DiffServ-Aware Flow Admission Control and Resource Allocation
Modeling. Workshop on IP QoS and Traffic Control, Dec 2007, Lisbonne, Portugal. �hal-02368206�
Lisbon, Portugal, December 6-7, 2007
DIFFSERV-AWARE FLOW ADMISSION CONTROL AND RESOURCE
ALLOCATION MODELING
Gilles Bertrand, Géraldine Texier GET/ENST Bretagne - RSM Department
2 rue de la Châtaigneraie - CS 17607, 35576 Cesson Sévigné Cedex - France E-Mails: [email protected], [email protected]
Keywords: QoS, Admission Control, Bandwidth Allocation, DiffServ, Multicommodity flow problems. Abstract. The emergence of multimedia applications like IPTV or games, underlines the need for QoS in networks. Among several approaches, the DiffServ architecture appears to be a promising solution, widely implemented, and included from the early phases in the specification of new architectures like IMS (IP Multimedia Subsystem). The complexity of DiffServ lies in the dimensioning and the parameterization. We propose a model to study network dimensioning and route provisioning for classes
of service as multicommodityflow problems, addressing the offline optimization of bandwidth allocation
for every class of traffic. This leads to the allocation of all demands for EF, a maximum concurrent flow problem for AF and BE and a maximum multicommodity flow problem for out-of-profile AF traffic. The
result is an optimal routing for EF, AF and BE demands. The AFOUT allocation rate indicates the
possible extension of the SLAs and highlights the links to consider in priority for network evolutions.
1. INTRODUCTION
Packet switched networks are traditionally working in Best Effort, without providing any guarantee or prevision regarding the bandwidth allocated to flows, the losses, nor the delays. The emergence of multimedia applications like video streaming, games, IPTV… underlines the need for quality of service (QoS). Several approaches have been explored to guarantee a required amount of resources for some given flows. One possible solution is to offer over-provisioning for ensuring that the network is always far from congestion. The under-utilization of links makes certain that packets will arrive in intermediate nodes with a reduced concurrence from other flows and will be classified in nearly empty queues. Over-provisioning protects packets from losses and delays, but is not always possible to implement. For example, access network bandwidth is not indefinitely extensible. The best solution is the DiffServ architecture, standardized at IETF [2][3]. When QoS is required, the application or the first QoS-aware equipment marks packets to indicate the required QoS and each node applies the associated treatment. DiffServ defines several classes of service (CoS): Expedited Forwarding (EF), Assured Forwarding (AF) and Best Effort (BE). Each CoS is associated with a Per Hop Behavior (PHB) as explained in section 2. The idea of this architecture is to offer better treatment to given flows according to their needs.
DiffServ complexity lies in the dimensioning of the network and in the definition of the parameters of network mechanisms (scheduling, queue management, admission control, etc). Even if the huge number of parameters represents a challenge for network administrator, the most difficult point is to have a consistent relationship between those parameters and the guarantee truly sold to the users. Since the core and transit network aggregate traffic, how can individual QoS guarantees, specified by a contract between the operator and each client (Service Level Agreement SLA), be easily translated into network configuration parameters? This paper is not addressing network element parameterization but is focused on the evaluation of the dimensioning performed by network operators regarding the SLA concluded with their clients. We model DiffServ architecture and perform bandwidth allocation and routing in order to
G. Bertrand and G. Texier
evaluate the efficiency of the dimensioning. The result allows the identification of unused or congested links and thus helps operators to forecast network evolutions or anticipate future SLA negotiations.
In this paper, the guarantees associated with all the classes of service are considered jointly to perform bandwidth allocation. This leads to solve two related multicommodity flow problems [6]: a maximum concurrent flow problem for AF and BE classes of service with a minimum guaranteed service for AF without penalizing BE and a maximum multicommodity flow for out-of-profile traffic from AF classes. The bandwidth allocation is performed hierarchically like in [1] where Mitra et al. propose a traffic engineering model for QoS and BE flows with a route-based formulation. They introduce predefined admissible routes for each CoS regarding for example the hop number in order to reduce complexity due to path formulation. Many works have studied QoS in terms of bandwidth reservation, without specifying the mechanism used to implement QoS. In [9], QoS is specified with QoS link weights depending on the available bandwidth and integrates them as constraints in Q-Bate routing algorithm. When articles consider the DiffServ mechanism, they usually concentrate on the impact of particular classes of services. [10] addresses on-line EF flow acceptation whereas [7] focuses on the impact of EF flows on BE without consideration of AF, with a M/G/1 queuing model and the use of Lagrangean relaxation. Reference [7] considers weighted fairness for AF behavior but it does not observe the impact of AF out-of-profile flows over Best Effort.
Section 2 presents the modeling of the DiffServ mechanism and the treatment associated with the different classes of services. Section 3 describes our model and the linear program used to allocate bandwidth. In Section 4 we introduce the algorithm, the simulation environment and the numerical results before the conclusion in the fifth section.
2. MODELING OF DIFFSERV MECHANISMS
DiffServ defines three behaviors: Expedited Forwarding (EF) [4], Assured Forwarding (AF) [5] and Best Effort (BE). EF specifies a class of service for very sensible flows that require to be protected from losses and delays. AF designs four classes of service, addressing elastic flows. Best Effort is the class describing the actual functioning of the Internet, i.e. without any guarantee. DiffServ implements a specific Per Hop Behavior for each class of service. The principle of DiffServ is to guarantee quality of service for designated flows during congestions phases, i.e. when the network is overloaded.
The EF PHB: The dimensioning of the network and the respect of the Service Level Agreement (SLA) contracted between the operator and the client are the essential mechanisms to ensure the efficiency of the quality of service differentiation. The strong guarantees associated with EF class of service rely on bandwidth over-provisioning: operators perform admission control and allocate only a small amount of the reserved bandwidth to transport EF flows. As a result the queues used for EF packets are likely to be almost empty most of the time. Hence, queuing delays are small.
The AF PHB: Four classes of service, namely AF1, AF2, AF3 and AF4, constitute AF behavior and are associated with specific network configurations (queue management, scheduling, etc). AF traffic is well suited for elastic flows since it does not give any guarantee on the packet transit delays in the network. A characteristic of AF flows is the possibility given by the operator to transport more traffic than specified in the SLA, as long as it does not disturb the network. In order to achieve this, each class implements three-drop precedence levels. To simplify the model, we will consider only a two-drop precedence level paradigm, which is usually implemented with a RIO mechanism. This means that we distinguish in-profile traffic from out-of-profile traffic. During congestion periods or when traffic load increases, out-of-profile packets are dropped to improve the network condition.
The BE PHB: This PHB describes the actual functioning of the Internet. Packets are sent without any guarantee in terms of delay or losses. During congestion periods, this traffic is impacted before AF or EF traffic. We do not intend to model every mechanism in the core nodes but only the SLA influence on routed traffic. Indeed, the individual SLA and the dimensioning must be defined consistently to ensure the quality of service guarantees. We suppose that scheduling and queue management in intermediate nodes are well parameterized and achieve the correct dimensioning defined by the network administrator.
Hence we are able to consider bandwidth allocation volumes rather than flow or packet. Our model represents the AF behavior in a realistic network environment. We observe the bandwidth allocation mechanisms when all the DiffServ classes of service are implemented and we focus on AF out-of-profile traffic interactions with BE. After marking the packet, the first mechanism used in edge routers is the admission control.
3. TRAFFIC ENGINEERING FOR DIFFSERV-AWARE NETWORKS
3.1. Admission control
To model the QoS-aware bandwidth allocation, that can be used to establish the Label Switched Paths (LSPs) in a MPLS network for example, we assume that the traffic matrix is known. The traffic matrix gives the pairs (origin, destination) and the volume requested for the flow between these nodes. For admitted flows marked with EF PHB, we apply a ratio of 10 Megabytes reserved for 1 Megabyte requested to respect the over-provisioning. For AF traffic, the admission controller sets the drop precedence level to IN or OUT depending on the traffic matrix and the SLA.
The network nodes can be classified into transit and stub nodes. Stub nodes are the final origins and
destinations of the demands. The total number of nodes in the network is denoted as Nn, and the number
of stub nodes as Nsn. In the model, the SLA specifies for each CoS c the share Sc of the bandwidth
corresponding to the minimum stub node outgoing capacity minout that the CoS can use to inject traffic
into the network. The admission control mechanism implemented in the model provides a fast two- iteration approximation of the max-min fairness. In the first iteration all demands d belonging to CoS c,
requesting a bandwidth Bd and originating from node i receive the bandwidth share presented in equation
(1). During the second iteration, the remaining allocable bandwidth Br for the considered CoS is shared
between the demands that have not been completely granted yet (equation (2)).
min Bd,minout⋅Sc+0
Nsn (1)
min Bd,minout⋅Sc+Br Nsn (2) 3.2. Bandwidth Allocation
One aim of our model is to present a realistic way to allocate bandwidth for given demands with an off-line optimization to guarantee quality of service. The bandwidth allocation is performed sequentially, attributing bandwidth according to the priorities of the flows. EF flows are served first, according to DiffServ philosophy. The success of the first step is conditioned by network dimensioning, admission control and over-provisioning. EF traffic is highly protected and the bandwidth requested by EF demands is allocated except in case of high congestion. The residual link capacities after bandwidth allocation for EF traffic are considered for serving AF in-profile traffic, in a second phase. The residual link capacities being smaller than the initial link capacities, the capacity constraint can forbid the usage of certain paths and, depending on the cost metric used, link costs are likely to increase. Thus, the path diversity can be smaller for AF flows than for EF flows and when the network is congested the paths chosen for AF flows are less good than the ones selected for EF traffic. AF requests are served in a fair way, as explained in section 3.4. The third phase is the allocation for BE demands. We consider that out-of-profile AF traffic is treated as lower than best effort and, thus, served last, if the networks provides sufficient resources. Optimal bandwidth allocation for each CoS is computed using a linear program.
G. Bertrand and G. Texier
3.3. Linear program for bandwidth allocation
The network is represented as a directed graph G=(V,E) with V the set of network nodes and E the set of edges representing the links between the nodes of the network. Each edge e is characterized by a
capacity ce in matrix C1. The traffic matrix M1 provides the set of demands. The application of the
admission control function on M1 provides a second traffic matrix M2 that depicts demands respecting the SLA. The matrix M2 gives the set of commodities and associates to each commodity a source s(d), a sink t(d) and a demand d (notation d is used to refer to a demand or its index indifferently). The set of the demands for the considered CoS is denoted as D. The bandwidth allocation problem for a traffic matrix M2 associated to a CoS is the following: which amount of bandwidth should be allocated on which link for which demand, in order to maximize the flow admitted. The flow admitted into the network for
demand d is denoted as Fd. The objective function f is therefore the total traffic injected in the network
after admission control and successfully routed. maximize
f = Fd
d∈D
∑
(3)Two formulations can be adopted for the problem considered: link or node-link based. The path-link formulation considers the flow routed on a path for a given demand but it requires the knowledge of the set of all possible paths for each demand d, which may be exponentially large, whereas node-link formulation is a polynomial problem. We use the node-link formulation since the multicommodity flow problem can be solved in a polynomial time. In this formulation, the variables are the flow values R(i,j,d)
corresponding to demand d on link (i,j), and the flows Fd. Consequently, the total number of variables Nv
involved in this problem is related to the number of demands Nd and the number of links Nl in the
network. The number of variables in the worst case is bounded by equation (5). ) 1 ( l d v N N N ≤ + (4) ) 1 ( 2 2 n sn v N N N ≤ + (5)
All variables are positive and the admitted flow Fd related to a demand d cannot exceed the
bandwidth Bd requested for d. Besides these Nv+Nd lower and upper bound constraints, the variables are
subject to three additional constraints: the definition of Fd. the flow conservation law and the link
capacity constraint. The set of the network nodes is denoted as N. The nodes are indexed from 1 to Nn.
∀d∈D,Fd= R s(d), j, d
(
)
j=1 Nn ∑ (6)(
)
(
)
=
−
=
=
−
∈
∀
∈
∀
∑
∑
= =else
d
t
k
F
d
s
k
F
d
k
i
R
d
j
k
R
N
k
D
d
d d N i N j n n;
0
)
(
;
)
(
;
,
,
,
,
,
,
1 1 (7)(
)
e D dc
d
j
i
R
j
i
e
E
e
∈
=
∑
≤
∀
∈,
,
),
,
(
,
(8)The number NC of constraints considered in this problem depends on the number of demands and
network links. In the worst case it is bounded by equation (9).
)
1
(
2 2 n sn CN
N
N
≤
+
(9)3.4. Fair bandwidth allocation and routing for AF classes
AF classes can be used to identify the traffic and treat separately several types of traffic even if they have similar requirements. The model shares the bandwidth fairly between the AF in-profile traffic classes (AF1, AF2, AF3, AF4), proportionally to their SLA, during congestion periods. For this purpose, the routing and bandwidth allocation linear program presented in section 3.3 is solved for the traffic
matrix corresponding to all AF in-profile traffic. The solutions to this problem are denoted as Fd,AF and
solution variables (e.g. RAF1) corresponding to each AF class (e.g. AF1) are computed using equations (10) and (6). For example, if the amount of AF1 traffic admitted in the network is two times the amount of AF2, then the amount AF1 traffic routed will be approximately two times the quantity of AF2 traffic routed.
)
,
,
(
)
,
,
(
1 1R
i
j
d
B
B
d
j
i
R
AF AF AF AF=
⋅
(10)4. ALGORITHM AND RESULTS
4.1. Simulator overview
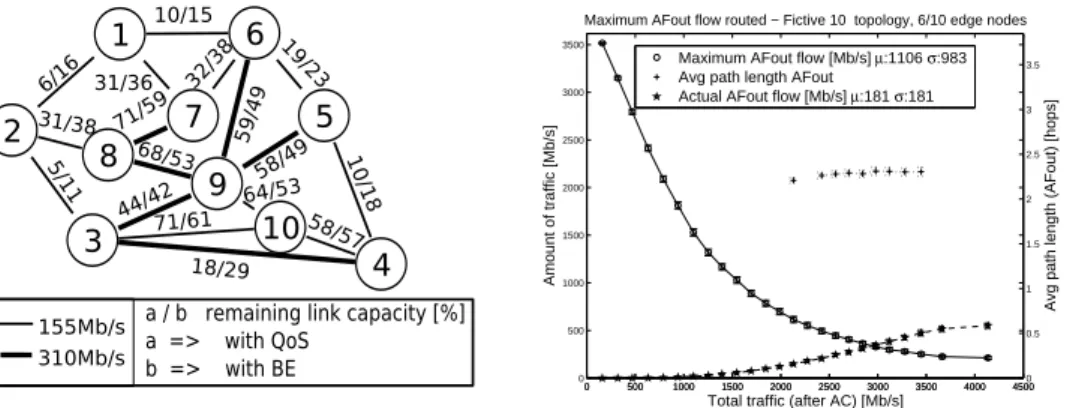
The model described in section 3 is implemented with Matlab and lp_solve, in order to study the dimensioning of a fictitious 10 node topology (see Figure 2) with link capacity matrix C1. In Figure 2 all links are made of two directed links with the indicated capacity (e.g. 155Mb/s). The model operations (traffic matrix generation, admission control and bandwidth allocation) are presented in Figure 1 and correspond to the algorithm in Figure 3. Traffic is generated for each CoS (EF, AF1-4, BE), using a lognormal probability density function in order to reproduce the variability of the demands in actual networks. The generated traffic is uniformly shared between the source destination pairs, in average. It is assumed that about 20% of the bandwidth is reserved for EF, 10% for each class AF1-4 and 40% for BE traffic. An over-provisioning ratio of 10 is considered for the EF traffic admitted in order to have low queuing delays. In the rest of this paper we consider EF bandwidth demands, i.e. all subsequent traffic figures for EF represent 10 times the actual EF traffic. The simulation is replicated a large number of times in order to derive statistically relevant estimates of the considered metrics. Confidence intervals have been computed and are represented on the figures except if they are too small to be read.
Stub nodes (1-6) are the final sources and terminations of the demands, and data flows can transit through intermediate nodes (7-10). Admission control (AC) is performed on EF and AF classes leading to
admitted traffic matrices M2 and rejected or remarked traffic (M2AFout). AC fairness between the demands
is approximated as presented in section 3.1. Routing and bandwidth allocation computations are
performed jointly, as presented in section 3.3 and in the following order: EF, AF, BE, AFOUT. After each
% Inputs processing and traffic generation [C1, N]=Topology_generation(topology_type)
M1EF, M1AF1, M1AF2, M1AF3, M1AF4, M1BE % Original
Traffic Matrices
% Remarking AF out-of-profile traffic at edge node
[M2AF1,M2AF1OUT]=Admission_control(M1AF1,SLAAF1,N)
[M2AF2,M2AF2OUT]=Admission_control(M1AF2,SLAAF2,N)
[M2AF3,M2AF3OUT]=Admission_control(M1AF3,SLAAF3,N)
[M2AF4,M2AF4OUT]=Admission_control(M1AF4,SLAAF4,N)
M2AFOUT=M2AF1OUT+M2AF2OUT+M2AF3OUT+M2AF4OUT
% Edge node EF admission control (dropping)
[M2EF, dropped_ef]=Apply_SLA(M1EF, SLAEF, N)
% Joint routing and bandwidth allocation
[objEF,varEF,C2]=Bw_allocation(C1, N, M2EF)
[objAF,varAF,C3]=Bw_allocation(C2,N,M2AF1+M2AF2+M
2AF3+M2AF4)
[objBE,varBE,C4]=Bw_allocation(C3,N,M1BE)
[objAFOUT,varAFOUT,C5]=Bw_allocation(C4,N,M2AFOUT)
[objAF1, varAF1, objAF2, varAF2, objAF3, varAF3, objAF4,
varAF4] =share_allocated_bw(objAF, varAF)
Traffic matrix
Topology Traffic profile
T r a f f i c g e n e r a t i o n Traffic served B a n d w i d t h a l l o c a t i o n Traffic admitted A d m i s s i o n C o n t r o l
Figure 1 Algorithm principle
Figure 2 Topology (10 nodes, 17 bidirectional links)
G. Bertrand and G. Texier
bandwidth allocation stage (e.g. for EF), network link capacities (e.g. C1) are updated and subsequent computations are realized on the remaining link capacity matrix (e.g. C2). The bandwidth allocated for AF traffic is shared fairly between the AF classes as explained in section 3.4. After BE traffic bandwidth
allocation, the maximum AFOUT flow that can be routed using the residual link capacities is computed.
4.2. Performance for privileged traffic
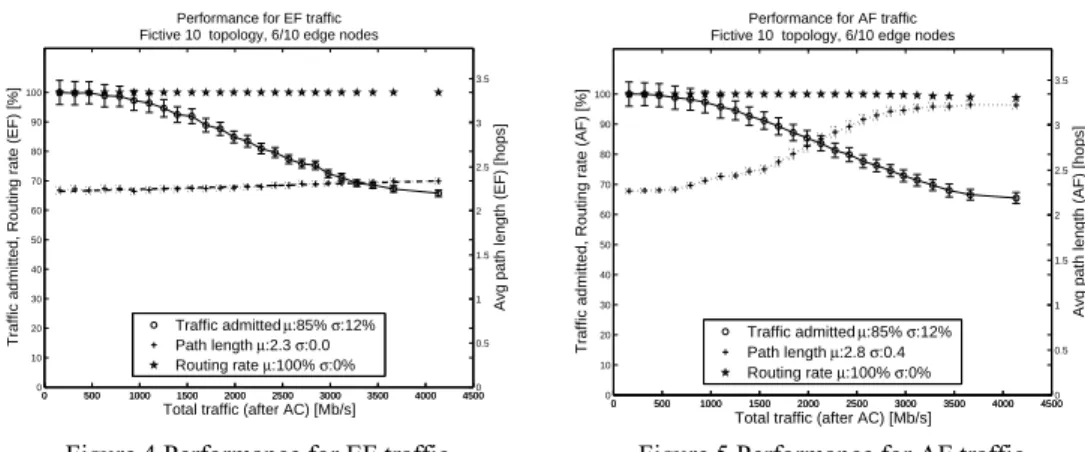
According to DiffServ QoS model, the EF traffic admitted is expected to experience low delay, jitter and losses, while AF flows receive no delay guarantee but should experience low losses and better treatment than BE. The end-to-end delay has three main origins: propagation, queuing and transmission delays. The two last components of the delay are closely related to the number of times a packet is queued and transmitted and, therefore, closely related to path length. In addition, for EF traffic the queuing delays are small, thanks to the overprovisioning. Three metrics are considered in the model in order to assess the performance experienced by EF and AF traffic: the percentage of traffic admitted after AC, the percentage of this traffic that is successfully routed and the average path length for the considered CoS. The average path length provides information about the end-to-end delay.
It can be seen in Figure 4 and Figure 5 that, in our model, EF and AF flows are slightly impacted by the admission control mechanism for traffic loads above 0.5 Gbps. In average, more than 90% of the privileged traffic is admitted for loads below 1.5Gbps. Moreover, all AF and EF traffic is successfully routed. This means that the traffic that is admitted in the network after admission control, experiences no loss. Finally, EF flows use shorter paths than AF, because they are routed first (section 3.2). For EF flows, the average path length and, thus, the delay, are stable, while they increase in the case of AF traffic. This property is close to the expected behavior of these CoS in the DiffServ model.
4.3. Performance for best effort and out-of-profile traffic
We compare the performance experienced by BE traffic in two different scenarios. In the first, BE traffic is routed after EF and AF flows, while in the second there is no QoS traffic. In presence of QoS traffic (Figure 6), BE traffic experiences losses when the overall traffic after AC is bigger that 1 Gbps. In average, more than 90% of BE is nevertheless routed for loads below 1.5Gbps. In average, the paths used by BE traffic (µ=3.0) are about half a hop longer (+0.7) than the ones used by EF traffic (µ=2.3). The performances are even slightly better when there is no privileged traffic (Figure 7), which was expected as EF and AF traffic are routed first, taking advantage of the best paths (section 3.2). Indeed, the average path length decreases slightly to 2.8 hops and more traffic is routed in average.
0 500 1000 1500 2000 2500 3000 3500 4000 4500 0 10 20 30 40 50 60 70 80 90 100
Total traffic (after AC) [Mb/s] Performance for EF traffic Fictive 10 topology, 6/10 edge nodes
Traffic admitted, Routing rate (EF) [%]
0 500 1000 1500 2000 2500 3000 3500 4000 45000 0.5 1 1.5 2 2.5 3 3.5
Avg path length (EF) [hops]
Traffic admitted µ:85% σ:12% Path length µ:2.3 σ:0.0 Routing rate µ:100% σ:0% 0 500 1000 1500 2000 2500 3000 3500 4000 4500 0 10 20 30 40 50 60 70 80 90 100
Total traffic (after AC) [Mb/s] Performance for AF traffic Fictive 10 topology, 6/10 edge nodes
Traffic admitted, Routing rate (AF) [%]
0 500 1000 1500 2000 2500 3000 3500 4000 45000 0.5 1 1.5 2 2.5 3 3.5
Avg path length (AF) [hops]
Traffic admitted µ:85% σ:12% Path length µ:2.8 σ:0.4 Routing rate µ:100% σ:0%
Figure 7 depicts the evolution of three metrics that describe the network condition in presence of BE traffic only: the average link usage rate, as well as its standard deviation and the number of links used. The average link usage rate is quasi proportional to the total traffic load, up to a load of about 1.75 Gbps and reaches a maximum value of about 80%. The number of links used shows that a stable proportion of 30% of the links, probably belonging to the best paths, is used for traffic loads up to about 0.3 Gbps. Above this threshold, more and more links are used until all links are employed. A similar threshold is to be noticed for the standard deviation of the link usage rate, when the traffic load is about 1.25 Gbps. Below this limit, the traffic repartition is less and less balanced when the load increases, while for higher traffic loads it is more and more balanced. This matches the intuition that the links on the best paths will be used first, until they are filled, then alternate paths with remaining capacity will be used.
Figure 8 presents the state of the network in the two simulated scenarios after routing BE traffic. The values presented are the remaining link capacities averaged on all simulation runs. In average, the links involving core nodes have more remaining capacity (µ=53/49%) than the ones between edge nodes (µ=11/19%). This confirms that the core of the network is probably over dimensioned.
Figure 9 presents the maximum AFOUT traffic flow that could be routed after all privileged and BE
traffic and compares it to the actual amount of remarked AF traffic. An additional metric shows the path
lengths that would be experienced by AFOUT traffic when the maximum AFOUT flow is routed. The
0 500 1000 1500 2000 2500 3000 3500 4000 4500 0 10 20 30 40 50 60 70 80 90 100
Total traffic (after AC) [Mb/s]
Performance for BE traffic Fictive 10 topology, 6/10 edge nodes
Routing rate (BE) [%]
0 500 1000 1500 2000 2500 3000 3500 4000 45000 0.5 1 1.5 2 2.5 3 3.5
Avg path length (BE) [hops]
Routing rate µ:72% Path length µ:3.0 0 500 1000 1500 2000 2500 3000 3500 4000 4500 0 10 20 30 40 50 60 70 80 90 100
Total traffic (BE) [Mb/s]
Average link usage rate | nr of links used [%]
Network condition and routing rate (only BE) Fictive 10 topology, 6/10 edge nodes
0 500 1000 1500 2000 2500 3000 3500 4000 45000 10 20 30 40 50 60 70 80 90 100 Routing rate [%]
Link usage avg µ:62.1% σ:26.3% Routing rate µ:87.5% σ:11.6% Link usage std µ:9.4% σ:4.1% Nr of links used µ:82.7% σ:23.1%
Figure 6 Performance for BE traffic Figure 7 Network condition and routing rate for
QoS agnostic network
0 500 1000 1500 2000 2500 3000 3500 4000 4500 0 500 1000 1500 2000 2500 3000 3500
Total traffic (after AC) [Mb/s]
Amount of traffic [Mb/s]
Maximum AFout flow routed − Fictive 10 topology, 6/10 edge nodes
0 500 1000 1500 2000 2500 3000 3500 4000 45000 0.5 1 1.5 2 2.5 3 3.5
Avg path length (AFout) [hops]
Maximum AFout flow [Mb/s] µ:1106 σ:983 Avg path length AFout
Actual AFout flow [Mb/s] µ:181 σ:181
G. Bertrand and G. Texier
maximum AFOUT flow takes huge values because it does not consider constraints like demands profile,
etc. However, it provides an indication on how much additional traffic could be carried by the network.
5. CONCLUSION
In this paper, a realistic admission control and joint routing-bandwidth allocation model taking traffic differentiation into account has been presented and evaluated. Its performance has been assessed with regard to a number of factors including the amount of traffic admitted and routed, the average path lengths, the link load repartition, etc. The model is well suited for predicting the performance of a network for each CoS. The results are closely related to the topology and dimensioning of the network, as well as the traffic profiles and SLA. Additional studies will examine this interaction more closely.
Finally, it should be noted that although the model provides interesting results, it is currently limited to intra-domain scenarios. A future work will be to extend it to inter-domain applications, for example by introducing the concept of Path Computation Element (PCE).
REFERENCES
[1] Mitra D. and Ramakrishnan K. G., “A Case Study Of Multiservice, Multipriority Traffic
Engineering Design For Data Networks”, In Proceedings of Global Telecommunications Conference - Globecom‘99, 1077--1083, 1999.
[2] S. Blake, D. Black, M. Carlson, E. Davies, Z. Wang, and W. Weiss. RFC 2475: An Architecture
for Differentiated Services. Proposed Standard, IETF, 1998.
[3] K. Nichols, S. Blake, F. Baker, and D. Black. RFC 2474: Definition of the Differentiated
Services Field (DS Field) in the IPv4 and IPv6 Headers. Proposed Standard, IETF, 1998.
[4] B. Davie and al. RFC 3246: An Expedited Forwarding PHB (Per-Hop Behavior). Proposed
Standard, IETF, 2002.
[5] J. Heinanen and al. RFC 2597: Assured Forwarding PHB group. Proposed Standard, IETF,
1999
[6] M. Pioro and D. Medhi, Routing, “Flow and Capacity Design in Communication and Computer
Networks”. Morgan Kaufmann Publishers (Elsevier), June2004.
[7] A. Sang and H. Zhu and S. Q. Li, “Weighted Fairness Guarantee for Scalable DiffServ Assured
Forwarding”. In Proceedings of IEEE International Conference on Communications, 2001.
[8] K. Wu and D. S. Reeves, “Capacity Planning of DiffServ Networks with Best-Effort and
Expedited Forwarding Traffic”. In Proceedings of IEEE International Conference on Communications, 2003. ICC '03.
[9] S. Avallone and G. Ventre, “Q-BATE: A QoS Constraint-based Traffic Engineering Routing
Algorithm”. In Proceedings of 2nd Conference on Next Generation Internet Design and Engineering, 2006. NGI '06.
[10] E. Hernandez-Orallo and J. Vila-Carbo, “Efficient QoS routing for differentiated services EF
flows”. In Proceedings of 10th IEEE Symposium on Computers and Communications, 2005. ISCC 2005.