HAL Id: hal-01797959
https://hal.archives-ouvertes.fr/hal-01797959
Submitted on 23 May 2018HAL is a multi-disciplinary open access archive for the deposit and dissemination of sci-entific research documents, whether they are pub-lished or not. The documents may come from teaching and research institutions in France or abroad, or from public or private research centers.
L’archive ouverte pluridisciplinaire HAL, est destinée au dépôt et à la diffusion de documents scientifiques de niveau recherche, publiés ou non, émanant des établissements d’enseignement et de recherche français ou étrangers, des laboratoires publics ou privés.
Isothermal Vapor–Liquid Equilibrium Data for Binary
Mixtures of Hexafluoroethane (R116) + n-Pentane or
n-Hexane at Two Temperatures, 288 and 296 K
Deresh Ramjugernath, Alain Valtz, Dominique Richon, Mark Williams-Wynn,
Christophe Coquelet
To cite this version:
Deresh Ramjugernath, Alain Valtz, Dominique Richon, Mark Williams-Wynn, Christophe Coquelet. Isothermal Vapor–Liquid Equilibrium Data for Binary Mixtures of Hexafluoroethane (R116) + n-Pentane or n-Hexane at Two Temperatures, 288 and 296 K. Journal of Chemical and Engineering Data, American Chemical Society, 2018, 63 (5), pp.1228-1233. �10.1021/acs.jced.7b00836�. �hal-01797959�
Isothermal Vapour-Liquid Equilibrium Data for
Binary Mixtures of Hexafluoroethane (R116) +
n-Pentane or n-Hexane at Temperatures of 288 K
and 297 K
Deresh Ramjugernath †
, Alain Valtz ‡, Dominique Richon †, Mark D. Williams-Wynn *,†, Christophe Coquelet ‡
† Thermodynamics Research Unit, School of Engineering, University of KwaZulu-Natal,
Howard College Campus, Durban, South Africa
‡MINES ParisTech, CTP – Centre Thermodynamique des Procédés, 35 Rue Saint Honoré, 77305
Fontainebleau, France
Abstract
The isothermal vapour-liquid equilibrium (VLE) data for two hexafluoroethane (R-116)/alkane systems were each measured at two temperatures of 288 K and 297 K. The two n-alkanes of interest are n-pentane and n-hexane. The pressures which were measured ranged from (0.017 to 7.040) MPa. A “static-analytic” VLE apparatus, equipped with pneumatic (Rapid Online Sampler-Injector) ROLSI® capillary samplers, was used to perform the
measurements. The ROLSI® gives this apparatus the capability of sampling both the liquid and the vapour phases, without significant equilibrium perturbation with respect to the estimated analytical uncertainties. Vapour-liquid-liquid equilibria and liquid-liquid equilibria were experienced at R-116 compositions close to unity for the R-116 and n-hexane system.
Each of the four P-x-y VLE data sets was correlated with the Peng-Robinson Equation of State, modified by the inclusion of the Mathias Copeman alpha function in preference to the original Peng-Robinson configuration. The Wong-Sandler mixing rule, combined with the (Non-Random Two-Liquid) NRTL activity coefficient model, was used to account for the properties of the mixture.
Introduction
There has been little reported in open literature on studies related to the use of fluorinated refrigerants as solvents for hydrocarbon systems. A partial list of authors who have reported the vapour-liquid equilibrium (VLE) data of hexafluoroethane (R-116) with n-alkanes was supplied by Ramjugernath et al.1 Authors who have reported VLE measurements of
hexafluoroethane and alkanes include Ramjugernath et al.1,2 and Zhang et al.3,4 The system of
R-116 and ethane was investigated by Zhang et al., whereas VLE data sets for the system of R-116 with both propane and n-butane were investigated by Ramjugernath et al.
The VLE measurements for the R-116 and n-pentane system, as well as R-116 and n-hexane system reported herein are a continuation of a previous study into the use of R-116 as a solvent for the separation of short-chained alkanes,1,2 and have not been previously investigated. The
separation of alkanes is of importance for the purification of fuels from natural gas reserves. These systems would likely have their phase diagrams classified as either type I or type II by the classification of van Konynenburg and Scott.5 In this classification scheme, a type I system
is the simplest type, with only one critical locus curve between the two pure component critical points. This does not have a three-phase region. The type II system is more complex, and consists of two critical locus curves. One, between the two pure component critical points, and the other, starting at a fictitious ‘critical point at infinite pressure’, and ending at an upper
critical end point (UCEP). This type of system has a region in which there is liquid-liquid immiscibility, and the UCEP is the upper temperature limit of this three-phase region. Low temperature VLE data is often required to distinguish between type I and type II systems. Each isothermal experimental data set reported herein was correlated with the Peng-Robinson Equation of State (PR-EOS).6 The PR-EOS was modified by replacing the original alpha
function with the Mathias-Copeman (M-C) alpha function.7 This modification allowed a better
representation of the vapour pressures of the n-pentane and the n-hexane due to the increase in the number of adjustable parameters that became available. The Wong-Sandler (W-S) mixing rules 8 were used in this correlation to represent the mixture properties with greater accuracy.
These mixing rules utilised the NRTL excess Gibbs energy equation 9 to account for the liquid
phase non-idealities.
These measurements will be useful in determining the behaviour of the solutes in supercritical R-116. The interaction parameter values for group contribution methods could also be updated by using the data sets that are reported here.
Experimental
Materials. The suppliers, the CAS numbers, the stated purities and the measured purities for
the chemicals used in these measurements are given in Table 1. The n-pentane and n-hexane were degassed in the equilibrium cell, upon loading, but the R-116 was not further purified. The ‘measured purities’ of the pure components were estimated from the (gas chromatograph) GC peak area fractions, which were defined as the area under the peak for the given component, divided by the sum of all the peak areas. A VARIAN CP-3800 gas chromatograph fitted with a Porapack Q column with a mesh size of 80/100 was used. A thermal conductivity detector
The critical properties and acentric factors of R116, n-pentane and n-hexane are given in Table 2.
Experimental Apparatus. The “static-analytic type” apparatus, used for the VLE
measurements of R-116 + propane and R-116 + n-butane by Ramjugernath et al., 1,2 was again
used in this work. This apparatus was commissioned in the CTP laboratory (formerly CEP/TEP laboratory) at MINES ParisTech by Valtz et al., 10,11 based on the original static-analytic design
of Laugier and Richon. 12
The uncertainties for the measured data were estimated by the guidelines from NIST, outlined by Taylor and Kuyatt. 13 All of the combined expanded uncertainties were calculated with a
coverage factor of k = 2. This value corresponds to a 95 % confidence interval.
The two Pt-100 temperature probes that were used to monitor the temperature of the cell were calibrated according to the 1990 International Temperature Scale Protocol. The reference probes that were used for this calibration were supplied by TINSLEY Precision Instruments and were certified by the Laboratoire National d’Essais (Paris). The combined expanded
uncertainty in the measurement of temperature was estimated to be U(T) = 0.03 K. The constant
temperature bath, inside of which the VLE cell was submerged, had a thermal stability of 0.01
K.
The pressure transducer employed for the monitoring of the pressure within the cell was a PTX 611 pressure transducer. This transducer had a range of 0 to 20 MPa and was supplied by Druck. The calibration of this transducer was performed against a 5202S dead weight pressure balance which was supplied by Desgranges and Huot in France. The expanded uncertainty in the pressure readings from this transducer was estimated to be U(P) = 0.0006 MPa.
Composition analysis of the vapour and the liquid phases was performed by means of a
VARIAN CP-3800 gas chromatograph. The signal from the thermal conductivity detector was
integrated with respect to time, to obtain the peak areas for the different components. A 4-m x 1/8’’ Porapak Q column with a mesh size of 80/100 (supplied by Restek, France) was used to separate the components from each of the samples. The gas chromatograph calibration was
performed by injecting many differing, but known volumes of each pure component into the
column with a gas syringe. The relationship between the peak area and the amount of
component that was injected to produce this peak could therefore be determined and used as
the calibration of the detector. Upon taking all the possible uncertainty sources into account
when performing the calibration, the combined expanded uncertainty in the measurement of
the composition was estimated to be less than or equal to 0.005. However, as has been shown
by Lasala et al., 14 for any data regression that considers the compositions in the fitting
procedure, the combined expanded uncertainties for each composition must be estimated
individually.
Experimental Procedure. The equilibrium cell and the associated loading lines were all
subjected to a vacuum (0.1 Pa, absolute, at room temperature), prior to the measurement of each isotherm. The cell was thereafter loaded with roughly 5 cm3 of the liquid component
(n-pentane or n-hexane) and the cell was again subjected to a vacuum; for the degassing of the liquid. The pressure was thereafter allowed to equilibrate at the temperature of the particular isotherm being measured. This pressure was recorded as the vapour pressure of the pure component. It was assumed that the equilibrium vapour pressure had been attained when the equilibrium cell temperatures, reported by both Pt-100 temperature probes, were stable and equal for at least ten minutes. The standard uncertainties were considered during this operation. The R-116 was thereafter added in step-wise amounts, with the equilibrium pressure and phase compositions being measured upon reaching equilibrium after each successive cell loading.
Equilibrium conditions were assumed to have been attained as soon as the changes in the cell pressure remained less than 0.1 kPa for a period of ten minutes. The contents of the cell were stirred vigorously throughout.
To ensure repeatability of the measurements, as well as to verify that the samples were representative of the equilibrium phase compositions, each phase was sampled at least five times. ROLSI® pneumatic samplers were used to perform the sampling of both the liquid and the vapour phases.
Correlations
The isothermal VLE data sets reported in this paper were correlated with a PR-EOS based model. 6 The PR-EOS, containing the M-C alpha function was fitted to the pure component
vapour pressures to obtain the alpha function parameters.
A vapour pressure data set for R-116 was reported by Valtz et al. 15 For the n-pentane, vapour
pressure measurements of Rice and El-Nikheli 16 and of Duce et al. 17 were used. For n-hexane,
the vapour pressures reported by Rice and El-Nikheli, 16 Duce et al. 17, Marrufo et al. 18 and
Fernández et al. 19 were used. The Mathias-Copeman alpha function coefficients regressed
from the reported vapour pressures of the three components are listed in Table 3.
To determine the properties of the mixtures from pure component properties, the W-S mixing rule 8 with the NRTL local composition model was used. 9 A value of 0.3 was recommended
for the alpha value in the NRTL model, for systems such as those investigated in this study. 19
Therefore, the only parameters that were adjusted to fit the model to the binary experimental data were τij and τji, from the NRTL local composition model, and the binary interaction
parameter, kij, from the W-S mixing rule. These three parameters were adjusted to obtain a
objective function that was used for this algorithm was a flash calculation function. This function is given by Equation 1.
Fobj= 100 N [∑ ( xexp-xcalc xexp ) 2 + ∑ (yexp- ycal yexp ) 2 N 1 N 1 ] (1) where N is the number of data points in the set; xexp is the experimental liquid mole fraction,
xcal is the calculated liquid mole fraction, yexp is the experimental vapour mole fraction and ycal
is the calculated vapour mole fraction.
The correlation of the experimental VLE data was performed using an ‘in-house’ data fitting software tool, developed by Armines and Mines ParisTech.
Results and Discussion
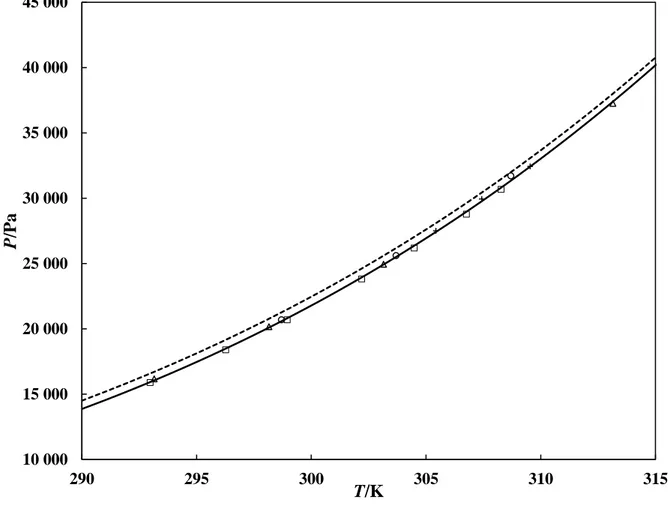
The measured vapour pressures for n-hexane 16-19 were plotted against predicted vapour
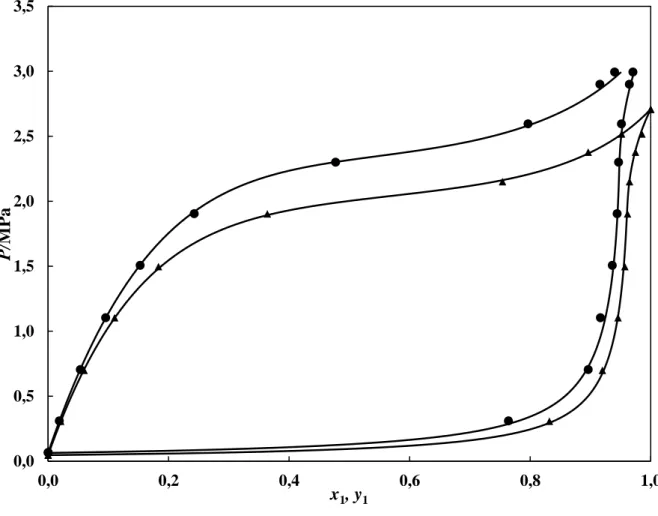
pressures in Figure 1. The vapour pressures calculated using the PR-EOS with the original alpha function and with the M-C alpha function were both predicted and plotted in Figure 1. This comparison indicated that the use of the M-C alpha function provided a far better fit of the experimental data to the predicted data than when using the original PR-EOS alpha function. The PR-EOS with the M-C modification was therefore used for the VLE regression. The VLE data set for the system of R-116 and n-pentane is reported in Table 4, with Figure 2 showing a plot of the experimental vapour-liquid equilibrium data alongside the data calculated from the regressed parameters. There was a good fit of the model to the measured data for this system. This system exhibits zeotropic behaviour. There are also no observable liquid immiscibilities, and thus, either the mixture is a type I system on the van Konynenburg and Scott 5 classification, or the mixture is a type II system that is above the UCEP.
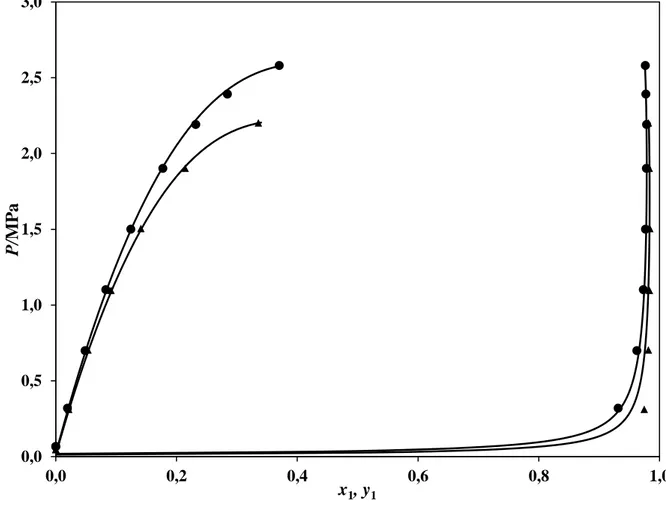
The VLE data set for the system of R-116 and n-hexane is reported in Table 5. Also included in Table 5 are the vapour-liquid-liquid equilibrium (VLLE) and liquid-liquid equilibrium (LLE) data. The VLLE and LLE data points occurred at greater concentrations of R-116. These greater concentrations corresponded to the higher equilibrium pressures. A plot of the experimental VLE data against the data predicted with the model, using the regressed parameters, is given by Figure 3. This system exhibits zeotropic behaviour, with liquid miscibilities occurring at both measured temperatures. This system is therefore most likely to be a type II system. The VLLE and LLE data for the system were not included in the regression. The regressed parameters that gave the best fit of the PR-EOS with the M-C alpha function and the W-S mixing rules, using the NRTL local composition model, to the experimental VLE data for both systems are given in Table 6.
Two summary statistics were used to indicate the degree of correlation between the experimental data and the models. These were the absolute mean relative deviation (MRD) of the regressed compositions and the bias of the regressed compositions. Equation 2 gives the calculation of the absolute mean relative deviation and the calculation of the bias is given by Equation 3. MRD (u)= 100 N ∑ | (uexp-ucal) uexp | N i (2) BIAS (u)= 100 N ∑ ( (u𝑒𝑥𝑝-u𝑐𝑎𝑙) uexp ) N i (3)
In both Equations 2 and 3, u is either the liquid or the vapour composition, and N is the number of experimental data points. ‘exp’ and ‘cal’ denote the experimental and calculated values respectively. The calculated values for the MRD and the bias are given in Table 7.
Conclusions
The vapour-liquid equilibrium measurements for the 116 and n-pentane system and the
R-116 and n-hexane system are reported herein. These measurements were performed using a “static-analytic” type VLE apparatus. Two isotherms were measured for each system, with one isotherm for each system being below the critical temperature of R-116 and the other above
it. The measured VLE data was thereafter correlated with the Peng-Robinson EOS coupled
with the Mathias-Copeman alpha function and the Sandler mixing rules. The
Wong-Sandler mixing rules used the NRTL local composition model to describe the excess Gibbs
energy of the system. Both systems exhibited zeotropic behaviour, with the R-116 + n-pentane
system not exhibiting any liquid immiscibilities at the measured temperatures. The R-116 +
n-hexane system, however, presented a large miscibility gap at the temperatures measured. This
miscibility gap was not modelled with thermodynamic models, due to the limited data that was
available.
Acknowledgement
The authors would like to thank the NRF International Science Liaison Programme. Prof. D.
Ramjugernath would also like to thank MINES ParisTech for the use of the equipment in the
CTP laboratories to enable these measurements to be undertaken.
Author Information
*Corresponding author. E-mail: williams-wynn@ukzn.ac.za. Tel. +27 31 260 3128. Fax: +27 31 260 1118.
Funding Sources
This work is based upon research supported by the South African Research Chairs Initiative of the Department of Science and Technology and National Research Foundation.
References
(1) Ramjugernath, D.; Valtz, A.; Richon, D.; Williams-Wynn, M. D.; Coquelet, C. Isothermal Vapour-Liquid Equilibrium Data for the Hexafluoroethane (R116) + n-Butane System at Temperatures from (273 to 323) K. J. Chem. Eng. Data 2017, 62, 3483-3487. (2) Ramjugernath, D.; Valtz, A.; Coquelet, C.; Richon, D. Isothermal Vapor−Liquid Equilibrium Data for the Hexafluoroethane (R116) + Propane System at Temperatures from (263 to 323) K. J. Chem. Eng. Data 2009, 54, 1292-1296.
(3) Zhang, Y.; Gong, M. Q.; Zhu, H. B.; Wu, J. F. Vapour-Liquid Equilibrium Measurements for Ethane + Hexafluoroethane System over a Temperature Range from (199.64 to 242.93) K. J. Chem. Eng. Data 2005, 50, 2074-2076.
(4) Zhang, Y.; Gong, M. Q.; Zhu, H. B.; Wu, J. F. Vapour-Liquid Equilibrium Measurements and Correlations for an Azeotropic System of Ethane + Hexafluoroethane. Fluid
Phase Equilib. 2006, 240, 73-78.
(5) van Konynenburg, P. H.; Scott, R. L. Critical Lines and Phase Equilibria in Binary Van Der Waals Mixtures. Philos. Trans. R. Soc. 1980, 298, 495-540.
(6) Peng, D. Y.; Robinson, D. B. A New Two-Constant Equation of State. Ind. Eng. Chem.
Fundam. 1976, 15, 59-64.
(7) Mathias, P. M.; Copeman, T. W. Extension of the Peng-Robinson Equation of State to Complex Mixtures: Evaluation of the Various Forms of the Local Composition Concept. Fluid
Phase Equilib. 1983, 13, 91-108.
(8) Wong, D. S. H.; Sandler, S. I. Theoretically Correct Mixing Rule for Cubic Equations of State. AIChE J. 1992, 38, 671-680.
(9) Renon, H.; Prausnitz, J. M. Local Compositions in Thermodynamic Excess Functions for Liquid Mixtures. AIChE J. 1968, 14, 135-144.
(10) Valtz, A.; Coquelet, C.; Baba-Ahmed, A.; Richon, D. Vapour-Liquid Equilibrium Data for the CO2 + 1,1,1,2,3,3,3-Heptafluoropropane (R227ea) System at Temperatures from 276.01
to 367.30 K and Pressures up to 7.4 MPa. Fluid Phase Equilib. 2002, 202, 29-47.
(11) Valtz, A.; Coquelet, C.; Baba-Ahmed, A.; Richon, D. Vapour-Liquid Equilibrium Data for the Propane + 1,1,1,2,3,3,3-Heptafluoropropane (R227ea) System at Temperatures from 293.16 to 353.18 K and Pressures up to 3.4 MPa. Fluid Phase Equilib. 2003, 207, 53-67. (12) Laugier, S.; Richon, D. New Apparatus to Perform Fast Determinations of Mixture Vapour-Liquid Equilibria up to 10 MPa and 423 K. Rev. Sci. Instrum. 1986, 57, 469-472. (13) Taylor, B. N.; Kuyatt, C. E. Guidelines for evaluating and expressing the uncertainty of NIST measurement results; NIST Technical Note 1297; National Institute of Standards and Technology: Gaithersburg, 1994.
(14) Lasala, S.; Chiesa, P.; Privat, R.; Jaubert, J. Optimizing Thermodynamic Models: The Relevance of Molar Fraction Uncertainties. J. Chem. Eng. Data, 2017, 62, 825-832.
(15) Valtz, A.; Coquelet, C.; Richon, D. Vapour-Liquid Equilibrium Data for the Hexafluoroethane + Carbon Dioxide System at Temperatures from 253 to 297 K and Pressures up to 6.5 MPa. Fluid Phase Equilib. 2007, 258, 179-185.
(16) Rice, P.; El-Nikheli, A. Isothermal vapour-liquid equilibrium data for the systems n-pentane with n-hexane, n-octane and n-decane. Fluid Phase Equilib. 1995, 107, 257-267. (17) Duce, C.; Tiné, M. R.; Lepori, L.; Matteoli, E. VLE and LLE of perfluoroalkane + alkane mixtures. Fluid Phase Equilib. 2002, 199, 197–212.
(18) Marrufo, B.; Aucejob, A.; Sanchotello, M.; Lorasb, S. Isobaric vapor–liquid equilibrium for binary mixtures of 1-hexene + n-hexane and cyclohexane + cyclohexene at 30, 60 and 101.3 kPa. Fluid Phase Equilib. 2009, 279, 11-16.
(19) Fernández, L.; Pérez, E.; Ortega, J.; Canosa, J.; Wisniak, J. Measurements of the Excess Properties and Vapor-Liquid Equilibria at 101.32 kPa for Mixtures of Ethyl Ethanoate + Alkanes (from C5 to C10). J. Chem. Eng. Data 2010, 55, 5519-5533.
(20) Dortmund Data Bank (DDB), DDBST Software and Separation Technology GmbH: Oldenburg, Germany.
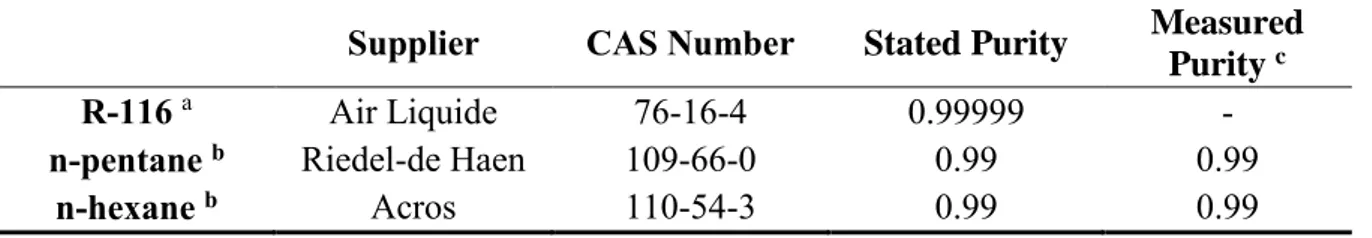
Table 1. Chemical Suppliers, CAS numbers, Stated Purities and Measured Purities
Supplier CAS Number Stated Purity Measured
Purity c
R-116 a Air Liquide 76-16-4 0.99999 -
n-pentane b Riedel-de Haen 109-66-0 0.99 0.99
n-hexane b Acros 110-54-3 0.99 0.99
a Further purification of the R-116 was not undertaken.
b Further purification of these components was performed by degassing in situ. c Estimated from GC area fractions.
Table 2. Critical Properties (Tc, Pc) and Acentric Factors (ω) a
Tc / K Pc / MPa ω
R-116 293.04 3.042 0.229
n-pentane 469.70 3.369 0.251
n-hexane 507.40 3.014 0.296
Table 3. Mathias-Copeman Alpha Function coefficients, ci.
c1 c2 c3
R-116 a 0.79629 -0.55124 0.10316
n-pentane b 0.73224 -0.09516 0.76161
n-hexane c 0.78670 0.01877 0.50091
a Obtained from regression of data found in reference 15
b Obtained from regression of data found in references 16 and 17 c Obtained from regression of data found in references 16-18
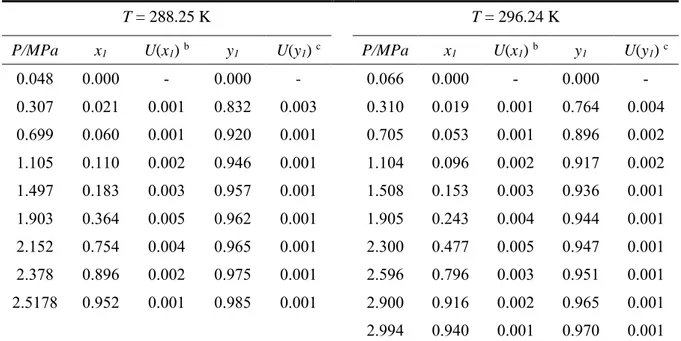
Table 4. Vapour-liquid equilibrium (P-x-y) data for the R-116 (1) + n-Pentane (2) system at
temperatures, T, of 288.25 K and 296.24 K. a
T = 288.25 K T = 296.24 K
P/MPa x1 U(x1) b y1 U(y1) c P/MPa x1 U(x1) b y1 U(y1) c
0.048 0.000 - 0.000 - 0.066 0.000 - 0.000 - 0.307 0.021 0.001 0.832 0.003 0.310 0.019 0.001 0.764 0.004 0.699 0.060 0.001 0.920 0.001 0.705 0.053 0.001 0.896 0.002 1.105 0.110 0.002 0.946 0.001 1.104 0.096 0.002 0.917 0.002 1.497 0.183 0.003 0.957 0.001 1.508 0.153 0.003 0.936 0.001 1.903 0.364 0.005 0.962 0.001 1.905 0.243 0.004 0.944 0.001 2.152 0.754 0.004 0.965 0.001 2.300 0.477 0.005 0.947 0.001 2.378 0.896 0.002 0.975 0.001 2.596 0.796 0.003 0.951 0.001 2.5178 0.952 0.001 0.985 0.001 2.900 0.916 0.002 0.965 0.001 2.994 0.940 0.001 0.970 0.001
a Combined expanded uncertainties are U(P) = 0.0006 MPa and U(T) = 0.03 K (with k = 2) b Combined expanded uncertainty in liquid phase composition (k = 2)
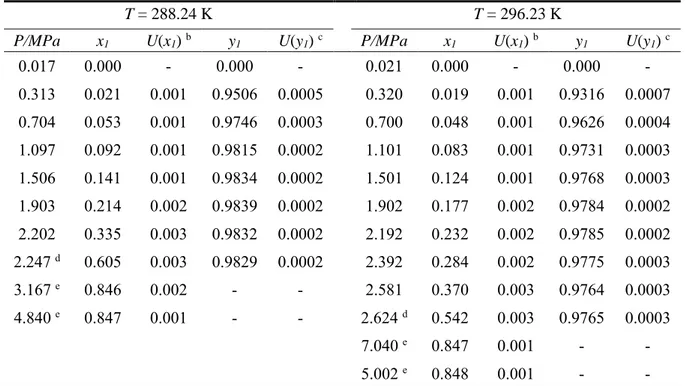
Table 5. Vapour-liquid equilibrium (P-x-y) data for the R-116 (1) + n-hexane (2) system at
temperatures, T, of 288.24 K and 296.23 K. a
T = 288.24 K T = 296.23 K
P/MPa x1 U(x1) b y1 U(y1) c P/MPa x1 U(x1) b y1 U(y1) c
0.017 0.000 - 0.000 - 0.021 0.000 - 0.000 - 0.313 0.021 0.001 0.9506 0.0005 0.320 0.019 0.001 0.9316 0.0007 0.704 0.053 0.001 0.9746 0.0003 0.700 0.048 0.001 0.9626 0.0004 1.097 0.092 0.001 0.9815 0.0002 1.101 0.083 0.001 0.9731 0.0003 1.506 0.141 0.001 0.9834 0.0002 1.501 0.124 0.001 0.9768 0.0003 1.903 0.214 0.002 0.9839 0.0002 1.902 0.177 0.002 0.9784 0.0002 2.202 0.335 0.003 0.9832 0.0002 2.192 0.232 0.002 0.9785 0.0002 2.247 d 0.605 0.003 0.9829 0.0002 2.392 0.284 0.002 0.9775 0.0003 3.167 e 0.846 0.002 - - 2.581 0.370 0.003 0.9764 0.0003 4.840 e 0.847 0.001 - - 2.624 d 0.542 0.003 0.9765 0.0003 7.040 e 0.847 0.001 - - 5.002 e 0.848 0.001 - -
a Combined expanded uncertainties are U(P) = 0.0006 MPa, U(T) = 0.03 (with k = 2). b Combined expanded uncertainty in liquid phase composition (k = 2)
c Combined expanded uncertainty in vapour phase composition (k = 2) d Supposed vapour-liquid-liquid equilibrium.
Table 6. Regressed temperature independent model parameters (𝜏𝑖𝑗 and kij)for the PR-EOS
with the M-C alpha function and the W-S mixing rule using the NRTL local composition model at temperatures, T. R-116 (1) + n-pentane (2) R-116 (1) + n-hexane (2) T / K 288.25 296.24 288.24 296.23 𝜏12/𝐽 ∙ 𝑚𝑜𝑙−1 1323.2 1988.2 4016.5 3583.2 𝜏21/𝐽 ∙ 𝑚𝑜𝑙−1 3621.8 3213.0 2749.7 2692.9 𝑘12 0.356 0.319 0.305 0.332
Table 7. Mean residual deviations and bias of compositions obtained in the fitting of the
experimental VLE data to the PR-EOS with the M-C alpha function and the W-S mixing rule using the NRTL Model
R-116 (1) + n-pentane (2) R-116 (1) + n-hexane (2) T / K 288.25 296.24 288.24 296.23 MRD x % 1.3 1.3 1.3 0.7 bias x % -0.8 -0.8 -0.8 -0.2 MRD y % 0.2 0.2 0.2 0.5 bias y % 0.1 0.1 0.1 -0.4
Figure 1. Vapour pressure of n-hexane. ○, Ref. 16; ∆, Ref. 17; +, Ref. 18; □, Ref. 19; ---,
PR-EOS model with the original alpha function; ──, PR-PR-EOS model with the M-C alpha function.
10 000 15 000 20 000 25 000 30 000 35 000 40 000 45 000 290 295 300 305 310 315 P /P a T/K
Figure 2. P-x-y data for the R116 (1) + n-pentane (2) system. ▲, T = 288.25 K; ●, T = 296.24
K; ──, PR-EOS based model.
0,0 0,5 1,0 1,5 2,0 2,5 3,0 3,5 0,0 0,2 0,4 0,6 0,8 1,0 P/ M P a x1, y1
Figure 3. P-x-y data for the R116 (1) + n-hexane (2) system. ▲, T = 288.24 K; ●, T = 296.23
K; ──, PR-EOS based model.
0,0 0,5 1,0 1,5 2,0 2,5 3,0 0,0 0,2 0,4 0,6 0,8 1,0 P/ M P a x1, y1