American Journal of Epidemiology
© The Author(s) 2017. Published by Oxford University Press on behalf of the Johns Hopkins Bloomberg School of Public Health. This is an Open Access article distributed under the terms of the Creative Commons Attribution Non-Commercial License (http:// creativecommons.org/licenses/by-nc/4.0), which permits non-commercial re-use, distribution, and reproduction in any medium, provided the original work is properly cited. For commercial re-use, please contact journalpermissions@oup.com.
Vol. 186, No. 4 DOI: 10.1093/aje/kwx061 Advance Access publication: June 15, 2017
Practice of Epidemiology
Agreement Between 35 Published Frailty Scores in the General Population
Gloria A. Aguayo*, Anne-Françoise Donneau, Michel T. Vaillant, Anna Schritz, Oscar H. Franco,
Saverio Stranges, Laurent Malisoux, Michèle Guillaume, and Daniel R. Witte
* Correspondence to Dr. Gloria A. Aguayo, Luxembourg Institute of Health, 1A-B rue Thomas Edison, L-1445 Strassen, Luxembourg (e-mail: gloria.aguayo@lih.lu).
Initially submitted March 23, 2016; accepted for publication October 10, 2016.
In elderly populations, frailty is associated with higher mortality risk. Although many frailty scores (FS) have been proposed, no single score is considered the gold standard. We aimed to evaluate the agreement between a wide range of FS in the English Longitudinal Study of Ageing (ELSA). Through a literature search, we identified 35 FS that could be calculated in ELSA wave 2 (2004–2005). We examined agreement between each frailty score and the mean of 35 FS, using a modified Bland-Altman model and Cohen’s kappa (κ). Missing data were imputed. Data from 5,377 participants (ages≥60 years) were analyzed (44.7% men, 55.3% women). FS showed widely differing degrees of agreement with the mean of all scores and between each pair of scores. Frailty classification also showed a very wide range of agreement (Cohen’s κ = 0.10–0.83). Agreement was highest among “accumulation of deficits”-type FS, while accuracy was highest for multidimensional FS. There is marked heterogeneity in the degree to which various FS estimate frailty and in the identification of particular individuals as frail. Different FS are based on different concepts of frailty, and most pairs cannot be assumed to be interchangeable. Research results based on different FS cannot be compared or pooled.
accuracy; agreement; Bland-Altman model; Cohen’s kappa coefficient; disability; elderly population; frailty scores; reliability
Abbreviations: ELSA, English Longitudinal Study of Ageing; FS, frailty scores; M35FS, mean of the 35 analyzed frailty scores.
Vulnerable elderly individuals are increasingly described
in the literature as being frail—that is, having a decreased ability
to recover from an adverse event (1). Three main approaches
have been used to conceptually define frailty.
Thefirst approach is the “phenotype of frailty” (2), which
is a physiological model focused mainly on physical frailty
and which describes frailty as a phenomenon of“weakness,
decreased endurance and slow performance” (2, p. 154). This
approach regards frailty as separate from disability and
comor-bidity. The operational definition of this approach defines
frailty as the presence of at least 3 out of 5 criteria (prefrailty: 1
or 2 criteria). The second approach is“accumulation of
defi-cits” (3), which is based on the accumulation of conditions or
disabilities, emphasizing the number rather than the nature of
deficits. The operational definition of this approach defines
frailty with at least 30 variables (4) and includes disability and
comorbidity (5). The third approach is the“multidimensional
model” (6), which defines frailty as a dynamic state of loss
affecting 1 or more areas of functioning, such as the cognitive, physical, and social domains. Finally, some frailty scores (FS) have been operationalized mainly as the presence of disability.
Frailty is associated with a higher risk of mortality, dis-ability, falls, fractures, hospitalization, and
institutionaliza-tion (7,8). Some evidence indicates that exercise, caloric and
protein support, vitamin D supplementation, and reduction of polypharmacy can be effective in preventing the
progres-sion of frailty and the occurrence of its adverse outcomes (9).
Consequently, it is important to identify frail individuals and
persons at risk at an early stage (7). However, it remains
unclear which tool is best suited for this purpose.
The ability of FS to accurately produce stable and
reproduc-ible results has been partially studied (10). In a systematic
review of FS, Bouillon et al. (11) found that 7 out of 27 scores
had been assessed for both reliability and concurrent or predic-tive validity. In a recent study that assessed the validity and reproducibility of 8 commonly used FS in an elderly European
general population, Theou et al. (12) found that the prevalence of frailty varied from 6.1% to 43.9%; across all 8 scales, 49.3%
of participants were classified as nonfrail and 2.4% were
classi-fied as frail. The authors concluded that FS have significant
dif-ferences regarding validity, feasibility, and predictive ability (12).
The absence of consensus on how to conceptually define
frailty and the resulting plethora of scales and scores
cur-rently hampers both research in thefield and implementation
of frailty assessment in clinical practice. In order to enable comparison of studies of frailty performed with different FS and to facilitate the choice of FS for future studies, it is essen-tial to quantify the degree of agreement between scores and to understand the sources of disagreement.
Based on the hypothesis that different FS may classify dif-ferent subsets of a population as frail, we set out to study the agreement between a wide set of FS in a well-characterized cohort of elderly people: participants in the English Longitu-dinal Study of Ageing (ELSA).
METHODS
Study population/design
ELSA is an ongoing cohort study based on a large, nation-ally representative sample of the middle-aged and elderly (ages ≥50 years) English population. Information about participants
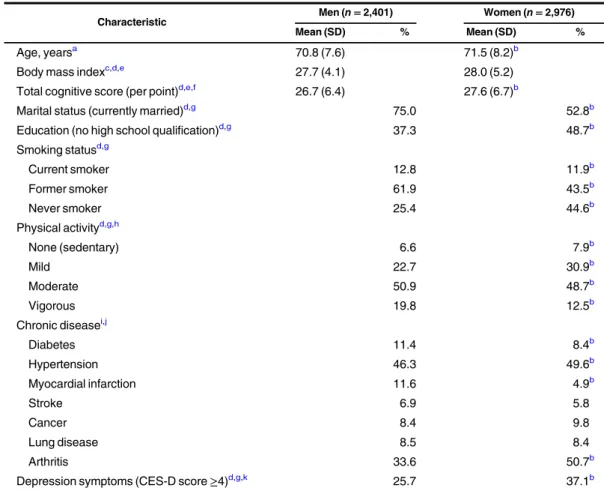
Table 1. General Characteristics of Participants (n = 5,377) in Wave 2 of the English Longitudinal Study of Ageing, 2004–2005
Characteristic Men (n = 2,401) Women (n = 2,976)
Mean (SD) % Mean (SD) %
Age, yearsa 70.8 (7.6) 71.5 (8.2)b
Body mass indexc,d,e 27.7 (4.1) 28.0 (5.2)
Total cognitive score (per point)d,e,f 26.7 (6.4) 27.6 (6.7)b
Marital status (currently married)d,g 75.0 52.8b
Education (no high school qualification)d,g 37.3 48.7b
Smoking statusd,g Current smoker 12.8 11.9b Former smoker 61.9 43.5b Never smoker 25.4 44.6b Physical activityd,g,h None (sedentary) 6.6 7.9b Mild 22.7 30.9b Moderate 50.9 48.7b Vigorous 19.8 12.5b Chronic diseasei,j Diabetes 11.4 8.4b Hypertension 46.3 49.6b Myocardial infarction 11.6 4.9b Stroke 6.9 5.8 Cancer 8.4 9.8 Lung disease 8.5 8.4 Arthritis 33.6 50.7b
Depression symptoms (CES-D score≥4)d,g,k 25.7 37.1b
Abbreviations: CES-D, Center for Epidemiologic Studies Depression Scale; SD, standard deviation.
aP value was derived from an unpaired t test. bP < 0.05.
cWeight (kg)/height (m)2. dImputed data.
eLinear regression model.
fSum of memory and executive indices; values range from 0 (worst) to 50 (best). gLogistic regression.
hSelf-reported frequency of mild, moderate, or vigorous activity at least once per week. iP value was derived from a χ2test.
jSelf-reported ever diagnosis of the condition. kAssessed by means of the 8-item CES-D.
Table 2. Characteristics of Frailty Scores Calculated Among Participants in Wave 2 of the English Longitudinal Study of Ageing, 2004–2005 First Author, Year
(Reference No.) Frailty Measure Country Model Aim
Definition of Score
No. of Variables
Defineda No. of Variables
Calculatedb
% of Missing Datac
Klein, 2003 (23) Beaver Dam Eye Study Index United States POF CD Continuous 4 4 26.5
Gill, 2002 (24) Physical Frailty Index United States POF CS Categorical 2 2 19.1
Cesari, 2014 (25) FiND Questionnaire France POF CD Binary 5 5 1.3
Abellan van Kan, 2008 (26) Frail Scale France POF CS Categorical 5 5 1.3
Fried, 2001 (2) Phenotype of Frailty United States POF CD Categorical 5 5 13.4
Rothman, 2008 (27) Modified Phenotype of Frailty United States POF CD Continuous 7 7 15.8
Ensrud, 2007 (28) Study of Osteoporotic Fractures United States POF CS Categorical 3 3 14.3
Guralnik, 1994 (29) Short Physical Performance Battery United States POF CD Binary 3 3 21.8
Chin, 1999 (30) ZED1 (Physical Activity and Low Energy)
Netherlands POF CD Binary 2 2 0.5
Chin, 1999 (30) ZED2 (Physical Activity and Weight Loss)
Netherlands POF CD Binary 2 2 0.8
Chin, 1999 (30) ZED3 (Physical Activity and Low BMI) Netherlands POF CD Binary 2 2 4.7
Freiheit, 2010 (31) Brief Frailty Index Canada MD CS Binary 5 5 17.3
Hubbard, 2009 (32) Modified Frailty Score United
Kingdom
MD CS Categorical 5 5 21.6
Balducci, 2000 (33) CGAST United States MD CS Categorical 9 9 10.4
Ravaglia, 2008 (34) Conselice Study of Brain Aging Score Italy MD CD Binary 9 9 23.4
Rolfson, 2006 (35) Edmonton Frail Scale Canada MD CS Binary 9 9 12.6
Cacciatore, 2005 (36) Frailty Staging System Italy MD CS Categorical 7 7 3.5
Bellera, 2012 (37) G-8 geriatric screening tool France MD CS Categorical 8 7 4.2
Steverink, 2001 (38) Groningen Frailty Indicator Netherlands MD CS Binary 11 11 14.3
Brody, 1997 (39) Health Status Form United States MD CD Continuous 4 4 11.9
Puts, 2005 (40) Static/Dynamic Frailty Index Netherlands MD CD Binary 9 9 25.3
Maly, 1997 (41) Screening Instrument United States MD CD Binary 6 6 11.3
Hábert, 1996 (42) Sherbrooke Postal Questionnaire Canada MD CD Binary 6 6 14.4
Di Bari, 2014 (43) Inter-Frail Questionnaire Italy MD CD Binary 10 8 14.8
Gobbens, 2010 (44) Tilburg Frailty Indicator Netherlands MD CD Binary 15 15 22.1
Jones, 2004 (45) Comprehensive Geriatric Assessment Canada AOD CD Categorical 44 41 35.1
de Vries, 2013 (46) Evaluative Frailty Index for Physical Activity
Netherlands AOD CD Continuous 50 42 22.8
Searle, 2008 (4) 40-item Frailty Index Canada AOD CD Binary 40 37 23.7
Theou, 2013 (47) 70-item Frailty Index (SHARE) Canada AOD CD Binary 70 62 40.5
Table continues Am J Epidemiol. 2017;186(4):420 – 434 422 Aguayo et al.
is gathered at 2-year intervals (waves). All waves include administration of questionnaires concerning health determi-nants and physical and mental health. In addition, in waves 2, 4, and 6, participants underwent a clinical examination.
Ethical approval was obtained from the National Health Service Research Ethics Committee. Participants gave signed
informed consent (13). ELSA data were accessed via the UK
Data Service.
We carried out a cross-sectional analysis of data from wave
2 (2004–2005) of ELSA, as this was the first wave in which a
comprehensive assessment of frailty indicators was performed. Since not all frailty-related variables were measured in partici-pants under age 60 years, we restricted our analyses to those aged 60 years or more.
Identification and selection of FS
A PubMed search of the literature was performed (date
range: January 1, 1970–August 31, 2015) with the following
query:“((frailty [Title/Abstract]) AND score [Title/Abstract]).”
Abstracts were checked for the publication of an original frailty
score. Furthermore, FS were identified on the basis of
refer-ences from recent review articles (11,14–16). Published FS
were selected for inclusion if at least 80% of the component variables were available in ELSA wave 2. If information on 1 or more underlying variables (maximally 20%) comprising a score was unobtainable from the data, the frailty score was cal-culated based on the available variables and the total score and
the cutoff were refitted to the actual number of variables (17).
Variables for which data were unavailable due to the ELSA study design were not imputed.
FS were calculated while trying to be faithful to the origi-nal scores. However, it was necessary to tailor some vari-ables to the data. For some FS, this adaptation was based on
previous publications (12). FS vary in yielding continuous,
categorical, or binary outputs, each with different ranges.
Each score was rescaled to the interval 0–1 by dividing the
original score output by the highest possible value for each score. Some scores were additionally inverted ((rescaled
score× −1) + 1) to conform to our definition of 0
represent-ing the absence of frailty and 1 representrepresent-ing its presence. Missing data
If data from an available underlying variable in ELSA were missing for some participants, multiple imputation was
applied (18). The amount of missing data varied from 0.04%
to 24.7%.
The maximum percentage of missing data was used to
decide how many imputations to perform (19). Therefore,
we imputed 30 times, using chained equations (the “mice”
package in R (20)). To obtain optimally plausible values for
the scores, we applied imputation to the original underlying variables and calculated FS a posteriori using imputed values.
All statistical analyses were performed on the 30 imputed data sets, and resulting estimates were pooled according to
the Rubin rules (18,21). All results presented in this paper
were obtained on the basis of the multiple imputation proce-dure described above.
Ta ble 2. Con tinued First Author, Year (Reference No.) Frailty Measure Country Model Aim De fi nition of Score No. of Variables De fi ned a No. of Variables Calculated b %o f Missing Data c Fan g, 2012 ( 48 ) Frailty Index (BLSA) China AOD CD Co ntinuous 35 29 17. 5 Kulmin ski, 2007 ( 49 ) Long Term Care Surv ey Frai lty Ind ex United S tates AOD CD Co ntinuous 32 26 0. 9 Dayho ff, 1998 ( 50 ) WHOA FC and self-reported heal th United S tates DA CD Binar y 1 5 1 4 0 .1 Mo rris, 1984 ( 51 ) HRCA V ulner ability Ind ex United S tates DA CD Binar y 1 0 1 0 18. 9 Rock wood , 2005 ( 52 ) CSHA Clin ical Frailty S cale Cana da DA CS Ca tegorical 8 8 0. 2 Saliba , 2001 ( 53 ) Vulner able Elder s Surv ey United S tates DA CD Binar y 1 3 1 2 0 .1 A bbrevia tions: BLS A, Beijin g Longi tudinal S tudy of A geing; BM I, body m ass inde x; CS, cli nical settin g; CD, commu nity-dwelling; CG AST, Co mprehe ns ive Ger iatric Asse ssme nt Scre ening Te sts; CSHA, Cana dian S tudy of Hea lth and Aging ; DA, dis ability ; AOD , acc umulatio n o f d efi cits; E LSA, Englis h Longitud inal S tudy of Agein g; Fi ND, Frail Non-D isable d; HRC A, Hebrew Reha-bilitati on Ce nter for Aged; MD, multidim ension al; POF , pheno type of frailty; SHARE, S urvey of He alth, A geing and Reti rement in Europ e; WHO AFC, Worl d H e alth Org aniza tion Assess ment of Fu nctiona lCapa city; ZED, Zutph en Elder ly S tudy. aNumb er of var iables de fined in th e score. bNumb er of var iables calcula ted with the ELSA dat a set. cP ercent age of missing dat a within E LSA var iables .
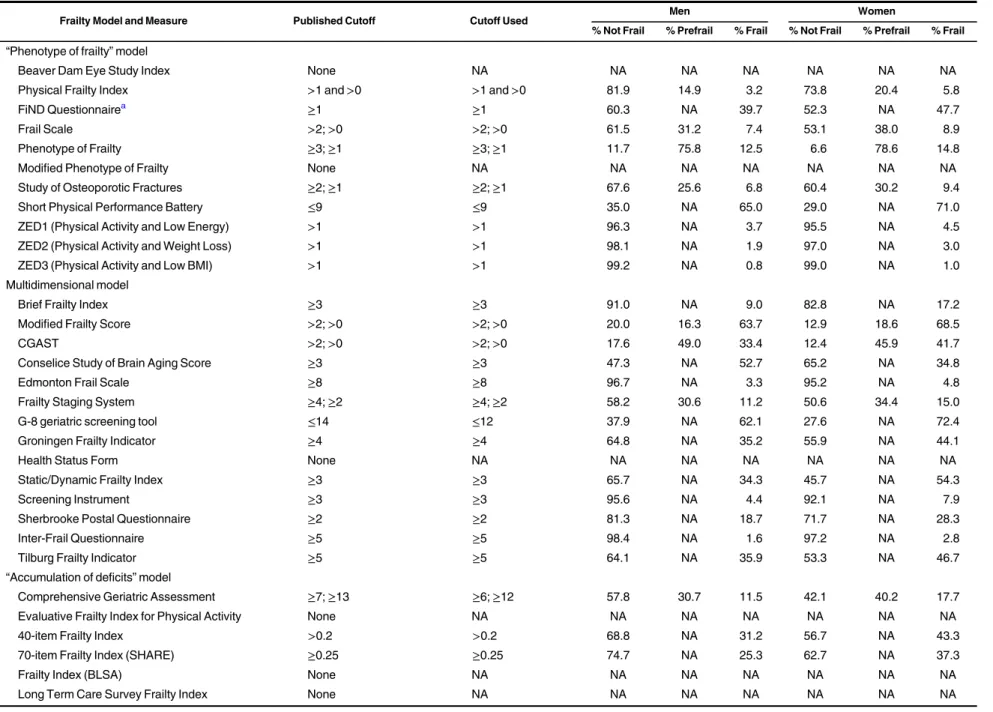
Table 3. Prevalence of Frailty Among Participants in Wave 2 of the English Longitudinal Study of Ageing, 2004–2005
Frailty Model and Measure Published Cutoff Cutoff Used Men Women
% Not Frail % Prefrail % Frail % Not Frail % Prefrail % Frail “Phenotype of frailty” model
Beaver Dam Eye Study Index None NA NA NA NA NA NA NA
Physical Frailty Index >1 and >0 >1 and >0 81.9 14.9 3.2 73.8 20.4 5.8
FiND Questionnairea ≥1 ≥1 60.3 NA 39.7 52.3 NA 47.7
Frail Scale >2; >0 >2; >0 61.5 31.2 7.4 53.1 38.0 8.9
Phenotype of Frailty ≥3; ≥1 ≥3; ≥1 11.7 75.8 12.5 6.6 78.6 14.8
Modified Phenotype of Frailty None NA NA NA NA NA NA NA
Study of Osteoporotic Fractures ≥2; ≥1 ≥2; ≥1 67.6 25.6 6.8 60.4 30.2 9.4
Short Physical Performance Battery ≤9 ≤9 35.0 NA 65.0 29.0 NA 71.0
ZED1 (Physical Activity and Low Energy) >1 >1 96.3 NA 3.7 95.5 NA 4.5
ZED2 (Physical Activity and Weight Loss) >1 >1 98.1 NA 1.9 97.0 NA 3.0
ZED3 (Physical Activity and Low BMI) >1 >1 99.2 NA 0.8 99.0 NA 1.0
Multidimensional model
Brief Frailty Index ≥3 ≥3 91.0 NA 9.0 82.8 NA 17.2
Modified Frailty Score >2; >0 >2; >0 20.0 16.3 63.7 12.9 18.6 68.5
CGAST >2; >0 >2; >0 17.6 49.0 33.4 12.4 45.9 41.7
Conselice Study of Brain Aging Score ≥3 ≥3 47.3 NA 52.7 65.2 NA 34.8
Edmonton Frail Scale ≥8 ≥8 96.7 NA 3.3 95.2 NA 4.8
Frailty Staging System ≥4; ≥2 ≥4; ≥2 58.2 30.6 11.2 50.6 34.4 15.0
G-8 geriatric screening tool ≤14 ≤12 37.9 NA 62.1 27.6 NA 72.4
Groningen Frailty Indicator ≥4 ≥4 64.8 NA 35.2 55.9 NA 44.1
Health Status Form None NA NA NA NA NA NA NA
Static/Dynamic Frailty Index ≥3 ≥3 65.7 NA 34.3 45.7 NA 54.3
Screening Instrument ≥3 ≥3 95.6 NA 4.4 92.1 NA 7.9
Sherbrooke Postal Questionnaire ≥2 ≥2 81.3 NA 18.7 71.7 NA 28.3
Inter-Frail Questionnaire ≥5 ≥5 98.4 NA 1.6 97.2 NA 2.8
Tilburg Frailty Indicator ≥5 ≥5 64.1 NA 35.9 53.3 NA 46.7
“Accumulation of deficits” model
Comprehensive Geriatric Assessment ≥7; ≥13 ≥6; ≥12 57.8 30.7 11.5 42.1 40.2 17.7
Evaluative Frailty Index for Physical Activity None NA NA NA NA NA NA NA
40-item Frailty Index >0.2 >0.2 68.8 NA 31.2 56.7 NA 43.3
70-item Frailty Index (SHARE) ≥0.25 ≥0.25 74.7 NA 25.3 62.7 NA 37.3
Frailty Index (BLSA) None NA NA NA NA NA NA NA
Long Term Care Survey Frailty Index None NA NA NA NA NA NA NA
Table continues Am J Epidemiol. 2017;186(4):420 – 434 424 Aguayo et al.
Statistical analyses
The prevalence of frailty was calculated for each frailty score prior to rescaling using the original, published cutoff points. To enable comparisons between scores, we calculated the mean value, median value, and standard deviation and all further analyses on the rescaled scores in the total population
and also stratified by sex, age, and smoking status.
Agreement was analyzed using 3 parallel methods:
1. The modified Bland-Altman model (22). In the absence
of an external gold standard for frailty, we chose the mean of the 35 analyzed FS (M35FS) as a global
esti-mate of“true frailty.” The error (the difference between
each score and the M35FS) was plotted on the y-axis against the M35FS on the x-axis. Linear regression was
used to calculate the dependence of each score’s error
(over- or underestimation) on the severity of frailty, as well as to calculate its limits of agreement. The degree of under-/overestimation was estimated at the median of the M35FS (model A).
2. Traditional pairwise Bland-Altman models. Traditional pairwise Bland-Altman models were built comparing all 595 possible pairs of FS. The error (the difference be-tween each score and the mean of the 2 compared FS) was
plotted on the y-axis against a rough estimate of the“true
frailty,” defined as the mean of the 2 FS, on the x-axis.
The width of prediction intervals and the absolute error (calculated at the median point on the x-axis) were ana-lyzed (model B).
3. Cohen’s kappa (κ). In order to enable comparisons across
all 595 possible pairs of 35 FS in spite of different underly-ing concepts of frailty, different cutoff points, and the absence of a published cutoff point in some cases, we
also calculatedκ applying an arbitrary cutoff across all
scores (defining the highest 20% of scores as “frail”). In
cases where a score category straddled the 20% cutoff
level, κ was calculated using a 20-bootstrap resample
procedure, which classified participants from the
strad-dling category randomly as frail/nonfrail in the propor-tion necessary to achieve an overall 20% prevalence of
frailty. We calculated 95% confidence intervals for κ on
the basis of Rubin’s method for covariance and
confi-dence interval calculation in imputed data. The mean within-imputation variance, the between-imputations
variance, the total variance, and finally the confidence
intervals were calculated (21).
FS were grouped into 4 main operationalization models: “phenotype of frailty” for scores based mainly on
physi-cal functioning variables;“accumulation of deficits” for
scores based on various domains and at least 30
vari-ables;“multidimensional model” for scores that analyzed
at least 3 domains of functioning and included fewer than
30 variables; and “disability model” for scores based
mainly on disability variables. FS were also grouped ac-cording to the stated target population: community-dwelling or clinical setting.
In addition, to assess agreement with regard to a binary or
categorical definition of frailty, κ was calculated for pairs of
FS with a published cutoff level (29 out of 35 FS).
Table 3. Con tinued Frailty Model and Measure Published Cutoff Cutoff Used Men Women % Not Frail % Prefrail % Frail % Not Frail % Prefrail % Frail Disabi lity m odel WHO AFC and se lf-reporte d health ≥ 21 or S R H = poor b ≥ 4 o r SRH = poor c 81.5 NA 18.5 74. 1 N A 25.9 HRC A Vulner ability Index “A ” box ≥ 1o r“ A ” box = 0 and “B ” box ≥ 0 d “A ” box ≥ 1o r“ A ”box = 0 and “B ”box ≥ 0 d 73.8 NA 26.2 57. 6 N A 42.4 CSHA Cli nical Frail ty Scale 1– 7 ≥ 5 86.8 NA 13.2 83. 0 N A 17.0 Vulne rable Elder s S urvey ≥ 3 ≥ 2. 8 73.9 NA 26.1 63. 5 N A 36.5 Abbr eviatio ns: BLS A, Beijin g Long itudinal Stud y o f Agein g; BM I, body mass index ; CGA ST, Com prehe nsive Ger iatric Asse ssme nt Scr eening Tests; CSHA , Can adian S tudy of Health and Aging; FiND, Frail Non -Disab led; HRCA , Hebrew Re habilita tion Center for Aged; NA, not appl icable ; SHARE, S urvey of Heal th, Ageing and Retirem ent in Euro pe; WHO AFC, Wo rld Heal th Orga nizati on Ass essme nt of Fun ctional Ca pacity ; Z E D , Z u tphen Elderl y Stud y. aFrailty cal culated as frail + disab led. bCutoff calcula ted divid ing eac h variabl e b y 5 . cSelf -rate d health. d“A ”box: list of 7 questi ons; yes = 1, no = 0. “B ”box: 2 additio nal ques tions ; yes = 1, no = 0.
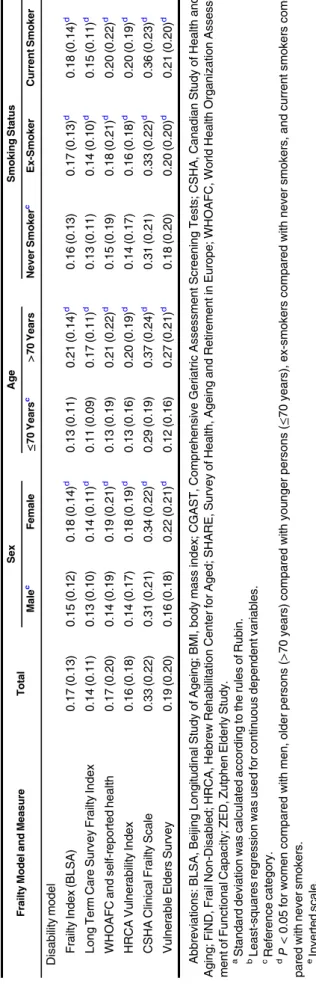
Table 4. Rescaled (0–1) Mean (Standard Deviation)aFrailty Scores and P Values for DifferencesbBetween Frailty Scores, Overall and by Sex, Age, and Smoking Status, Among Participants in Wave 2 of the English Longitudinal Study of Ageing, 2004–2005
Frailty Model and Measure Total Sex Age Smoking Status
Malec Female ≤70 Yearsc >70 Years Never Smokerc Ex-Smoker Current Smoker “Phenotype of frailty” model
Beaver Dam Eye Study Index 0.37 (0.27) 0.37 (0.26) 0.38 (0.28) 0.26 (0.23) 0.49 (0.26)d 0.35 (0.27) 0.37 (0.27)d 0.42 (0.25)d
Physical Frailty Index 0.14 (0.27) 0.11 (0.24) 0.16 (0.29)d 0.07 (0.19) 0.21 (0.32)d 0.13 (0.27) 0.14 (0.27) 0.15 (0.28) FiND Questionnaire 0.23 (0.23) 0.20 (0.22) 0.25 (0.24)d 0.18 (0.20) 0.28 (0.25)d 0.21 (0.22) 0.23 (0.23)d 0.28 (0.24)d
Frail Scale 0.14 (0.20) 0.13 (0.19) 0.16 (0.21)d 0.11 (0.17) 0.19 (0.22)d 0.13 (0.20) 0.15 (0.20)d 0.19 (0.22)d Phenotype of Frailty 0.30 (0.24) 0.27 (0.23) 0.32 (0.24)d 0.23 (0.20) 0.38 (0.25)d 0.28 (0.23) 0.30 (0.23)d 0.34 (0.25)d
Modified Phenotype of Frailty 0.33 (0.23) 0.27 (0.23) 0.35 (0.23)d 0.25 (0.20) 0.41 (0.24)d 0.31 (0.23) 0.33 (0.23)d 0.38 (0.24)d Study of Osteoporotic Fractures 0.15 (0.22) 0.13 (0.21) 0.17 (0.23)d 0.11 (0.19) 0.20 (0.25)d 0.14 (0.22) 0.15 (0.22) 0.19 (0.24)d
Short Physical Performance Batterye 0.34 (0.19) 0.32 (0.17) 0.35 (0.20)d 0.26 (0.15) 0.42 (0.20)d 0.33 (0.19) 0.34 (0.19) 0.34 (0.19) ZED1 (Physical Activity and Low Energy) 0.32 (0.28) 0.29 (0.27) 0.35 (0.28)d 0.27 (0.25) 0.38 (0.29)d 0.30 (0.27) 0.32 (0.28)d 0.39 (0.30)d
ZED2 (Physical Activity and Weight Loss) 0.29 (0.25) 0.27 (0.24) 0.31 (0.25)d 0.24 (0.21) 0.35 (0.27)d 0.29 (0.25) 0.29 (0.24) 0.33 (0.25)d ZED3 (Physical Activity and Low BMI) 0.27 (0.21) 0.24 (0.20) 0.30 (0.22)d 0.23 (0.19) 0.31 (0.22)d 0.26 (0.21) 0.26 (0.20) 0.33 (0.24)d
Multidimensional model
Brief Frailty Index 0.31 (0.22) 0.27 (0.20) 0.34 (0.23)d 0.25 (0.20) 0.37 (0.22)d 0.29 (0.22) 0.31 (0.22) 0.36 (0.22)d
Modified Frailty Score 0.34 (0.22) 0.32 (0.22) 0.37 (0.22)d 0.25 (0.19) 0.45 (0.21)d 0.34 (0.22) 0.34 (0.22) 0.38 (0.21)d
CGAST 0.22 (0.16) 0.20 (0.12) 0.24 (0.16)d 0.19 (0.15) 0.26 (0.16)d 0.21 (0.16) 0.23 (0.16)d 0.25 (0.17)d
Conselice Study of Brain Aging Score 0.32 (0.15) 0.37 (0.15) 0.29 (0.15)d 0.26 (0.13) 0.39 (0.15)d 0.30 (0.15) 0.34 (0.16)d 0.34 (0.15)d Edmonton Frail Scale 0.16 (0.14) 0.15 (0.13) 0.17 (0.14)d 0.13 (0.12) 0.20 (0.14)d 0.15 (0.13) 0.17 (0.13)d 0.19 (0.15)d
Frailty Staging System 0.30 (0.22) 0.28 (0.21) 0.16 (0.21)d 0.22 (0.19) 0.38 (0.23)d 0.28 (0.22) 0.31 (0.22)d 0.32 (0.22)d G-8 geriatric screening toole 0.21 (0.14) 0.19 (0.14) 0.23 (0.15)d 0.16 (0.12) 0.26 (0.15)d 0.20 (0.15) 0.21 (0.14)d 0.24 (0.15)d
Groningen Frailty Indicator 0.25 (0.16) 0.23 (0.15) 0.26 (0.16)d 0.20 (0.14) 0.26 (0.15)d 0.23 (0.15) 0.25 (0.15)d 0.28 (0.16)d Health Status Form 0.16 (0.20) 0.14 (0.19) 0.17 (0.21)d 0.08 (0.14) 0.24 (0.23)d 0.14 (0.20) 0.17 (0.21)d 0.16 (0.19)
Static/Dynamic Frailty Index 0.34 (0.17) 0.30 (0.23) 0.37 (0.17)d 0.27 (0.14) 0.41 (0.17)d 0.33 (0.17) 0.33 (0.17) 0.38 (0.17)d Screening Instrument 0.17 (0.17) 0.13 (0.16) 0.19 (0.18)d 0.14 (0.16) 0.20 (0.18)d 0.16 (0.17) 0.17 (0.17)d 0.19 (0.19)d
Sherbrooke Postal Questionnaire 0.24 (0.17) 0.22 (0.17) 0.26 (0.18)d 0.18 (0.14) 0.30 (0.18)d 0.23 (0.17) 0.24 (0.17) 0.25 (0.17)d Inter-Frail Questionnaire 0.22 (0.17) 0.22 (0.16) 0.23 (0.17)d 0.16 (0.14) 0.27 (0.17)d 0.21 (0.16) 0.22 (0.17) 0.25 (0.17)d
Tilburg Frailty Indicator 0.33 (0.18) 0.30 (0.16) 0.35 (0.18)d 0.27 (0.15) 0.39 (0.18)d 0.32 (0.17) 0.33 (0.17)d 0.37 (0.18)d “Accumulation of deficits” model
Comprehensive Geriatric Assessment 0.18 (0.11) 0.16 (0.11) 0.19 (0.12)d 0.15 (0.10) 0.21 (0.12)d 0.17 (0.11) 0.18 (0.11)d 0.20 (0.12)d Evaluative Frailty Index Physical Activity 0.21 (0.14) 0.19 (0.14) 0.22 (0.15)d 0.17 (0.13) 0.26 (0.15)d 0.19 (0.14) 0.21 (0.14)d 0.24 (0.15)d
40-item Frailty Index 0.20 (0.14) 0.17 (0.13) 0.21 (0.14)d 0.16 (0.12) 0.23 (0.14)d 0.18 (0.14) 0.20 (0.14)d 0.22 (0.15)d 70-item Frailty Index (SHARE) 0.21 (0.14) 0.18 (0.13) 0.23 (0.15)d 0.17 (0.13) 0.25 (0.15)d 0.19 (0.14) 0.21 (0.14)d 0.24 (0.15)d
Table continues Am J Epidemiol. 2017;186(4):420 – 434 426 Aguayo et al.
RESULTS
We analyzed data from all 5,377 participants aged 60 years or over (44.7% men and 55.3% women) who attended the ELSA wave 2 clinical examination.
We identified 67 original FS through the literature search.
Thirty-five of the 67 scores (52.2%) could be calculated with
ELSA wave 2 data. Web Table 1 (available athttps://academic.
oup.com/aje) shows the list of included and excluded FS. Web Table 2 shows details of all variables for the 35 FS and their adapted version in the ELSA data set.
Table1presents the general characteristics of the study
population by sex.
Table2presents the characteristics of the 35 FS that were
analyzed in this study (2,4,23–53). The frailty score with
the highest proportion of individual-level missing values was the 70-item Frailty Index (40.5%), while the lowest
propor-tions of missing values (0.1%) were observed for“WHOAFC
and self-reported health” and the Vulnerable Elders Survey.
Most of the scores (29 of 35) had published cutoffs to define
frailty.
Prevalence as defined by the published cutoffs varied
con-siderably. The mean prevalence of frailty was 23.1% (standard
deviation, 19.7) for men (range, 0.8–65.0) and 28.9%
(stan-dard deviation, 21.9) for women (range, 1.0–72.4) (Table3).
Table4shows the mean frailty score values after rescaling to
the 0–1 range in the whole population globally, as well as
strati-fied by sex, age, and smoking status. Across FS, women, older participants, and smokers/former smokers were frailer than men, younger participants, and never smokers, respectively.
Table5 displays the median κ values. It also shows the
median prediction interval widths and absolute error of under-/ overestimation in analyses based on model A and model B.
Some FS show over- or underestimation, which can be seen when the regression line deviates from 0 at the median point of frailty (0.18) (Web Figure 1). The degree of over- or underestimation can vary according to frailty level. Some scores show wider prediction intervals than others. On the right side of each Bland-Altman plot, a density plot displays the distribution of the error.
The FS that showed the narrowest prediction interval widths were the 40-item Frailty Index with model A and the Comprehensive Geriatric Assessment with model B. Both
FS belong to the“accumulation of deficits” model category.
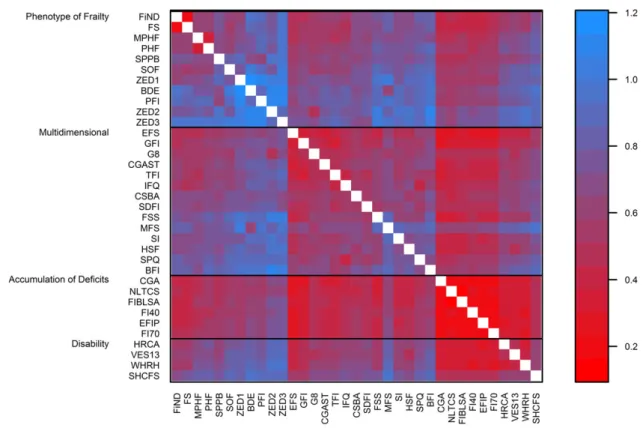
Figure1shows a heat map ofκ values for all 595 pairs of
scores. The scores are grouped by frailty model category and
then sorted by each score’s median κ within each category.
The highestκ value was observed for the Evaluative Frailty
Index for Physical Activity (Table5and Figure1).κ values
ranged from 0.10 to 0.83 and were≥0.80 for 0.8% of pairs,
≥0.60 and <0.80 for 10.4% of pairs, ≥0.40 and <0.60 for
35.3% of pairs, ≥0.20 and <0.40 for 45.9% of pairs, and
<0.20 for 7.6% of pairs (details of estimates and 95% confi-dence intervals are shown in Web Table 3). For the 29 FS
that had a published cutoff point, additional results with κ
calculated using these cutoffs are shown in Web Table 4. Prediction interval widths obtained with model B are
plot-ted as a heat map in Figure2, grouped by frailty model
cate-gory. The narrowest median prediction interval was found
for the 40-item Frailty Index with model A (Table5) and the
Table 4. Con tinued Frailty Model and Measure Total Sex Age Smoking Status Male c Female ≤ 70 Years c > 70 Years Never Smoker c Ex-Smoker Current Smoker Disabi lity m odel Frail ty Ind ex (BLS A) 0.17 (0.13 ) 0.1 5 (0.12) 0. 18 (0.14 ) d 0. 13 (0.11 ) 0.2 1 (0.14) d 0.16 (0.1 3) 0.17 (0.1 3) d 0.18 (0.14) d Long Te rm Ca re Surv ey Frailty Index 0.14 (0.11 ) 0.1 3 (0.10) 0. 14 (0.11 ) d 0. 11 (0.09 ) 0.1 7 (0.11) d 0.13 (0.1 1) 0.14 (0.1 0) d 0.15 (0.11) d WHO AFC and se lf-reporte d health 0.17 (0.20 ) 0.1 4 (0.19) 0. 19 (0.21 ) d 0. 13 (0.19 ) 0.2 1 (0.22) d 0.15 (0.1 9) 0.18 (0.2 1) d 0.20 (0.22) d HRC A Vulner ability Index 0.16 (0.18 ) 0.1 4 (0.17) 0. 18 (0.19 ) d 0. 13 (0.16 ) 0.2 0 (0.19) d 0.14 (0.1 7) 0.16 (0.1 8) d 0.20 (0.19) d CSHA Cli nical Frail ty Scale 0.33 (0.22 ) 0.3 1 (0.21) 0. 34 (0.22 ) d 0. 29 (0.19 ) 0.3 7 (0.24) d 0.31 (0.2 1) 0.33 (0.2 2) d 0.36 (0.23) d Vulne rable Elder s S urvey 0.19 (0.20 ) 0.1 6 (0.18) 0. 22 (0.21 ) d 0. 12 (0.16 ) 0.2 7 (0.21) d 0.18 (0.2 0) 0.20 (0.2 0) d 0.21 (0.20) d Abbr eviatio ns: BLS A, Beijin g Long itudinal Stud y o f Agein g; BM I, body mass index ; CGA ST, Com prehe nsive Ger iatric Asse ssme nt Scr eening Tests; CSHA , Can adian S tudy of Health and Aging; FiND, Frail Non -Disa bled; HRCA, Heb rew Re habilita tion Ce nter for Aged; SHA RE, S urvey of Hea lth, Ageing and Re tiremen t in Europ e; WHOA FC, Wo rld Heal th Organ izatio n Asse ss-me nt of Function al Cap acity ; ZED, Zutp hen E lderly Stud y. aStand ard devia tion wa s calcula ted acc ordin g to the rule s o fRub in. b Least-squares regres sion was used for contin uous depen dent var iable s. cRefe rence catego ry. dP < 0.05 for wom en com pared with men, older persons (> 70 years) comp ared with you nger persons (≤ 70 yea rs), ex-smo kers comp ared with nev er smok ers, and curren t smok ers com-pare d with neve r smok ers. eInverte d scale.
Table 5. Cohen’s Kappa Coefficients for Agreement Between Frailty Scores and Results of Bland-Altman Model Analysis for Participants in Wave 2 of the English Longitudinal Study of Ageing, 2004–2005
Frailty Model and Measure Medianκ Width of Prediction Interval Absolute Error
M35FSa PFSb M35FSa PFSb
“Phenotype of frailty” model
Beaver Dam Eye Study Index 0.318 0.747 0.795 0.123 0.140
Physical Frailty Index 0.298 0.732 0.801 0.113 0.135
FiND Questionnaire 0.508 0.415 0.593 0.025 0.058
Frail Scale 0.391 0.421 0.598 0.099 0.090
Phenotype of Frailty 0.402 0.501 0.663 0.048 0.065
Modified Phenotype of Frailty 0.451 0.427 0.624 0.075 0.096
SOF Index 0.254 0.597 0.736 0.089 0.097
Short Physical Performance Battery 0.396 0.499 0.672 0.102 0.113
ZED1 (Physical Activity and Low Energy) 0.363 0.688 0.759 0.067 0.063
ZED2 (Physical Activity and Weight Loss) 0.191 0.760 0.818 0.057 0.061
ZED3 (Physical Activity and Low BMI) 0.195 0.730 0.907 0.050 0.063
Multidimensional model
Brief Frailty Index 0.316 0.629 0.746 0.073 0.085
Modified Frailty Score 0.293 0.454 0.640 0.076 0.096
CGAST 0.419 0.347 0.552 0.057 0.048
Conselice Study of Brain Aging Score 0.387 0.430 0.600 0.099 0.111
Edmonton Frail Scale 0.454 0.242 0.454 0.092 0.075
Frailty Staging System 0.447 0.500 0.621 0.054 0.068
G-8 geriatric screening tool 0.352 0.355 0.531 0.013 0.064
Groningen Frailty Indicator 0.513 0.280 0.492 0.014 0.065
Health Status Form 0.430 0.485 0.663 0.082 0.072
Static/Dynamic Frailty Index 0.389 0.429 0.612 0.104 0.120
Screening Instrument 0.344 0.479 0.662 0.061 0.053
Sherbrooke Postal Questionnaire 0.305 0.515 0.580 0.015 0.065
Inter-Frail Questionnaire 0.445 0.385 0.699 0.015 0.064
Tilburg Frailty Indicator 0.472 0.339 0.569 0.091 0.111
“Accumulation of deficits” model
Comprehensive Geriatric Assessment 0.493 0.212 0.424 0.042 0.059
Evaluative Frailty Index for Physical Activity 0.536 0.219 0.462 0.024 0.061
40-item Frailty Index 0.535 0.201 0.450 0.035 0.060
70-item Frailty Index (SHARE) 0.518 0.231 0.468 0.021 0.063
Frailty Index (BLSA) 0.500 0.234 0.449 0.060 0.060
Long Term Care Survey Frailty Index 0.435 0.236 0.440 0.080 0.066
Disability model
WHOAFC and self-reported health 0.463 0.436 0.616 0.071 0.065
HRCA Vulnerability Index 0.444 0.391 0.589 0.076 0.066
CSHA Clinical Frailty Scale 0.380 0.561 0.721 0.086 0.093
Vulnerable Elders Survey 0.437 0.392 0.602 0.050 0.050
Abbreviations: BLSA, Beijing Longitudinal Study of Ageing; BMI, body mass index; CGAST, Comprehensive Geriatric Assessment Screening Tests; CSHA, Canadian Study of Health and Aging; FiND, Frail Non-Disabled; HRCA, Hebrew Rehabilitation Center for Aged; M35FS, mean of 35 frailty scores; PFS, pair of frailty scores; SHARE, Survey of Health, Ageing and Retirement in Europe; SOF, Study of Osteoporotic Fractures; WHOAFC, World Health Organization Assessment of Functional Capacity; ZED, Zutphen Elderly Study.
a
Bland-Altman analysis with x-axis equal to the M35FS and y-axis equal to the difference between each score and M35FS; absolute error was calculated at the median value of the M35FS.
b
Bland-Altman analysis with x-axis equal to the mean of PFS and y-axis equal to the difference between each score and the mean of PFS; abso-lute error was calculated at the median value of the mean of PFS.
Am J Epidemiol. 2017;186(4):420–434 428 Aguayo et al.
Comprehensive Geriatric Assessment with model B (Table5
and Figure2). Both FS belong to the“accumulation of
defi-cits” model.
Figure3(grouped by model) shows a heat map of the
abso-lute error calculated with model B. The lowest absoabso-lute error with model B was found for the Comprehensive Geriatric Assessment Screening Tests and, with model A, the G-8
geriat-ric screening tool (Table5). Both FS belonged to the
“multi-dimensional” model (Table5and Figure3). Web Figures 2–4
show results from the same analysis as Figures1–3, grouped
according to the stated target population. Web Figures 5–11
are heat maps ofκ values stratified by sex, age, and smoking
status. Plots of model B are shown in the Web Appendix.
DISCUSSION
We studied the cross-sectional agreement between 35 FS in an elderly population and found a wide range of agreement.
Out of 595 pairs of scores, almost 90% had aκ value under
0.6. Our results, based on both traditional and modified
Bland-Altman models, indicated that FS belonging to the
“accu-mulation of deficits” model with many variables had higher
median agreement (Figure1) and narrower prediction
inter-vals (Figure2) and that FS belonging to the
“multidimen-sional” model had lower absolute errors (Figure 3). Our
results support our initial hypothesis that different FS clas-sify different subsets of the population as frail.
Using the published cutoff values for each frailty score, we found very wide variation in the prevalence of frailty, as
previously reported by others (12,54–56). Scores that define
solely frail and nonfrail categories generally yielded a higher
frailty prevalence than scores that also define an intermediate
“prefrail” state. Even though some variation is to be expected due to the fact that scores have been developed according to
different underlying concepts of frailty, ourfinding of a 70-fold
difference between the highest prevalences (Short Physical Per-formance Battery: 65.0% in men and 72.4% in women) and the Figure 1. Agreement (calculated with Cohen’s κ) between pairs of frailty scores (595 combined pairs of scores) among participants in wave 2 of the English Longitudinal Study of Ageing, 2004–2005. The plot is sorted by frailty model and then from highest (red) to lowest (blue) median value of Cohen’s κ coefficient. BDE, Beaver Dam Eye Study Index; BFI, Brief Frailty Index; BMI, body mass index; MFS, Modified Frailty Score; CGA, Comprehensive Geriatric Assessment; CGAST, Comprehensive Geriatric Assessment Screening Tests; CSBA, Conselice Study of Brain Aging Score; EFIP, Evaluative Frailty Index for Physical Activity; EFS, Edmonton Frail Scale; FI40, 40-item Frailty Index; FI70, 70-item Frailty Index; FIBLSA, Frailty Index Beijing Longitudinal Study of Ageing; PFI, Physical Frailty Index; FiND, Frail Non-Disabled (FiND) Questionnaire; FS, Frail Scale; FSS, Frailty Staging System; G8, G-8 geriatric screening tool; GFI, Groningen Frailty Indicator; HRCA, Hebrew Rehabilitation Center for Aged Vulnerability Index; HSF, Health Status Form; NLTCS, National Long Term Care Survey Frailty Index; PHF, Phenotype of Frailty; MPHF, Modified Phenotype of Frailty; SDFI, Static/Dynamic Frailty Index; SHCFS, Canadian Study of Health and Aging Clinical Frailty Scale; SI, Screen-ing Instrument; SOF, Study of Osteoporotic Fractures; SPPB, Short Physical Performance Battery; SPQ, Sherbrooke Postal Questionnaire; IFQ, Inter-Frail Questionnaire; TFI, Tilburg Frailty Indicator; VES13, Vulnerable Elders Survey; WHOAFC, World Health Organization Assessment of Functional Capacity; WHRH, WHOAFC and self-reported health; ZED1, Zutphen Elderly Study (Physical Activity and Low Energy); ZED2, Zutphen Elderly Study (Physical Activity and Weight Loss); ZED3, Zutphen Elderly Study (Physical Activity and Low BMI).
lowest prevalences (Zutphen Elderly Study (Physical Activity and Low BMI): 0.8% in men and 1.0% in women) indicates that published estimates of frailty prevalence, and consequently our insight into the magnitude of the frailty problem, is depen-dent to an overwhelming degree on the chosen instrument and cutoff level. Comparisons with prevalence estimates from other populations, such as those published in 2012 in a systematic
review (55), therefore need to be undertaken with caution and
preferably only between studies using the same instrument.
Ourfindings also highlight that the general
recommenda-tion that scores and their cutoff levels be recalibrated (by
mod-ification of the weights attached to each item and/or revision
of the optimal cutoff level) before being applied outside their original population is highly applicable and important in the field of frailty. When we regarded FS on a continuous scale from 0 to 1, the between-score variation was still large but less pronounced (a 2.7-fold difference in mean frailty score between the highest (0.35) and the lowest (0.13) scores). This indicates that the problem of the wide divergence in prevalence estimates
is duefirstly to lack of generalizability of cutoff values across
different populations and secondly to different characteris-tics of the scores themselves. The lack of a uniform under-standing of what constitutes frailty is ultimately what underlies the large number of different scores used to mea-sure it and the resulting issues that arise when attempting to compare results.
Given the outlined issues with the use of published cutoff
levels, we focused our study of agreement on identification of
the 20% of individuals who are the most frail. We found that in some cases agreement was as low as 0.1 (10%), which, with a prevalence of 0.2, means that approximately 30% of
indivi-duals would be classified differently. The highest agreement
(0.83 or 83%) translates to about 6% of individuals being
clas-sified differently, at the predefined prevalence of 0.2. Only
11.3% of pairs of scores had aκ value of 0.6 or higher,
indicat-ing that only a small minority of score pairs would identify the same individuals as being frail with an acceptable level of con-sistency. In clinical practice, these low levels of agreement Figure 2. Prediction interval widths obtained with Bland-Altman models for all 595 combined pairs of frailty scores, English Longitudinal Study of Ageing, wave 2 (2004–2005). The narrowest prediction interval widths are shown in red, and the widest are shown in blue. The plot is sorted by frailty model and then by the narrowest prediction interval. BDE, Beaver Dam Eye Study Index; BFI, Brief Frailty Index; BMI, body mass index; MFS, Modified Frailty Score; CGA, Comprehensive Geriatric Assessment; CGAST, Comprehensive Geriatric Assessment Screening Tests; CSBA, Conselice Study of Brain Aging Score; EFIP, Evaluative Frailty Index for Physical Activity; EFS, Edmonton Frail Scale; FI40, 40-item Frailty Index; FI70, 70-item Frailty Index; FIBLSA, Frailty Index Beijing Longitudinal Study of Ageing; PFI, Physical Frailty Index; FiND, Frail Non-Disabled (FiND) Questionnaire; FS, Frail Scale; FSS, Frailty Staging System; G8, G-8 geriatric screening tool; GFI, Groningen Frailty Indicator; HRCA, Hebrew Rehabilitation Center for Aged Vulnerability Index; HSF, Health Status Form; NLTCS, National Long Term Care Survey Frailty Index; PHF, Phenotype of Frailty; MPHF, Modified Phenotype of Frailty; SDFI, Static/Dynamic Frailty Index; SHCFS, Canadian Study of Health and Aging Clini-cal Frailty SClini-cale; SI, Screening Instrument; SOF, Study of Osteoporotic Fractures; SPPB, Short PhysiClini-cal Performance Battery; SPQ, Sherbrooke Postal Questionnaire; IFQ, Inter-Frail Questionnaire; TFI, Tilburg Frailty Indicator; VES13, Vulnerable Elders Survey; WHOAFC, World Health Organization Assessment of Functional Capacity; WHRH, WHOAFC and self-reported health; ZED1, Zutphen Elderly Study (Physical Activity and Low Energy); ZED2, Zutphen Elderly Study (Physical Activity and Weight Loss); ZED3, Zutphen Elderly Study (Physical Activity and Low BMI).
Am J Epidemiol. 2017;186(4):420–434 430 Aguayo et al.
would lead to the selection of largely different people for fur-ther examination or treatment, depending on which tool was implemented.
As a summary measure of agreement,κ has the
disadvan-tage of valuing correct classification of the presence or
absence of the condition in equal measure. Judgement of whether or not this is appropriate will depend on the context in which a score is used. If it is used as part of a sequence of screening steps, sensitivity is likely to be more important
than specificity, while if the score is used to guide treatment
initiation, specificity will be equally important. Additionally,
in a research context, this measure depends on the prevalence
of the condition (with a very low prevalence,κ will be very
low, even with high agreement between raters) (57).
We examined agreement across the entire spectrum of
frailty based on both traditional and modified Bland-Altman
analyses. Traditional pairwise Bland-Altman models regard
the mean of each pair of measures as an indicator of the“true”
value. In our modified Bland-Altman models, we calculated
the M35FS to generate a global indicator of the“true” level of
frailty. Although use of the M35FS as a proxy for the“true”
level of frailty involves making a number of assumptions, such as assigning equal importance to each of the studied scores, we feel that this approach best captures the agreement between each score and the global level of frailty in the absence of an accepted gold standard. The complementary pairwise analyses based on traditional Bland-Altman models
largely confirmed the finding of better agreement for FS with
numerous variables and lower error for FS from the
multidi-mensional model category (Table5).
Several scores tended to progressively under- or
overesti-mate frailty at higher levels of“true” frailty, indicating that
they would require recalibration not only of the distribution or cutoff level but also of the relative weight attached to each Figure 3. Absolute error (over-/underestimation) of frailty in the median frailty value from the modified Bland-Altman model obtained with all 595 combined pairs of frailty scores, English Longitudinal Study of Ageing, wave 2 (2004–2005). The over-/underestimation is the absolute value of the intercept plus the product of the slope and the median. The intercept and slope are obtained from the Bland-Altman model. The median is calculated as the median value of the mean of 2 frailty scores for each pair. The lowest absolute errors are shown in red, and the highest are shown in blue. The plot is sorted by frailty model and then by the lowest absolute error. BDE, Beaver Dam Eye Study Index; BFI, Brief Frailty Index; BMI, body mass index; MFS, Modified Frailty Score; CGA, Comprehensive Geriatric Assessment; CGAST, Comprehensive Geriatric Assessment Screening Tests; CSBA, Conselice Study of Brain Aging Score; EFIP, Evaluative Frailty Index for Physical Activity; EFS, Edmonton Frail Scale; FI40, 40-item Frailty Index; FI70, 70-item Frailty Index; FIBLSA, Frailty Index Beijing Longitudinal Study of Ageing; PFI, Physical Frailty Index; FiND, Frail Non-Disabled (FiND) Questionnaire; FS, Frail Scale; FSS, Frailty Staging System; G8, G-8 geriatric screening tool; GFI, Groningen Frailty Indicator; HRCA, Hebrew Rehabilitation Center for Aged Vulnerability Index; HSF, Health Status Form; NLTCS, National Long Term Care Survey Frailty Index; PHF, Phenotype of Frailty; MPHF, Modified Phenotype of Frailty; SDFI, Static/Dynamic Frailty Index; SHCFS, Canadian Study of Health and Aging Clinical Frailty Scale; SI, Screening Instrument; SOF, Study of Osteoporotic Fractures; SPPB, Short Physical Performance Battery; SPQ, Sher-brooke Postal Questionnaire; IFQ, Inter-Frail Questionnaire; TFI, Tilburg Frailty Indicator; VES13, Vulnerable Elders Survey; WHOAFC, World Health Organization Assessment of Functional Capacity; WHRH, WHOAFC and self-reported health; ZED1, Zutphen Elderly Study (Physical Activity and Low Energy); ZED2, Zutphen Elderly Study (Physical Activity and Weight Loss); ZED3, Zutphen Elderly Study (Physical Activity and Low BMI).
underlying variable to avoid producing biased frailty estimates in the ELSA population. Several scores showed remarkably wide prediction intervals, indicating a poor capacity to
accu-rately assess the“true” level of frailty.
The narrowest prediction intervals were observed for the
FS from the “accumulation of deficits” model category,
which were also the FS with the best agreement across all
score pairs based onκ values. In general, scores based on a
larger number of variables tended to have narrower predic-tion intervals and higher overall agreement, but with a certain degree of underestimation in the higher frailty ranges. Scores that were multidimensional tended to have less error at the median point of frailty.
While features such as accuracy, overall agreement, and bias are important considerations guiding a choice of score for research or clinical practice, practical feasibility is likely to be as important. Although we observed the highest overall agreement between scores derived from numerous variables,
these scores may be difficult to implement in practice due to
the high demands on time, expertise, and equipment required to obtain a valid and complete set of the necessary data. When we categorized our results by the intended setting (clinical or community-based) in supplementary analyses, we observed similar variability in agreement both within and between these 2 kinds of settings (Web Figures 2 and 3). Which score strikes the optimal balance between feasibility and performance is likely to be different in each situation. Our results may help guide these decisions.
The main strengths of the present study are that we analyzed agreement between the most comprehensive list of FS exam-ined to date in a large sample representative of an elderly gen-eral population, based on data including self-reported and objective measures of determinants and characteristics of frailty. We applied 3 different approaches to the study of
agree-ment, finding broadly consistent results. In addition, we
applied multiple imputation, using a state-of-the art method. The main limitation of our study is that in the absence of an external gold standard, our analyses of agreement between the
continuous scores depended on an internal proxy for“true”
frailty, defined either specifically for each pair of scores or
globally as the M35FS. Our adaptation of some scores to the data available in ELSA may have led to some degree of
distor-tion in comparison with the original score definition. However,
this affected only a minority of scores and is unlikely to have
determined our mainfindings. Finally, due to the cross-sectional
design of the present analysis, we cannot draw conclusions regarding dynamic features of the scores (such as longitudinal stability) or about other aspects (such as external validity) with regard to frailty outcomes.
Our comparative study of different features of agreement in a wide set of published FS showed marked heterogeneity in the degree to which various FS over-/underestimate frailty
and agree on the identification of particular individuals as
frail. Different scores are based on different concepts of frailty, and most pairs cannot be assumed to be interchange-able. Research results based on different scores cannot be compared, pooled, or summarized directly. Our results sup-port a multidimensional concept of frailty that includes many variables.
ACKNOWLEDGMENTS
Author affiliations: Department of Population Health,
Luxembourg Institute of Health, Strassen, Luxembourg (Gloria A. Aguayo, Saverio Stranges, Laurent Malisoux); Department of Public Health Sciences, Faculty of Medicine, University of Liège, Liège, Belgium (Anne-Françoise Donneau, Michèle Guillaume); Competence Center for Methodology and Statistics, Luxembourg Institute of Health, Strassen, Luxembourg (Michel T. Vaillant, Anna Schritz); Department of Epidemiology, Erasmus Medical Center, Rotterdam, the Netherlands (Oscar H. Franco); Department of Public Health, Faculty of Health, Aarhus University, Aarhus, Denmark (Daniel R. Witte); and Danish Diabetes Academy, Odense University Hospital, Odense, Denmark (Daniel R. Witte).
This work was supported by the Ministry of Higher Education and Research of Luxembourg.
We thank Ronald F. Herrera, Didier Brems, and François Fays for their contributions to this study.
Preliminary results of this study were presented at the 50th meeting of the European Diabetes Epidemiology Group,
Chantilly, France, April 25–28, 2015, and at the “Methods in
Epidemiology” symposium organized by the Epidemiology
Research Group at the University of Leuven, Leuven, Belgium, September 17, 2015.
The data used in this analysis were made available through the United Kingdom Data Archive and were accessed via the UK Data Service (data-sharing project
82538) (13). The English Longitudinal Study of Ageing
(ELSA) was initiated by a team of researchers based at NatCen Social Research, University College London, and the Institute for Fiscal Studies. The data were collected by NatCen Social Research. Funding for ELSA is provided by the US National Institute of Aging and a consortium of United Kingdom government departments coordinated by
the Office for National Statistics. The developers and funders
of ELSA and the United Kingdom Data Archive do not bear any responsibility for the analyses or interpretations presented here.
Conflict of interest: none declared.
REFERENCES
1. Fried LP, Ferrucci L, Darer J, et al. Untangling the concepts of disability, frailty, and comorbidity: implications for improved targeting and care. J Gerontol A Biol Sci Med Sci. 2004;59(3): 255–263.
2. Fried LP, Tangen CM, Walston J, et al. Frailty in older adults: evidence for a phenotype. J Gerontol A Biol Sci Med Sci. 2001; 56(3):M146–M156.
3. Mitnitski AB, Mogilner AJ, Rockwood K. Accumulation of deficits as a proxy measure of aging. ScientificWorldJournal. 2001;1:323–336.
4. Searle SD, Mitnitski A, Gahbauer EA, et al. A standard procedure for creating a frailty index. BMC Geriatr. 2008;8:24. 5. Chen X, Mao G, Leng SX. Frailty syndrome: an overview. Clin
Interv Aging. 2014;9:433–441.
Am J Epidemiol. 2017;186(4):420–434 432 Aguayo et al.
6. Gobbens RJ, Luijkx KG, Wijnen-Sponselee MT, et al. In search of an integral conceptual definition of frailty: opinions of experts. J Am Med Dir Assoc. 2010;11(5):338–343. 7. Fairhall N, Langron C, Sherrington C, et al. Treating frailty—a
practical guide. BMC Med. 2011;9:83.
8. Cawthon PM, Marshall LM, Michael Y, et al. Frailty in older men: prevalence, progression, and relationship with mortality. J Am Geriatr Soc. 2007;55(8):1216–1223.
9. Morley JE, Vellas B, Abellan van Kan G, et al. Frailty consensus: a call to action. J Am Med Dir Assoc. 2013;14(6): 392–397.
10. De Vries N, Staal J, Van Ravensberg C, et al. Outcome instruments to measure frailty: a systematic review. Ageing Res Rev. 2011;10(1):104–114.
11. Bouillon K, Kivimaki M, Hamer M, et al. Measures of frailty in population-based studies: an overview. BMC Geriatr. 2013;13: 64.
12. Theou O, Brothers TD, Mitnitski A, et al. Operationalization of frailty using eight commonly used scales and comparison of their ability to predict all-cause mortality. J Am Geriatr Soc. 2013;61(9):1537–1551.
13. Marmot M, Oldfield Z, Clemens S, et al. English Longitudinal Study of Ageing: Waves 0–6, 1998–2013. (Data collection). Colchester, United Kingdom: UK Data Service; 2015.https:// discover.ukdataservice.ac.uk/doi?sn=5050#10. Updated May 17, 2016. Accessed January 11, 2016.
14. Abellan van Kan G, Rolland Y, Bergman H, et al. The I.A.N.A. Task Force on frailty assessment of older people in clinical practice. J Nutr Health Aging. 2008;12(1):29–37. 15. Pel-Littel RE, Schuurmans MJ Emmelot-Vonk MH, et al.
Frailty: defining and measuring of a concept. J Nutr Health Aging. 2009;13(4):390–394.
16. Sternberg SA, Schwartz AW, Karunananthan S, et al. The identification of frailty: a systematic literature review. J Am Geriatr Soc. 2011;59(11):2129–2138.
17. Peters LL, Boter H, Buskens E, et al. Measurement properties of the Groningen Frailty Indicator in home-dwelling and institutionalized elderly people. J Am Med Dir Assoc. 2012; 13(6):546–551.
18. Rubin DB. Multiple Imputation for Nonresponse in Surveys. Hoboken, NJ: John Wiley & Sons, Inc.; 2004.
19. White IR, Royston P, Wood AM. Multiple imputation using chained equations: issues and guidance for practice. Stat Med. 2011;30(4):377–399.
20. van Buuren S, Groothuis-Oudshoorn K. MICE: multivariate imputation by chained equations in R. J Stat Softw. 2011; 45(3):1–67.
21. Schafer JL, Graham JW. Missing data: our view of the state of the art. Psychol Methods. 2002;7(2):147–177.
22. Bland JM, Altman DG. Statistical methods for assessing agreement between two methods of clinical measurement. Lancet. 1986;327(8476):307–310.
23. Klein BE, Klein R, Knudtson MD, et al. Relationship of measures of frailty to visual function: the Beaver Dam Eye Study. Trans Am Ophthalmol Soc. 2003;101:191–196. 24. Gill TM, Baker DI, Gottschalk M, et al. A program to prevent
functional decline in physically frail, elderly persons who live at home. N Engl J Med. 2002;347(14):1068–1074.
25. Cesari M, Demougeot L, Boccalon H, et al. A self-reported screening tool for detecting community-dwelling older persons with frailty syndrome in the absence of mobility disability: the FiND questionnaire. PLoS One. 2014;9(7):e101745. 26. Abellan van Kan G, Rolland YM, Morley JE, et al. Frailty:
toward a clinical definition. J Am Med Dir Assoc. 2008;9(2): 71–72.
27. Rothman MD, Leo-Summers L, Gill TM. Prognostic significance of potential frailty criteria. J Am Geriatr Soc. 2008;56(12):2211–2216.
28. Ensrud KE, Ewing SK, Taylor BC, et al. Frailty and risk of falls, fracture, and mortality in older women: the Study of Osteoporotic Fractures. J Gerontol A Biol Sci Med Sci. 2007; 62(7):744–751.
29. Guralnik JM, Simonsick EM, Ferrucci L, et al. A short physical performance battery assessing lower extremity function:
association with self-reported disability and prediction of mortality and nursing home admission. J Gerontol. 1994;49(2):M85–M94. 30. Chin APMJ, Dekker JM, Feskens EJ, et al. How to select a frail
elderly population? A comparison of three working definitions. J Clin Epidemiol. 1999;52(11):1015–1021.
31. Freiheit EA, Hogan DB, Eliasziw M, et al. Development of a frailty index for patients with coronary artery disease. J Am Geriatr Soc. 2010;58(8):1526–1531.
32. Hubbard RE, O’Mahony MS, Woodhouse KW. Characterising frailty in the clinical setting—a comparison of different approaches. Age Ageing. 2009;38(1):115–119.
33. Balducci L, Extermann M. Management of cancer in the older person: a practical approach. Oncologist. 2000;5(3):224–237. 34. Ravaglia G, Forti P, Lucicesare A, et al. Development of an
easy prognostic score for frailty outcomes in the aged. Age Ageing. 2008;37(2):161–166.
35. Rolfson DB, Majumdar SR, Tsuyuki RT, et al. Validity and reliability of the Edmonton Frail Scale. Age Ageing. 2006; 35(5):526–529.
36. Cacciatore F, Abete P, Mazzella F, et al. Frailty predicts long‐ term mortality in elderly subjects with chronic heart failure. Eur J Clin Invest. 2005;35(12):723–730.
37. Bellera CA, Rainfray M, Mathoulin-Pélissier S, et al. Screening older cancer patients:first evaluation of the G-8 geriatric screening tool. Ann Oncol. 2012;23(8):2166–2172. 38. Steverink N, Slaets JP, Schuurmans H, et al. Measuring frailty:
developing and testing the GFI (Groningen Frailty Indicator). Gerontologist. 2001;41(special issue I):236–237.
39. Brody KK, Johnson RE, Ried LD. Evaluation of a self-report screening instrument to predict frailty outcomes in aging populations. Gerontologist. 1997;37(2):182–191.
40. Puts M, Lips P, Deeg D. Static and dynamic measures of frailty predicted decline in performance-based and self-reported physical functioning. J Clin Epidemiol. 2005;58(11):1188–1198. 41. Maly RC, Hirsch SH, Reuben DB. The performance of simple
instruments in detecting geriatric conditions and selecting community-dwelling older people for geriatric assessment. Age Ageing. 1997;26(3):223–231.
42. Hábert R, Bravo G, Korner-Bitensky N, et al. Predictive validity of a postal questionnaire for screening community-dwelling elderly individuals at risk of functional decline. Age Ageing. 1996;25(2):159–167.
43. Di Bari M, Profili F, Bandinelli S, et al. Screening for frailty in older adults using a postal questionnaire: rationale, methods, and instruments validation of the INTER-FRAIL study. J Am Geriatr Soc. 2014;62(10):1933–1937.
44. Gobbens RJ, van Assen MA, Luijkx KG, et al. The Tilburg Frailty Indicator: psychometric properties. J Am Med Dir Assoc. 2010;11(5):344–355.
45. Jones DM, Song X, Rockwood K. Operationalizing a frailty index from a standardized comprehensive geriatric assessment. J Am Geriatr Soc. 2004;52(11):1929–1933.
46. de Vries NM, Staal JB, Olde Rikkert MG, et al. Evaluative Frailty Index for Physical Activity (EFIP): a reliable and valid instrument to measure changes in level of frailty. Phys Ther. 2013;93(4):551–561.
47. Theou O, Brothers TD, Rockwood MR, et al. Exploring the relationship between national economic indicators and relative fitness and frailty in middle-aged and older Europeans. Age Ageing. 2013;42(5):614–619.
48. Fang X, Shi J, Song X, et al. Frailty in relation to the risk of falls, fractures, and mortality in older Chinese adults: results from the Beijing Longitudinal Study of Aging. J Nutr Health Aging. 2012;16(10):903–907.
49. Kulminski A, Yashin A, Arbeev K, et al. Cumulative index of health disorders as an indicator of aging-associated processes in the elderly: results from analyses of the National Long Term Care Survey. Mech Ageing Dev. 2007;128(3):250–258. 50. Dayhoff NE, Suhrheinrich J, Wigglesworth J, et al. Balance
and muscle strength as predictors of frailty among older adults. J Gerontol Nurs. 1998;24(7):18–27.
51. Morris JN, Sherwood S, Mor V. An assessment tool for use in identifying functionally vulnerable persons in the community. Gerontologist. 1984;24(4):373–379.
52. Rockwood K, Song X, MacKnight C, et al. A global clinical measure offitness and frailty in elderly people. CMAJ. 2005; 173(5):489–495.
53. Saliba D, Elliott M, Rubenstein LZ, et al. The Vulnerable Elders Survey: a tool for identifying vulnerable older people in the community. J Am Geriatr Soc. 2001;49(12):1691–1699. 54. van Iersel MB, Rikkert M. Frailty criteria give heterogeneous
results when applied in clinical practice. J Am Geriatr Soc. 2006;54(4):728–729.
55. Collard RM, Boter H, Schoevers RA, et al. Prevalence of frailty in community‐dwelling older persons: a systematic review. J Am Geriatr Soc. 2012;60(8):1487–1492. 56. Gale CR, Cooper C, Sayer AA. Prevalence of frailty and
disability:findings from the English Longitudinal Study of Ageing. Age Ageing. 2015;44(1):162–165.
57. Sim J, Wright CC. The kappa statistic in reliability studies: use, interpretation, and sample size requirements. Phys Ther. 2005; 85(3):257–268.
Am J Epidemiol. 2017;186(4):420–434 434 Aguayo et al.