Age-dependent expression of
osteochondrosis-related genes in equine
leukocytes
L. Mendoza,1,2D. Piquemal,3,4,5J. P. Lejeune,2L. Vander Heyden,2F. Noguier,5 R. Bruno,5C. Sandersen,1D. Serteyn1,2
To cite: Mendoza L,et al. Age-dependent expression of osteochondrosis-related genes in equine leukocytes. Vet Rec Open 2015;2: e000058. doi:10.1136/ vetreco-2014-000058 ▸ Prepublication history for this paper are available online. To view these files please visit the journal online (http://dx.doi.org/10.1136/ vetreco-2014-000058). Received 3 June 2014 Revised 25 November 2014 Accepted 16 December 2014 This final article is available for use under the terms of the Creative Commons Attribution Non-Commercial 3.0 Licence; see
http://vetreco.bmj.com
For numbered affiliations see end of article.
Correspondence to Dr Didier Serteyn; [email protected]
ABSTRACT
Introduction: Osteochondrosis (OC) is a developmental disease in horses which has a significant impact on the horse’s welfare and performance. The early disturbance in the process of endochondral ossification progresses to inflammatory and repair processes in older horses. Previously, differentially expressed genes in leukocytes of OC-affected horses have been identified. The aim of the present study is to detect age-related changes in these differentially expressed genes.
Materials and Methods: The expression of OC-related genes was analysed by real-time PCR and subsequent statistical analysis (ΔΔCT) in the leukocytes of 135 Belgian Warmblood horses divided into three different age groups: <12 months (n=47), 18–24 months (n=50) >30 months (n=38).
Results: Relative expression of genes of horses less than 12 months of age showed significant induction of the genes MGAT4A, PRKCG, MHCI, ApoB, ApoB3G, B4GALT6 and a significantly lower expression of the genes OAS3. Horses of 18–24 months of age, showed a significantly higher expression of the genes TBC1D9, MGAT4A, IFIH1, MHCIIa and MMP1. Horses of more than 30 months of age showed a significantly higher expression of the genes MGAT4A, HP, SECTM1 compared with their age-matched control groups. Conclusions: The study demonstrates that OC-related genes are differentially expressed in horses of different ages compared with their age-matched controls. Some of the genes may be implicated in cell signalling and differentiation as well as carbohydrate and lipid metabolism and inflammation. However, the causal relationship between the differentially expressed genes and the development and progression of the OC lesions needs to be determined.
INTRODUCTION
Osteochondrosis (OC) is a developmental disease of growing horses. It is defined as a disturbance in the process of endochondral ossification (Rejnö and Strömberg 1978). The disturbance can lead to the formation of detached fragments (osteochondrosis disse-cans (OCD)), fissures, or subchondral bone
cysts at the epiphyseal growth cartilage (Rejnö and Strömberg 1978, Ytrehus and others 2007). OCD is a frequent cause of pain, lameness and reduced performance in young athletic horses (McIlwraith 1993,
Verwilghen and others 2013).
The disease appears to be multifactorial in origin, including skeletal growth rates, nutri-tion, endocrinological factors, exercise, bio-mechanics and genetic effects (Jeffcott 1991). Several studies have demonstrated dif-ferentially expressed genes like, for example, Indian hedgehog (Ihh), transforming growth factor β 1 (TGF-β 1), Gli1 and insulin-like growth factor I (IGF-I) parathyroid hormone-related peptide (PTH-rP) in the cartilage of OC-affected horses (Semevolos and others 2001,2002, 2005,Zabek and others 2002).
In a previous study, we analysed the tran-script profile of leukocytes from horses affected with OC using a high throughput sequencing method (Serteyn and others 2010). Metabolic pathway analysis showed an obvious dysregulation of several signalling pathways related to cartilage formation and cartilage repair, such as Wnt, Indian hedgehog and TGF-β signalling pathways. Other genes that were differentially regulated may play a role in high-carbohydrate diet, abnormal insulin metabolism or inflammation (Serteyn and others 2010). Horses of this study had a mean age of 2.5 years and were relatively old regarding the origin of the disease. OC occurs early in the age of the horse (Lecocq and others 2008). The lesions undergo a variety of processes until they become visible as radio-graphic finding. Thereafter they may become modified by regenerative or degenerative pro-cesses (Jacket and others 2013). The global aim of our research is to find biomarkers of samples which can be easily obtained. The suit-ability of leukocytes for gene profiling is related to their active metabolism and accessi-bility by simple venipuncture (Liew and others
2006). The aim of the present study is to investigate the leukocyte gene expression of horses of different age groups with OC lesions.
MATERIALS AND METHODS
One hundred and thirty-five Belgian Warmblood horses were selected for this study, which followed a ‘case control study’ model. Selection was made on the base of the undoubtable results of the radiographies among the horses presented at the European Centre of the horse (Vielsalm, Belgium) by the breeders in the context of an orthopaedic diseases screening programme. OC-affected horses were classified into three different age groups: <12 months (AGE 1, n=35), 18–24 months (AGE 2, n=38), >30 months (AGE 3, n=26). Furthermore, 36 horses (AGE 1: n=12, AGE 2: n=12, AGE 3: n=12) without any evidence of OC lesions were selected and analysed as control groups.
All horses were sedated for the radiographic examin-ation using detomidine (0.01 mg/kg intravenously) alone or combined with butorphanol (0.02 mg/kg intra-venously). The following views were taken: lateromedial views of the four fetlocks, lateromedial and plantarolateral-dorsomedial oblique views of the hocks and a lateromedial view of the stifles. Horses were diag-nosed on the basis of characteristic lesions of abnormal endochondral ossification located in the metacarpo and metarso phalangeal tibiotarsal, and femoro-patellar joints (Denoix and others 2013). Concerning the fetlock joint, fragmentation and irregularity observed on the dorsal aspect of the sagittal ridge and the condyles of the metacarpus or metatarsus were considered as OC lesions. Horses with dorsal, palmar or plantar fragmenta-tions at the margin of the proximal phalanx were not included in this study. Concerning the hock, OC lesions were identified as fragments still in place (intermediate ridge) or surface irregularities of the trochlear ridge(s) or malleolus. Concerning the stifle joint, variably sized irregularity orflattening of the lateral trochlear ridge of the femur with sometimes partial calcification of the tissue within the defect were considered as OC lesions.
Horses with osteoarthritis and other radiological abnormalities, which were not clearly OC lesions, were excluded from this study. Blood was collected from each horse with PAXgene blood RNA tubes (BD Diagnostics, Le Pont de Claix, France) and frozen at−80°C for later analysis.
Total RNA was extracted from whole blood (2.5 ml)
using the PAXgene blood RNA kit (Qiagen,
Courtaboeuf, France). The integrity of total RNA extracted using the PAXgene method was checked by capillary electrophoresis analysis on Agilent BioAnalyser 2100 (Agilent, Palo Alto, California, USA). RNA quantity was measured using a spectrophotometer NanoDrop ND-1000 (Thermo Scientific, Les Ulis, France).
cDNA was synthesised using∼300 ng of total RNA and performed, using the VILO reverse transcription Kit,
according to the manufacturer’s protocol (Invitrogen, Cergy Pontoise, France).
Pre-amplification was performed with a 22 pooled (final 0.2× of each) SYBR Green assay. After pre-amplification PCR, the product was treated with 4 U of Exonuclease I (NEB) then diluted 1:5 with 1× TE Buffer and stored in−80°C until needed. Quantitative PCR was carried out using the 96.96 dynamic array (Fluidigm Corporation, California, USA) following the manufac-turer’s protocol. Specifically, a 5 μl sample mixture was prepared for each sample containing 1× TaqMan Gene Expression Master Mix, 1× GE Sample Loading Reagent (Fluidigm PN 85000746), 1× EvaGreen (Interchim) and each of diluted pre-amplified cDNA. 5 μl of Assay mix was prepared with 1× each of SYBR Green assay and 1× Assay Loading Reagent (Fluidigm PN 85000736). An IFC controller was used to prime the fluidics array (chip) with control linefluid and then with samples and assay mixes in the appropriate inlets. After loading, the chip was placed in the BioMark Instrument for a first step of thermal mixing at 50°C for two minutes, 70°C for 30 minutes and 25°C for 10 minutes, then UNG & HotStart step at 50°C for two minutes followed by 95°C for two minutes. PCR was performed by 35 cycles at 95° C for 15 seconds and 60°C for one minute. Finally, melting curve was performed by increasing temperature from 60 to 95°C. The data were analysed with Real-Time PCR Analysis Software in the BIOMARK instrument (Fluidigm Corporation, California, USA).
RNA level quantification was assessed by calculating 2−ΔΔCT(Schmittgen and Livak 2008).
In the previous study, we identified 2553 genes signifi-cantly upregulated or downregulated between the OC group and the control group (Serteyn and others 2010). For this study, we have chosen 34 genes following differ-ent criteria: a low P value (inferior to 0.1 per cdiffer-ent), fold induction superior to 5, quality of annotation (existence of a lot of predicted mRNA in the horse genome), and a mix of upregulated and downregulated genes member-ship of a known signalling pathway (Table 1). Four control genes: WARS (tryptophanyl-tRNA synthetase), RIGE (retinoic acid induced gene E protein), B2M (β-2 microglobulin) and TUBB2C (tubulin, β 2C), referred to as housekeeping genes, were used to normalise mRNA levels between different samples. These four control genes were defined in a previous transcriptomic study (Serteyn and others 2010).
Statistical analysis was performed according to Yuan and others (2008) using the data of control groups as references values (ΔΔCT) respectively for each AGE. Then, the significance analysis of microarrays (SAM) method was used to compare the levels of gene expres-sion as a marker of OC, taking into account the age effect between control samples and study samples. We used the corrected P value based on the false discovery rate (FDR) method (Tusher and others 2001). The results are expressed for each gene as a ratio between the expression levels in the OC-affected group versus the
healthy horses. Our statistical criterion for the SAM ana-lysis was the following: only the genes with a level of expression strictly below 0.7 or superior to 1.5 and satis-fying at least a FDR strictly lower than 5 per cent were considered as possible biomarkers.
RESULTS
The results of the SAM analysis were reported inTable 2
for each age group. We found several biomarkers satisfy-ing our biomarker selection criterion.
Relative expression of genes of horses less than 12 months of age showed significant induction of the genes MGAT4A (mannosyl-glycol-protein acetylglucosa-minyltransferase), PRKCG ( protein kinase C, gamma), MHCI (MHC class I,α chain), ApoB (apolipoprotein B), ApoB3G (similar to apolipoprotein B mRNA editing enzyme catalytic polypeptide-like 3G), B4GALT6
(β-1,4-galactosyltransferase 6), the three latter genes were above the golden threshold of two-fold change. Further, there was a significantly lower expression of the gene OAS3 (2050-oligoadenylate synthetase 3) with a two-fold change.
Horses of 18–24 months of age, showed a significantly higher expression of the genes TBC1D9 (TBC1 domain family, member 9 (with GRAM domain)), MGAT4A, IFIH1 (interferon-induced helicase C domain-containing protein 1), MHCIIa (similar to MHC class I, α chain) and MMP1 (interstitial collagenase precursor), withIFIH1 and MMP1 above the two-fold change for upregulated genes.
Horses of more than 30 months of age showed a sig-nificantly higher expression of the genes MGAT4A, HP (haptoglobin), SECTM1 (secreted and transmembrane protein 1 precursor ( protein K12)), MHCIIa, PYGL ( phosphorylase, glycogen, liver), CUL5 (cullin-5,
TABLE 1: List of the 33 genes selected on several criteria fromSerteyn et al. (2010): a low P value (inferior to 0.1 per cent), fold induction superior to 5, quality of annotation, a mix of upregulated and downregulated genes membership of a known signalling pathway
Gene symbol Name Transcript ID(Ensembl or Genbank)
ADAMTLS4 ADAMTS-like protein 4 precursor ENSECAT00000020422
ApoB Apolipoprotein B ENST00000233242
ApoB3G similar to ApoB mRNA editing enzyme catalytic polypeptide-like 3G XM_001916520
B4GALT6 β-1,4-galactosyltransferase 6 ENSECAT00000018745
BMP5 Bone morphogenetic protein 5 ENSECAG00000007138
CLK1 Dual specificity protein kinase ENSECAT00000016444
CRKL Crk-like protein ENSECAT00000018670
CSNK1E Casein kinase I isoform epsilon ENSECAT00000023450
CtBP1 C-terminal-binding protein 1 ENSECAT00000016987
CUL5 Cullin-5 (vasopressin-activated calcium-mobilising receptor) ENSECAT00000026414
DVL1 Segment polarity protein dishevelled homologue DVL-1 ENST00000378891
DVL3 Segment polarity protein dishevelled homologue DVL-3 ENSECAT00000009739
FOXL1 Forkhead box L1 ENST00000320241
FOXO1 Forkhead box O1 ENST00000379561
FZD1 Frizzled family receptor 1 ENSECAG00000001326
GRB2 Growth factor receptor-bound protein 2 ENSECAG00000006524
GSK3B Glycogen synthase kinase 3β ENSECAT00000026913
Hp Haptoglobin XM_001497810
IFIH1 Interferon induced with helicase C domain ENST00000263642
IKBKB Inhibitor of nuclear factorκ-B kinase subunit β ENSECAT00000005219
ISG15 Interferon-induced protein precursor ENSECAT00000001183
MGAT4A Mannosyl glycoproteinacetylglucosaminyltransferase ENSECAG00000015468
MHCI MHC class I heavy chain ENSECAT00000021999
MHCIIa Similar to MHC class II antigen DQα chain ENSECAT00000022398
MMP1 Interstitial collagenase precursor (Matrix metalloproteinase-1) ENSECAT00000025715
OAS3 20-50-oligoadenylate synthetase 3 ENST00000549918
PPP1CB Protein phosphatase 1, catalytic subunit,β isoform ENSECAG00000009359
PPR2A Protein phosphatase 2, regulatory subunit A,α isoform ENSECAT00000019754
PRKCG Protein kinase C,γ ENSECAT00000020980
PYGL Phosphorylase, glycogen, liver ENSECAT00000013037
RUSC2 Iporin (interacting protein of Rab1) (RUN and SH3 domain-containing protein 2) ENSECAT00000026463
SECTM1 Secreted and transmembrane protein 1 precursor ENSECAT00000006039
SMAD5 SMAD family member 5 ENSECAG00000000815
TBC1D9 TBC1 domain family member 9B ENSECAT00000018936
vasopressin-activated calcium mobilising receptor), GSK3B (glycogen synthase kinase 3 β) and MMP1. Again we found MMP1 above the golden two-fold change threshold. Two other genes are worth mention-ing: SECTM1 and HP. For the downregulated genes a significant lower expression of OAS3 and WASH1 (WAS protein family homologue 1) were found by the SAM analysis.
Based on our very low FDR rates we computed Fig 1
which combines in a Venn diagram the common markers between the groups. We found several common markers such as MGAT4A which is upregulated at all ages and could be seen as our‘supermarker’, OAS3 as a
common disease marker for groups of horses less than 12 months of age and horses of more than 30 months of age, and two common markers MHCIIa and MMP1 for horses of 18–24 months of age and horses of more than 30 months of age.
DISCUSSION
We previously demonstrated that leukocytes of affected horses showed differential expression of genes related to several metabolic pathways, for example, Wnt signalling, insulin signalling, TGF-β signalling and Ihh signalling (Serteyn and others 2010). Mature leukocytes have been shown to express a variety of mRNAs and they are able to respond to external stimuli by rapid and complex changes in gene expression (Bertrand and others 2004). Likewise, Liew and others (2006)considered peripheral blood leukocytes as a surrogate tissue to substitute for traditional tissue specimens that are not easily accessible. The suitability of leukocytes for gene profiling is related to their active metabolism and accessibility by simple venipuncture, which may allow a repeated time-series analysis of changes in gene expression in response to changing environmental or disease factors (Liew and others 2006). In horses, Kamm and others (2013) used a similar method to study the transcript profile of leuko-cytes from horses affected by osteoarthritis.
Histology studies (Laverty and Girard 2013) and cartilage-derived transcriptome studies have demon-strated timely changes in the initiation and the progres-sion of the cartilage leprogres-sions. The initial step in the pathogenesis is one or several of the following events: formation of a fragile cartilage, failure of chondrocyte differentiation, subchondral bone necrosis, and failure of blood supply to the growth cartilage (Ytrehus and others 2007, Olstad and others 2013). In the more chronic stages of the disease, secondary degenerative and regenerative processes overshadow the initial events (Bertone and others 2005). The timely fashion of the events is also reflected in the transcriptome changes of leukocytes of OC-affected horses compared with age-matched OC-free controls. However, the transcript level of the MGAT4A gene remains significantly higher in the OC-affected horses of all ages. This gene is implicated in the intracellular transport of glucose via the membrane localisation of GLUT2 (Johswich and others 2014). The MGAT4A transcript level is significantly higher in white blood cells of peripheral blood of human patients affected by type 2 diabetes (T2D) (Lopez-Orduña and others 2007). They suggest that high levels of glucose and triglycerides could induce the high MGAT4A tran-script levels, especially in subjects with a particular T2D genetic background. A similar explanation could be pro-posed for the OC-affected foals. In an animal model, transient hyperglycaemia causes persistent epigenetic changes and altered gene expression during subsequent normoglycemia. This mechanism implicates a mitochon-drial pathway with a high superoxide anion production
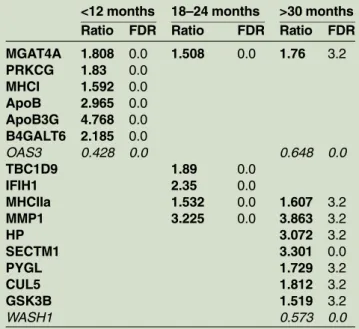
TABLE 2: SAM-plot results with the overexpressed an underexpressed genes
<12 months 18–24 months >30 months
Ratio FDR Ratio FDR Ratio FDR
MGAT4A 1.808 0.0 1.508 0.0 1.76 3.2 PRKCG 1.83 0.0 MHCI 1.592 0.0 ApoB 2.965 0.0 ApoB3G 4.768 0.0 B4GALT6 2.185 0.0 OAS3 0.428 0.0 0.648 0.0 TBC1D9 1.89 0.0 IFIH1 2.35 0.0 MHCIIa 1.532 0.0 1.607 3.2 MMP1 3.225 0.0 3.863 3.2 HP 3.072 3.2 SECTM1 3.301 0.0 PYGL 1.729 3.2 CUL5 1.812 3.2 GSK3B 1.519 3.2 WASH1 0.573 0.0
The Ratio (<0.7 and >1.5) and the FDR (<5 per cent) are reported with the overexpressed (bold) and underexpressed (italic) genes. The FDR is a corrected p value (Tusher et al. 2001)
SAM, significance analysis of microarrays
FIG 1: Venn diagram showing the number of common markers between the three age groups
(El-Osta and others 2008). Recently, abnormal mito-chondria and endoplasmic reticulum were observed in the deep zone of OC cartilage (Desjardin and others 2014). The mitochondrial dysfunction could be partially explained by the altered Wnt signalling pathway observed in the OC-affected horses because this pathway is known as a key regulator of mitochondrial function (Serteyn and others 2010,Yoon and others 2010).
Other genes identified as possible biomarkers in this study are related to the carbohydrate and lipid metabol-ism (APOB, TBC1D9, B4GALT6, PYGL, GSK3) or gene expression, cell growth, apoptosis and differentiation (APOB3G, PRKCG, CUL5, SECTM1, WASH1) or related to inflammatory and immune mechanisms (OAS3, MMP1, HP, IF1H1, MHCI, MHCIIa).
Their role in the pathogenesis of equine OC remains to be determined, but a high-energy diet is known to induce OC lesions in foals (Savage and others 1993,
Mirams and others 2009). These observations were illu-strated recently byVander Heyden and others (2013). It appears that mares fed with concentrates during gesta-tion are more likely to produce foals that are subse-quently affected by OC compared with other mares.
Even though the real-time PCR analysis of the 135 horses is conclusive, the potential markers should be subjected to individual analysis in order to validate their clinical potential. Limitations of this study include the fact that neither the affected joint nor other lesions of endochondral ossification such as subchondral cysts have been considered.
Even if the causal relationship between the differen-tially expressed genes and the development and progres-sion of the OC leprogres-sions needs to be determined, this study clearly demonstrates that OC-affected horses show particular changes in their leukocyte transcriptome and that these modifications change with age.
Author affiliations
1University of Liège, Liège, Belgium
2Equine Research and Development Center, Mont-le-Soie, Belgium 3Computational Biology Institute (IBC), France
4University of Montpellier2, Montpellier, France 5Acobiom, Montpellier, France
AcknowledgementsWe thank the Languedoc-Roussillon facilities (1) Montpellier GenomiX (MGX) and the Q-PCR facility, and (2 ) HPC@LR Center for high-performance computing and the‘Institut de Biologie
Computationnelle’ (IBC, Montpellier, France) for fruitful discussions. We also thank B. Deliege and P. Lejeune for their excellent technical assistance. Contributors Pascal Lejeune and Brigitte Deliege provided technical help for X-ray and blood samples.
Funding Ministère de l’agriculture, Wallonie.
Competing interests Two coauthors (RB and FN) are working in a private company and performing the statistical analysis.
Patient consent Obtained.
Provenance and peer review Not commissioned; externally peer reviewed. Data sharing statement All authors agree to share their original data. This paper used results published bySerteyn and others (2010).
Open Access This is an Open Access article distributed in accordance with the Creative Commons Attribution Non Commercial (CC BY-NC 4.0) license, which permits others to distribute, remix, adapt, build upon this work non-commercially, and license their derivative works on different terms, provided the original work is properly cited and the use is non-commercial. See: http:// creativecommons.org/licenses/by-nc/4.0/
REFERENCES
Bertone A. L., Bramlage L. R., McIlwraith C. W., Malemud C. J. (2005) Comparison of proteoglycan and collagen in articular cartilage of horses with naturally developing osteochondrosis and healing osteochondral fragments of experimentally induced fractures.American Journal of Veterinary Research66, 1881–1890
Bertrand G., Coste J., Segarra C., Schved J. F., Commes T., Marti J. (2004) Use of serial analysis of gene expression (SAGE) technology reveals new granulocytic markers.Journal of Immunological Methods 292, 43–58
Denoix J. M., Jacquet S., Lepeule J., Crevier-Denoix N., Valette J. P., Robert C. (2013) Radiographic findings of juvenile osteochondral conditions detected in 392 foals using a field radiographic protocol. Veterinary Journal197, 44–51
Desjardin C., Chat S., Gilles M., Legendre R., Riviere J., Mata X., Balliau T., Esquerré D., Cribiu E. P., Betch J. M., Schibler L. (2014) Involvement of mitochondrial dysfunction and ER-stress in the physiopathology of equine osteochondritis dissecans (OCD).Experimental and Molecular Pathology96(3), 328–338
El-Osta A., Brasacchio D., Yao D., Pocai A., Jones P., Roeder R., Cooper M., Brownlee M. (2008) Transient high glucose causes persistent epigenetic changes and altered gene expression during subsequent normoglycemia.The Journal of Experimental Medicine205, 2409–2417 Jacket S., Robert C., Valette J. P., Denoix J. M. (2013) Evolution of
radiological findings detected in the limbs of 321 young horses between the ages of 6 and 18 months.Veterinary Journal197, 58–64
Jeffcott L. B. (1991) Osteochondrosis in the horse—searching for the key to pathogenesis.Equine Veterinary Journal23, 331–338
Johswich A., Longuet C., Pawling J., Abdel Rahman A., Ryczko M., Drucker D. J., Dennis J. W. (2014) N-glycan remodeling on glucagon receptor is an effector of nutrient-sensing by the hexosamine biosynthesis pathway.The Journal of Biological Chemistry289, 15927–41
Kamm J. L., Frisbie D. D., McIlwraith C. W., Orr K. E. (2013) Gene biomarkers in peripheral white blood cells of horses with experimentally induced osteoarthritis.American Journal of Veterinary Research74(1), 115–21
Laverty S., Girard C. (2013) Pathogenesis of epiphyseal osteochondrosis. Veterinary Journal197, 3–12
Lecocq M., Girard C. A., Fogarty U., Beauchamp G., Richard H., Laverty S. (2008) Cartilage matrix changes in the developing epiphysis: early events on the pathway to equine osteochondrosis?Equine Veterinary Journal40, 442–454
Liew C., Ma J., Tang H., Zheng R., Dempsey A. (2006) The peripheral blood transcriptome dynamically reflects system wide biology: a potential diagnostic tool.The Journal of Laboratory and Clinical Medicine147, 126–132
Lopez-Orduña E., Cruz M., García-Mena J. (2007) The transcription of MGAT4A glycosyl transferase is increased in white cells of peripheral blood of Type 2 Diabetes patients.BMC Genetics8, 73–80 McIlwraith C. W. (1993) Inferences from referred clinical cases of
osteochondrosis dissecans. Equine Veterinary Journal. Supplement 16, 27–30
Mirams M., Tatarczuch L., Ahmed Y. A., Pagel C. N., Jeffcott L. B., Davies H. M., Mackie E. J. (2009) Altered gene expression in early
osteochondrosis lesions.Journal of Orthopaedic Research27, 452–457 Olstad K., Hendrickson E. H. S., Carlson C. S., Ekman S., Dolvik N. I.
(2013) Transection of vessels in epiphyseal cartilage canals leads to osteochondrosis and osteochondrosis dissecans in the femoro–patellar joint of foals; a potential model of osteochondritis dissecans.
Osteoarthritis and Cartilage21, 730–738
Rejnö S., Strömberg B. (1978) Osteochondrosis in the horse. II. Pathology. Acta Radiologica. Supplementum 358, 153–178. Savage C. J., McCarthy R. N., Jeffcott L. B. (1993) Effects of dietary
energy and protein on induction of dyschondroplasia in foals.Equine Veterinary Journal25, 74–79
Schmittgen T. D., Livak K. J. (2008) Analyzing real-time PCR data by the comparative C(T) method.Nature Protocols3, 1101–1108
Semevolos S. A., Brower-Toland B. D., Bent S. J., Nixon A. J. (2002) Parathyroid hormone-related peptide and Indian hedgehog expression
patterns in naturally acquired equine osteochondrosis.Journal of Orthopaedic Research20, 1290–1297
Semevolos S. A., Nixon A. J., Brower-Toland B. D. (2001) Changes in molecular expression of aggrecan and collagen types I, II, and X, insulin-like growth factor-I, and transforming growth factor-beta1 in articular cartilage obtained from horses with naturally acquired osteochondrosis. American Journal of Veterinary Research62, 1088–1094
Semevolos S. A., Strassheim M. L., Haupt J. L., Nixon A. J. (2005) Expression patterns of hedgehog signaling peptides in naturally acquired equine osteochondrosis.Journal of Orthopaedic Research23,
1152–1159
Serteyn D., Piquemal D., Vander Heyden L., Lejeune J. P., Verwilghen D., Sandersen C. (2010) Gene expression profiling from leukocytes of horses affected by osteochondrosis. Journal of Orthopaedic Research 28, 965–970
Tusher V. G., Tibshirani R., Chu G. (2001) Significance analysis of microarrays applied to the ionizing radiation response.Proceedings of the National Academy of Sciences of the United States of America98 (9), 5116–21
Vander Heyden L., Lejeune J. P., Caudron I., Detilleux J., Sandersen C., Chavatte P., Paris J., Deliège B., Serteyn D. (2013) Association of breeding conditions with prevalence of osteochondrosis in foals. The Veterinary Record 19, 172(3), 68
Verwilghen D. R., Janssens S., Busoni V., Pille F., Johnston C., Serteyn D. (2013) Do developmental orthopaedic disorders influence future jumping performances in Warmblood stallions?Equine Veterinary Journal45, 578–581
Yoon J. C., Ng A., Kim B. H., Bianco A., Xavier R. J., Elledge S. J. (2010) Wnt signaling regulates mitochondrial physiology and insulin sensitivity. Genes & Development24(14), 1507–18
Ytrehus B., Carlson C. S., Ekman S. (2007) Etiology and pathogenesis of osteochondrosis.Veterinary Pathology44, 429–448
Yuan J. S., Wang D., Stewart C. N. Jr. (2008) Statistical methods for efficiency adjusted real-time PCR quantification.Biotechnology Journal 3, 112–123
Zabek T., Golonka P., Fornal A., Semik E. (2002) IHH gene polymorphism among three horse breeds and its application for association test in horses with osteochondrosis.Hereditas150, 38–43
leukocytes
osteochondrosis-related genes in equine
Age-dependent expression of
R. Bruno, C. Sandersen and D. Serteyn
L. Mendoza, D. Piquemal, J. P. Lejeune, L. Vander Heyden, F. Noguier,
doi: 10.1136/vetreco-2014-000058
2015 2:Vet Rec Open
http://vetrecordopen.bmj.com/content/2/1/e000058 Updated information and services can be found at:
These include:
References
#BIBL
http://vetrecordopen.bmj.com/content/2/1/e000058
This article cites 30 articles, 5 of which you can access for free at:
Open Access
http://creativecommons.org/licenses/by-nc/4.0/
non-commercial. See:
provided the original work is properly cited and the use is
non-commercially, and license their derivative works on different terms, permits others to distribute, remix, adapt, build upon this work
Commons Attribution Non Commercial (CC BY-NC 4.0) license, which This is an Open Access article distributed in accordance with the Creative
service
Email alerting
box at the top right corner of the online article.
Receive free email alerts when new articles cite this article. Sign up in the
Collections
Topic
Articles on similar topics can be found in the following collections (21)Open access
Notes
http://group.bmj.com/group/rights-licensing/permissions To request permissions go to:
http://journals.bmj.com/cgi/reprintform To order reprints go to:
http://group.bmj.com/subscribe/ To subscribe to BMJ go to: