Twelfth International Congress on Sound and Vibration
VALIDATION OF A NUME RICAL DIFFUSION EQUATION
BASED MODELING OF THE REVERBERATED SOUND
FIELD IN LONG ROOM
Foy Cédric, Billon Alexis, Valeau Vincent, Sakout Anas LEPTAB, Université de La Rochelle, France
[email protected] Picaut Judicael LCPC, Nantes, France
Reigner Gilles
CEBTP, Saint Remy Les Chevreuses, France
Abstract
Many applications as corridors, railways tunnels or tube stations present a long room geometry. A fast and reliable modelling of such sound fields could be helpful for designers. In fact, the classical statistical theory based on the assumptions of diffuse sound field is not applicable in such cases because the reverberant sound energy along the room is not uniform. In this study, several models assuming diffuse reflections of sound by walls are used for predicting the reverberant sound field in long rooms. Two models based on a diffusion equation for the energy density (one numerical and one analytical based on an image approach for describing the sound reflection at the corridor extremity) are compared with a radiosity model, and with a ray tracing software. Predictions are compared in terms of sound attenuation and reverberation time with measured data. The long rooms considered in this study were two rectangular corridors of lengths 20.3m and 47.3m.
All models overestimate the attenuation, reaching 6dB for the numerical diffusion based model. When a part of specular reflection (30%) is added in the ray tracing model, the predicted sound attenuation matches with the measured one : even in case of rough surfaces, specular reflections cannot be totally excluded.
For reverberation time, the agreement between predictions and experiments is good with fewer than 15% of discrepanc y. The best predictions of the reverberation time were given by the diffusion models, with discrepancy less than 2% for the
numerical model. So, it could be concluded that it is difficult to find a prediction method which is consistent both in terms of steady state and sound decay for the acoustics of long halls.
1 INTRODUCTION
Many constructions like corridors [2, 3, 4, 5], underground stations [6, 7], or urban streets [8, 9, 10] have disproportionate dimensions. When the ratio between the length and the width (or height) is superior to six [11], these geometries imply substantial reverberation time variations and sound attenuation along the length. As a consequence, the statistical acoustics theory, based on the diffuse field hypothesis assuming that the reverberated sound energy is even at any position in the room, is not valid in this configuration. Moreover, the reverberation time increases for a larger source-receiver distance. Conversely, highly reflective end walls can decrease the reverberation time [12].
The image source model, based on geometrical acoustics, allows one to calculate the sound intensity using a network of virtual images sources. Theoretical derivations of sound attenuation [2, 13] with this model have been experimentally validated for long rooms. On the other hand, the predicted sound decays [11] are usually inferior to the ones measured [4], this trend increasing with room disproportional. In this model, only specular reflections are modelled. Then, Kuttruff [14] suggested that significant surface scattering must occur. In this purpose, this paper investigates the ability of several models assuming pure diffuse reflections (i.e. described by a Lambert’s law), to carry out accurate predictions in long rooms. Two models based on a diffusion equation, together with ray tracing and radiosity models are firstly presented, and then compared to experimental data for two corridors in terms of sound attenuation and reverberation times.
1.1 Ray Tracing
The ray tracing method allows the modelling of sound scattering which can occur when sound waves are reflected by rough surfaces. In this model, the sound is radiated from a source as a set of rays carrying the same amount of energy and travelling at the sound speed. On the room’s boundary, these rays are reflected and exchange energy proportional to the wall absorption.
If only specular reflections are considered, a good agreement with measurements can be achieved for hard-walled corridors [15]. However, sound levels for corridors containing more highly absorbent materials are overestimated as the source/receiver distance increases. Thus, the importance of diffusely reflecting boundaries were pointed out experimentally [16]: the introduction of diffusers could significantly raise sound attenuation. This effect has been explained theoretically by the fact that the sound rays have more reflection with diffusely reflecting boundaries than with specular reflection [14]. A Lambert’s law can be used to model diffuse
reflection [14], implying that equal sound intensities are reflected in all directions and representing the angular distribution of the scattered intensity’s probability. Numerically, this law is simulated by a Monte Carlo simulation [17]: every surface reflects a proportion d of incident energy diffusely and the remaining (1-d) specularly. Nevertheless, this method requires a high number of rays and consequently large computational times to achieve a good accuracy.
1.2 Radiosity
Radiosity method is used in heat transfer to calculate radiative exchanges between surfaces. To take into account the travel time of the sound waves, the conservation of energy is expressed with a time-dependent formulation of the energy balance, includ ing a propagation delay. An integral equation is obtained which can only be solved numerically, by divided the room surfaces into element ary surfaces [14]. Energy density w at every position within the room can be then evaluated with:
) ( ) 1 ( ) cos( ) ( ) ( 2 j j rj j rj j rj dr w t t d S t w t w = +
∑
−α − π ϕ (1)wherew is the direct energy density, dr ϕrj the angle from the normal to the elementary
surfaceSj, drj the distance from Sj to the receiver travelled during the time trj, αj and wj are respectively the absorption coefficient and the energy density of these elementary surface. To meet suitable error tolerances, walls must be divided into very fine element s (typically much less than the acoustic wavelength). As a result, the radiosity method is expensive in computational time for large environments and at high frequencies.
1.3 Diffusion Model
This recent model has been successfully applied to model the reverberant sound field in long room [1], and numerical implementations of this model have also been applied to single [18], and coupled rooms [19; 20; 21]. In this model, the energy density w in the room, outside the direct field, is described by a diffusion equation in which a diffusion coefficient D is function of the mean free path of the room λ :
4 , 3 3 c Vc D S λ = = (2)
V and S being the volume and the surface of the room. The absorption of acoustic energy at boundaries is taken into account by an exchange coefficient h=cα/ 4, where α is the wall absorption coefficient. The energy flow J through this surface verifies the following relation where ∂ ∂/ n denotes the normal derivative to the wall.
J hw n w D = ∂ ∂ − = (3) 1.4 Hybrid Model
The exchange coefficient given in the previous section was established by neglecting the sound reflection at the room extremities. This assumption can be valid for very long corridors and for source and receiver not too close from the extremities. There, the expression of the exchange coefficient given in Eq. 3 is questionable for taking into account reflections by these extremities [5]. To avoid this approximation, a hybrid model using both image source and diffusion models is proposed. This model uses the analytical derivation (based on the solution of a one-dimensional diffusion equation [1]) for the energy density along an infinite long room:
) 4 4 ² exp( 2 ) , ( 0 V t Sc Dt x Dt w t x w αlat π − − = (4)
where α is the absorption coefficient of lateral sides and lat w is the density supplied 0 by the impulsive source. To take into account the reflection at the extremities of a finite long room, image sources are created along a virtual infinite long room. Each image source diffuses sound energy according to the infinite room expression, with suitable absorption factor and time delay with respect to the actual source. The solution along the finite room is then recovered by adding all the image sources contributions. At the receiver, the sound decay can then be written :
)) ( 4 ) ( 4 )² ( exp( ) ( 4 ) 1 ( ) 1 ( ) , ( 0 i lat i i i k r j i l t t Sc V t t D x x t t D w t x w − − − − − − − − =
∑
α π α α (5)whereα , are respectively the absorption coefficients of the left and right sides of l αr
the corridor, and t is the flight time of image i to the receiver. The sound level is i
then obtained by integrating relation (5) over the time.
2 EXPERIMENTS AND COMPUTING PARAMETERS
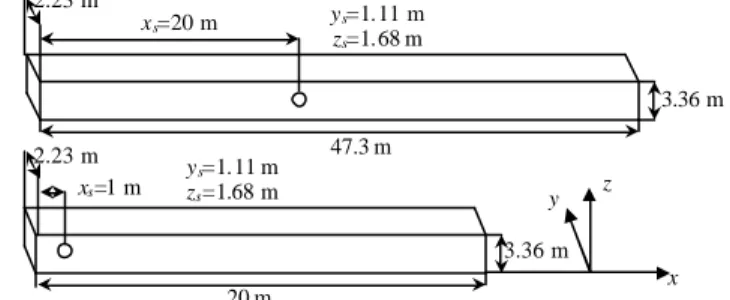
The experimental data used in this study are taken from reference [1]. Measurements of the reverberation time and sound attenuation were conducted in two rectangular long rooms with a (2.23×3.36) m2 cross section. The first one was 20.3m long and the source was located at xs=1 m. The second one was 47.3m long and the sound
source was located at xs=20 m (Figure 1).
Their side walls and ceilings were made of natural protrusions introducing diffusion. Their measured diffuse sound absorption coefficients were respectively 0.078 and 0.065 for the short and long corridors. Their walls were covered of natural
protrusions so that the reflection could be assumed to be sufficiently diffuse. The impulse response was obtained using pistol. The reverberation was evaluated by using Shroeder’s integration method. Sound attenuation as a function of the distance was obtained by integrating over the time the impulse response. The shortcoming of this method is that it is difficult to define an equivalent source power from an impulse response. As a consequence comparison with steady state simulations was not possible in terms of absolute levels. Only the sound attenuation along the hall (in terms of slope) was compared to the measured sound attenuation.
47.3 m 3.36 m 2.23 m xs=20 m ys=1.11 m zs=1.68 m 20 m 3.36 m 2.23 m xs=1 m ys=1.11 m zs=1.68 m y z x
Figure 1 – Sketches of the long corridor (top) and the short corridor (bottom)
The CATT-Acoustic ray tracing software has been used. Steady state sound level was obtained using 5x10⁵ rays and, in order to obtain a more accurate evaluation of the reverberation times, the randomized tail-corrected cone tracing was not used [22]. Time computing was about 4h. For the radiosity model, the boundaries have been divided into 2150 square elements. The time computing required was about 2h for the time varying state. The diffusion equation was solved numerically using FEMLAB [19], a finite element solver using around 2500 elements. Both stationary and time-dependant diffusion equations were solved; computing times were about 20s and 4min respectively. Last, the hybrid model required four virtual sources and 4730 linear elements. Less than 1 min was necessary to get a result, even for the reverberation calculation.
3.RESULTS
Figure 2 depicts the sound attenuation along the room for measurements, ray tracing (CATT) with the part of diffuse reflection set to 100% (d=1) and 70% (d=0.7), diffusion models and radiosity model. The sound attenuation is depicted from a reference point: x=5m and x=6m respectively for the short (left figure) and long (right figure) corridor, where the sound level is set to the same value for all models
The results of Figure 2 show that all models based on diffuse reflections are in good agreement, apart from the diffusion model which tends to retrieve a higher attenuation (difference of 2 and 4 dB at the corridor end for the short and long corridor). The hybrid model, although it is also based on diffusion theory, predicts a lower attenuation tha n the diffusion model. The reason is probably that, as expected, the backscattering due to the end of the corridor is better accounted for by the hybrid
model. Generally, all models based on diffuse reflections overestimate the sound attenuation in the corridor. Indeed, it has been proved both theoretically and numerically that with diffusely reflecting boundaries, the sound attenuation is greater than with specular reflections [11, 14]. This is effectively verified by CATT’s simulations with a 30% part of specular reflections. The simulated attenuation then matches quite satisfactorily with the measured one.
Figure 2 – Sound attenuation along the short corridor (left) and the long corridor (right). ‘o’ Measurements, ‘thick line’ Diffusion Model, ‘dotted line’ Hybrid Model, ‘+’CATT(d=1), ‘
solid line’ CATT(d=0.7), ‘?’ Radiosity.
Figure 3 plots the simulated and measured reverberation time at several locations along the long corridor.
Figure 3- Reverberation time along the length of the long corridor. ‘o’Measurements, ‘thick line’, Diffusion Model, ‘dotted line’ Hybrid Model ‘+’CATT(d=1), solid line’ CATT(d=0.7),
‘?’ Radiosity.
Comparisons between measured and predicted reverberations times show that the models results are in accordance with the usual behavior of sound in long halls, i.e. the reverberation time is not spatially uniform and increases with the
source-receiver distance. The diffusion-based model and hybrid model make the best predictions of reverberation time (error smaller that 2% and 5% respectively. It is noticeable that the diffusion model, which gives the highest overestimation of the sound attenuation, gives the best estimation in terms of reverberation time. Find a prediction method which is consistent both in terms of steady state and sound decay predictions for long halls is still a goal to achieve.
Another interesting feature is that the reverberation time is slightly lower for the ray racing method with 70% of diffuse reflections tha n with 100%. Indeed studies usually show that specular reflections in rooms induce higher reverberation times than diffuse reflections [16]. However, Kang [11] reported simulations with reverberation times showing an opposite trend for some long rooms, which seems to be in agreement with the present results.
CONCLUSION
In this study, several models assuming diffuse reflections of sound by walls are used for predicting the reverberant sound field in long rooms. Two models based on a diffusion equation for the energy density (one numerical and one analytical based on an image approach for describing the sound reflection at the corridor extremity) are compared with a radiosity model, and with a ray tracing software. Predictions are compared in terms of sound attenuation and reverberation time with measured data. The long rooms considered in this study were two rectangular corridors of lengths 20.3m and 47.3m.
All models overestimate the attenuation, reaching 6dB for the numerical diffusion based model. When a part of specular reflection (30%) is added in the ray tracing model, the predicted sound attenuation matches with the measured one: even in case of rough surfaces, specular reflections cannot be totally excluded.
For reverberation time, the agreement between predictions and experiments is good with fewer than 15% of discrepanc y. The best predictions of the reverberation time were given by the diffusion models, with discrepancy less than 2% for the numerical model. So, it could be concluded that it is difficult to find a prediction method which is consistent both in terms of steady state and sound decay for the acoustics of long halls. Further works will be conducted in order to compare sound attenuations in terms of absolute levels.
REFERENCES
[1] J. Picaut, Sound field in long rooms with diffusely reflecting boundaries, App. Acoust., 56, 217-240 (1999).
[2] J. Kang, Sound Attenuation in Long Enclosures, Build. and Env, 31(3), 245-253 (1996).
[3] J. Kang, A Method for Predicting Acoustic Indices in Long Enclosures, App. Acoust., 51(2), 169-180 (1997).
[4] M. Hodgson, On the Prediction of Sound Fields in Large Empty Rooms, J. Acoust. Soc. of Am., 84, 253-261 (1988).
[5] J. Picaut, J.D. Polack, L. Simon, A Mathematical Model of Diffuse Sound Field Based on a Diffusion Equation, Acustica, 83(4), 614-621 (1997).
[6] J. Kang, Acoustics of Long Underground Spaces, Tunnel. and Undergr. Space Techn., 12(1), 15-21 (1997).
[7] J. Kang, Modelling of Train Noise in Underground Stations, J. Sound and Vib., 195(2), 241-255 (1996).
[8] J. Kang, Numerical Modelling of the Sound Fields in Urban Streets with Diffusely Reflecting Boundaries, J. Sound and Vib., 258(5), 793-813 (2002). [9] H. G. Davies, Multiple Reflection Diffuse Scattering Model for Noise
Propagation in Streets, J. Acoust. Soc. of Am., 64(2), 517-521 (1978).
[10] J. Picaut, Numerical Modeling of Urban Sound Fields by a Diffusion Process, App. Acoust., 63, 965-991 (2002).
[11] J. Kang, Acoustics of long spaces Theory and Design Practice, (Thomas Telford Publishing, ville année).
[12] J. Kang, Reverberation in Rectangular long enclosures with geometrically reflecting boundaries, Acustica, 82, 509-516 (1996).
[13] T. Yamamoto, On the distribution of sound in a corridor, J. Acoust. Soc. Jap., 17, 286-292 (1961).
[14] H. Kuttruff, Rooms Acoustics, (Elsevier Science, ville 1991).
[15] T. L. Redmore, A Theoretical Analysis and Experimental Study of the Behavior of Sound in Corridor, App. Acoust., 15, 161-170 (1982).
[16] M. Hodgson, Evidence of diffuse surface reflections in rooms, J. Acoust. Soc. of Am., 89, 765-771 (1991).
[17] J. C. Allred, A. Newhouse, Applications of the Monte Carlo Method to Architectural Acoustics, J. Acoust. Soc. of Am., 30, 903-904 (1958).
[18] V. Valeau, A. Sakout, F. Li, Solving the diffusion equation with a finite element solver: Calculation of Diffuse Sound Field in Rooms Acoustics, 144th Meet. Acoust. Soc.Am., Cancun, Mexico (2002).
[19] A. Billon, V. Valeau, A. Sakout, J. Picaut, Reverberated sound field modeling in
coupled rooms using a diffusion equation, 148th Meet. Acoust. Soc.Am., San Diego,
United States (2004).
[20] A. Billon, V. Valeau, A. Sakout, J. Picaut, Experimental validation of a diffusion equation-based modeling of the sound field in coupled rooms, 149th Meet. Acoust. Soc.Am.,, Vancouver, Canada (2005).
[21] V. Valeau, J. Picaut, A. Sakout, A. Billon, Simulation of the acoustics of coupled rooms by numerical resolution of a diffusion equation, 18th Int. Congr. on Acoust., Kyoto, Japan (2004).
[22] B.I. Dalenbäck, CATT-Acoustic v8 User’s Manual, (Spectra, Gothenburg, 2002).