INSPIRATION bulletin
IB 6
(September 2019)CL
:
AIRE
1. IntroductionElevated concentrations of nitrogen (N) in aquifers is one of the major problems in agricultural areas because of the intensive application of mineral fertilisers and manure to increase soil fertility. In such areas, the identification of N sources and, consequently, N pathways is challenging due to the diffuse nature of pollution and the diversity of N sources. However, the study of the stable isotopic compositions of nitrate (NO3-) and boron (B) in groundwater is a
useful approach for the analysis of pollution sources and interpreting N production and consumption processes (Lasagna and De Luca, 2019; Sacchi et al., 2017).
The present bulletin will inform the reader about the following aspects: 1) the relative contribution of different N sources to groundwater pollution, and 2) the magnitude of N transformation processes. To this end, the stable isotope mixing model SIAR (Stable Isotope Analysis in R) (Parnell, 2008) is applied to the results of NO3
-and B isotopic compositions in groundwater samples collected during a regional sampling campaign of a chalk aquifer located in Eastern Belgium (Nikolenko et al., 2019).
2. Study Site
The study area corresponds to the unconfined part of the Hesbaye chalk aquifer in the Geer basin, Eastern Belgium. The study area is predominantly characterised by agricultural land use (nearly 65%). Agricultural activities represent the largest source of nitrate input into groundwater, followed by domestic wastewater effluents.
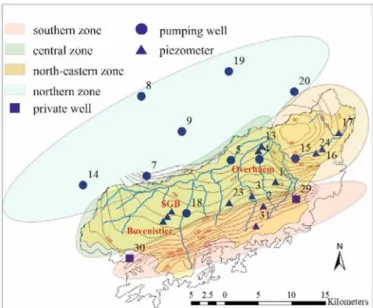
Based on the results of previous investigations (Nikolenko et al., 2019) the study area can be divided into three zones characterised by different hydrochemistry and urbanisation levels (Figure 1). The southern zone corresponds to the unconfined part of the aquifer and the most urbanised land use. The central zone corresponds also to the unconfined part of the aquifer but with a land use dominated by agricultural activities. The north-eastern zone corresponds to the groundwater recharge to the Geer River and predominantly agricultural land use (though sampling wells were located close to the urban areas).
3. Analysing the Isotopic Data with the SIAR Model
The SIAR mixing model is based on a Bayesian approach which allows uncertainty to be considered in all parameters and uses the Dirichlet distribution for describing prior information. The Dirichlet distribution requires that the total sum of each source input is unity. As input information, the SIAR model requires specifying the mean and standard deviation for each source. This information directs the model simulations according to the user’s expert knowledge. The model can be expressed for a set of N mixture measurements on J isotopes with K sources as follows (Jackson et al., 2009;):
where Xij is the observed isotope value j of the mixture i, in which
i=1,…, N; j=1,…, J; Sjk is the source value k on isotope j (k=1,…,
Copyright © CL:AIRE.
CL:AIRE’s INSPIRATION bulletins describe practical aspects of research which have direct application to the
management of contaminated soil or groundwater in an agricultural context. This bulletin describes an isotopic
approach to determine the contribution of nitrate sources in a chalk aquifer in Belgium.
Analysing N sources and transformation processes in
groundwater under agricultural areas (chalk aquifer,
Belgium)
This bulletin was prepared by Olha Nikolenko, Urban and Environmental Engineering Research Unit, University of Liège, Belgium with assistance from Alberto V. Borges, Philippe Orban and Serge Brouyère, all from University of Liège. For further information please email: o.nikolenko@ulg.ac.be
Figure 1: Map of the study area in the Geer basin showing river network, isopieses and sampling points (wells and piezometers). Colours indicate different zones used to aggregate data.
INSPIRATION bulletin
IB 6 page 2
K) that is assumed normally distributed with a mean µ and standard deviation 𝜔; pk is the proportion of source k which is to be estimated
by the model; cjk is a fractionation factor for isotope j on source k
that is normally distributed with mean 𝜆 and standard deviation 𝜏; and εjk is the residual error representing additional unquantified
variations between individual normally distributed with mean = 0 and standard deviation σ.
The SIAR model was applied to estimate the proportions of N sources contributing to groundwater pollution in the southern, central and north-eastern zones of the studied aquifer. Results of former studies have shown that, in groundwater, N comes from NH4+ fertilisers or
from manure and sewage which may be transformed by nitrification in the unsaturated zone or the upper part of the aquifer and denitrification in the deeper part of the aquifer. Considering the different possible combinations of N species and processes, the developed model considers five end-members of N: 1) NH4+ from
inorganic fertilisers; 2) NH4+ from manure; 3) NO3- from sewage
effluent; 4) NO3- produced from inorganic fertiliser NH4+ (nitrification)
and further affected by denitrification, 5) NO3- originated from
manure and further affected by denitrification. The last two “sources” were introduced to understand the relative intensity of denitrification processes in different zones.
The model input consists of the isotopic signatures of δ15N-NO 3-,
δ18O-NO
3- and δ11B of groundwater samples. The isotopic signatures
of δ15N-NO
3 and δ18O-NO3 are suitable for distinguishing inorganic
fertilisers from sewage and manure as a source of NO3- in
groundwater. The isotopic signature of δ11B helps to differentiate
between sewage and manure pollution sources. Data about the mean and standard deviation values for δ15N-NO
3-,δ18O-NO3- and
δ11B representative of the five selected end-members were obtained
from the literature [1) Bateman & Kelly., 2007; Li et al., 2007; Curt et al., 2004; Choi et al., 2003; Kendall et al., 1998; Girard et al., 1997; Wassenaar et al., 1995; Heaton 1986; 2) Nikolenko et al., 2018; Rapisarda et al., 2010; Bateman & Kelly, 2007; Choi et al., 2003; Curt et al., 2004; Fogg et al., 1998; Girard et al., 1997; 3) Divers et al., 2014; Di Lorenzo et al., 2012; Xue et al., 2009; 4) Nikolenko et al., 2018; Bateman & Kelly., 2007; Xue et al., 2009 and 5) Nikolenko et al., 2018; Xu et al., 2016; Michener & Lajtha, 2007]. The average theoretical δ18O-NO3- nitrification values were defined
from the following equation (Aelion et al., 2009):
with δ18O-H
2O isotopic signatures taken from a former study
(Nikolenko et al., 2019). The fractionation factors and their standard deviations were included in the input information to account for transformations of the first and second N sources due to nitrification and the fourth and fifth sources due to denitrification. (Xu et al., 2016; Li et al., 2014; Otero et al., 2009; Kendall, 1998).
4. Results and Discussion
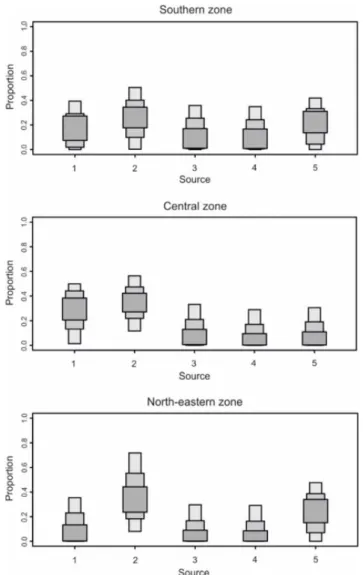
Figure 2 indicates NH4+ from manure as the dominant source of N
pollution in the north-eastern and southern zones, accounting for 23 to 42% and from 18 to 37% contribution, respectively. In the central zone, the contributions of NH4+ from fertilisers and NH4+ from
manure are similar – from 21 to 39%, and from 25 to 41%,
respectively. Household sewage appears to contribute the most to N input into groundwater in the southern zone (3-17%), compared with the other zones. In the central zone, denitrification has a limited influence on the isotopic signature of the δ15N-NO
3- pool (3-17%
contribution for sources 4 and 5) compared to the other zones. In the north-eastern zone, the total NO3- pool seems strongly affected by
denitrification, as the model estimates that nearly 40-50% of it appears as NO3- originating from NH4+ in fertilisers and manure,
further affected by denitrification.
It can be concluded that the distribution of various N sources is determined by the peculiarities of land use patterns. In particular, more urbanised areas (the southern and north-eastern zones) are characterized with a relatively higher N input from manure and sewage to groundwater, while predominantly agricultural areas show higher proportions of N input coming from inorganic fertilisers. It seems that the hydrogeochemical conditions in the central zone of the study area stimulate the predominance of nitrification, while denitrification occurs to a similar extent as nitrification in the north-eastern and southern zones.
Figure 2: Boxplots of mixing model proportions for each zone, categorised by source. The results shown are the 25%, 75% and 95% Bayesian credible intervals for the probability distribution calculated for each source.
INSPIRATION bulletin
IB 6 page 3
5. Conclusions
The results of NO3- and B isotope analyses showed that groundwater
conditions in the studied region is affected the most by manure as the dominant source of N pollution. The contribution of mineral fertilisers rises in the zones of intensive agricultural activities. At the same time, sewage seems to be the least important source influencing the groundwater quality; its relative contribution tends to increase in more urbanised areas. To a different extent, both nitrification and denitrification processes affect N dynamics in the subsurface. Their intensity likely depends on the concentration of dissolved oxygen, availability of substrate, residence time of groundwater etc. However, it should be noticed that obtaining the mean and standard deviation values of isotopic composition of N sources from the literature may introduce some uncertainty and affect the accuracy of model outputs. The application of such models should preferably be supported with information about the isotopic composition of sources in the area of study.
Acknowledgments
This research has received funding from the European Union’s Horizon 2020 research and innovation programme under the Marie Skłodowska-Curie grant agreement No 675120 for the project entitled “Managing soil and groundwater impacts from agriculture for sustainable intensification – INSPIRATION”. A.V.B. is a senior research associate at the Fonds National de la Recherche Scientifique.
References
Bateman, A. S., & Kelly, S. D. 2007. Fertilizer N isotope
signatures. Isotopes in environmental and health studies. 43(3), 237-247.
Curt, M. D., Aguado, P., Sánchez, G., Bigeriego, M., & Fernández, J.
2004. N isotope ratios of synthetic and organic sources of nitrate water contamination in Spain. Water, air, and soil pollution. 151(1-4), 135-142.
Di Lorenzo, T., Brilli, M., Del Tosto, D., Galassi, D. M., & Petitta, M.
2012. Nitrate source and fate at the catchment scale of the Vibrata River and aquifer (central Italy): an analysis by integrating component approaches and N isotopes. Environmental Earth Sciences. 67(8), 2383-2398.
Divers, M. T., Elliott, E. M., & Bain, D. J. 2014. Quantification of nitrate
sources to an urban stream using dual nitrate isotopes. Environmental science & technology. 48(18), 10580-10587.
Fogg, G. E., Rolston, D. E., Decker, D. L., Louie, D. T., & Grismer, M. E.
1998. Spatial variation in N isotope values beneath nitrate contamination sources. Groundwater. 36(3), 418-426.
Girard, P., & Hillaire-Marcel, C. 1997. Determining the source of nitrate
pollution in the Niger discontinuous aquifers using the natural 15N14N ratios. Journal of Hydrology. 199(3-4), 239-251.
Heaton, T. H. 1986. Isotopic studies of N pollution in the hydrosphere
and atmosphere: a review. Chemical Geology: Isotope Geoscience Section. 59, 87-102.
Hübner, H. 1986. Isotope effects of N in the soil and biosphere In
Handbook of Environmental Isotope Geochemistry: The Terrestrial Environment; Fritz, P., Fontes, JC, Eds.
Kendall, C. 1998. Tracing N sources and cycling in catchments. In
“Isotope Tracers in Catchment Hydrology”, Kendall y McDonnell (eds.) 521-576.
Lasagna, M., & De Luca, D. A. 2019. Evaluation of sources and fate of
nitrates in the western Po Plain groundwater (Italy) using N and boron isotopes. Environmental Science and Pollution Research. 26(3), 2089-2104.
Li, Y., Liu, Y., Wang, Y., Niu, L., Xu, X., & Tian, Y. 2014. Interactive
effects of soil temperature and moisture on soil N mineralization in a Stipa krylovii grassland in Inner Mongolia, China. Journal of Arid Land. 6 (5), 571-580.
Michener, R. & Lajtha, K. 2007. Tracing anthropogenic inputs of N to
ecosystems. In Kendall, C., Elliott, E., M. & Wankel, S., D. (Eds), Stable Isotopes in Ecology and Environmental Science (2nd ed.) (pp. 375-449). Carlton, Victoria: Blackwell Publishing Ltd.
Nikolenko, O., Jurado, A., Borges, A. V., Knӧller, K., & Brouyѐre, S.
2018. Isotopic composition of N species in groundwater under agricultural areas: a review. Science of the Total Environment. 621, 1415-1432.
Nikolenko, O., Orban, P., Jurado, A., Morana, C., Jamin, P., Robert, T.,
& Brouyѐre, S. 2019. Dynamics of greenhouse gases in groundwater: Hydrogeological and hydrogeochemical controls. Applied Geochemistry. https://doi.org/10.1016/j.apgeochem.2019.04.009.
Otero, N., Torrentó, C., Soler, A., Menció, A., & Mas-Pla, J. 2009.
Monitoring groundwater nitrate attenuation in a regional system coupling hydrogeology with multi-isotopic methods: the case of Plana de Vic (Osona, Spain). Agriculture, ecosystems & environment. 133(1), 103-113.
Rapisarda, P., Camin, F., Fabroni, S., Perini, M., Torrisi, B., & Intrigliolo,
F. 2010. Influence of different organic fertilizers on quality parameters
and the δ15N, δ13C, δ2H, δ34S, and δ18O values of orange fruit (Citrus
sinensis L. Osbeck). Journal of agricultural and food chemistry. 58(6), 3502-3506.
Robertson, W. D., Moore, T. A., Spoelstra, J., Li, L., Elgood, R. J., Clark,
I. D., & Neufeld, J. D. 2012. Natural attenuation of septic system N by anammox. Groundwater. 50(4), 541-553.
Sacchi, E., Acutis, M., Bartoli, M., Brenna, S., Delconte, C. A., Laini, A.,
& Pennisi, M. 2013. Origin and fate of nitrates in groundwater from the central Po plain: insights from isotopic investigations. Applied geochemistry. 34, 164-180.
Wassenaar, L. I. 1995. Evaluation of the origin and fate of nitrate in the
Abbotsford aquifer using the isotopes of 15N and 18O in NO
3−. Applied
geochemistry. 10(4), 391-405.
Xu, S., Kang, P., & Sun, Y. 2016. A stable isotope approach and its
application for identifying nitrate source and transformation process in water. Environmental Science and Pollution Research. 23(2), 1133-1148.
Xue, D., Botte, J., De Baets, B., Accoe, F., Nestler, A., Taylor, P., &
Boeckx, P. 2009. Present limitations and future prospects of stable isotope methods for nitrate source identification in surface-and groundwater. Water Research. 43(5), 1159-1170.
For more information on the INSPIRATION Project, please visit: www.inspirationitn.co.uk
If you would like further information about other CL:AIRE publications please contact us at the Help Desk at www.claire.co.uk