Université de Montréal
Post-effets et rééducation à la marche chez le sujet
hémiparétique
Locomotor after-effects and rehabilitation of gait in individuals
with hemiparesis
par
Martina Betschart
École de réadaptation Faculté de médecine
Thèse présentée à la Faculté de médecine
en vue de l’obtention du grade de Philosophiae Doctor (Ph. D.) en Sciences de la réadaptation
Université de Montréal Faculté des études supérieures
Cette thèse intitulée :
Post-effets et rééducation à la marche chez le sujet hémiparétique
Présentée par : Martina Betschart
a été évaluée par un jury composé des personnes suivantes:
Dre Dahlia Kairy
___________________________________________________
Président rapporteur
Dre Sylvie Nadeau
___________________________________________________
Directeur de recherche
Dr Bradford J. McFadyen
___________________________________________________
Codirecteur de recherche
Dre Johanne Higgins
___________________________________________________
Membre interne du jury
Dre Brenda Brouwer
___________________________________________________
Examinateur externe
Dr Numa Dancause
___________________________________________________
Résumé
L’asymétrie de longueur de pas est une caractéristique du patron de marche fréquemment observée chez des personnes qui ont subi un accident vasculaire cérébral (AVC). Très peu d’interventions conventionnelles en réadaptation ont démontré leur efficacité sur ce paramètre de marche. Une approche novatrice utilisant un tapis roulant à double courroie (DC) a récemment présenté des effets prometteurs en réduisant, à court et long termes, l’asymétrie de longueur de pas chez des personnes post-AVC. Cependant, une meilleure compréhension des mécanismes sous-jacents aux changements induits par cette intervention est nécessaire avant que l’utilisation de cette intervention soit recommandée en clinique. Ce projet doctoral visait à améliorer les connaissances sur la contribution musculaire et les facteurs biomécaniques impliqués dans les changements immédiats (c.-à-d. les post-effets) et à long terme de l’asymétrie de la longueur de pas chez des personnes post-AVC. Les objectifs principaux étaient 1) d’analyser l’activité musculaire associée aux changements de longueur de pas après la marche sur un tapis à DC avec des vitesses de courroies inégales, 2) d’évaluer les effets d’un entraînement sur un tapis à DC sur l’asymétrie de longueur de pas et sur la capacité de marche au sol et 3) de quantifier la contribution musculaire et les stratégies sous-jacentes aux changements du patron de marche résultant de l’entraînement. L’hypothèse générale était que les muscles distaux des membres inférieurs seraient majoritairement impliqués dans les changements de longueur de pas induits par la marche sur le tapis à DC avec des vitesses de courroies inégales (ratio 2:1) chez les personnes post-AVC. L’étude transversale (article #1) a quantifié l’activité musculaire des membres inférieurs associée aux post-effets observés au niveau de la longueur de pas après six minutes de marche sur le tapis à DC (ratio 2:1) chez 16 personnes post-AVC et 10 personnes saines. Les résultats ont confirmé que les muscles distaux, c.-à-d. les fléchisseurs plantaires et dorsaux, étaient associés aux post-effets de la longueur de pas. Ces post-effets ont été observés, quel que soit le membre inférieur (c.-à-d. parétique ou non parétique) qui était sur la courroie rapide. La deuxième étude, a démontré que six séances d’entraînement sur le tapis à DC conduisaient à une réduction de
personnes post-AVC (article #2). Les changements ont persisté un mois après l’entraînement. En outre, les résultats de cette étude pilote ont suggéré une bonne faisabilité de ce protocole d’entraînement dans un environnement clinique (données supplémentaires de l’article #2). Dans l’article #3, il a été démontré que l’amélioration post-entraînement de la symétrie et de la vitesse de marche était associée à une variété de stratégies et de contributions musculaires chez nos participants. Cependant, une contribution prédominante a été observée au niveau du membre inférieur entraîné sur la courroie rapide avec des tailles d’effet modérées obtenues surtout pour les changements de moment et d’activité musculaire des fléchisseurs plantaires pendant la phase d’appui de la marche. Suite à ces résultats et ceux de l’article #1, il a été suggéré que ce groupe musculaire jouait un rôle principal dans l’adaptation locomotrice et la réduction à long terme de l’asymétrie de la longueur de pas chez des personnes post-AVC. Néanmoins, des études cliniques contrôlées avec une population plus importante sont nécessaires afin de préciser la pertinence de l’entraînement sur le tapis à DC ainsi que les différentes stratégies musculaires associées aux changements de l’asymétrie de longueur du pas à long terme chez des personnes post-AVC.
Mots-clés : Accident vasculaire cérébral, Adaptation locomotrice, Tapis à double courroie,
Abstract
Step length asymmetry is a common characteristic of post-stroke gait, but considered as particularly resistant to conventional gait interventions. A recent novel approach using a split-belt treadmill (SBT) showed promising results in short- and long-term reduction of step length asymmetry post-stroke. However, the underlying mechanisms of this intervention and its effects must be better understood before recommending its use in clinical settings. This project aimed to improve our current knowledge about muscular and biomechanical factors contributing to immediate and long-term changes in step length asymmetry in chronic stroke survivors. The main objectives were to: 1) analyze muscle activity associated with changes in step length after walking at unequal belt speeds on a SBT; 2) test the effects of repeated exposure to SBT walking on step length asymmetry and gait ability during walking over ground; and 3) investigate the muscular contributions and strategies involved in these changes. To attain these objectives, a cross-sectional analysis was conducted followed by a pilot training study. The general hypothesis was that distal lower limb muscles are the main contributors to SBT-induced changes in step length asymmetry in chronic stroke survivors using a SBT protocol where two belts were set at unequal speeds with a ratio of 2:1 for a period of time (split-belt configuration). The cross-sectional study analyzed the immediate changes in muscle activity and step length after six minutes of SBT walking in a group of 16 individuals post-stroke and in 10 healthy controls. The findings confirmed that regardless of the side (paretic or non-paretic) walking on the fast belt during split-belt configuration, changes in muscle activity of the ankle plantar- and dorsiflexors were mainly associated with changes in step length symmetry (paper #1). The pilot training study demonstrated that repeated exposure to SBT protocol reduced step length asymmetry and improved walking speed over ground in 12 individuals post-stroke (paper #2). Improvements persisted at least one month post-training. Findings also indicated that from a therapist’s viewpoint the training protocol was easy to use and practical in a clinical environment (supplementary data paper #2). Paper #3 showed that these consistent improvements in gait parameters were achieved by a variety of muscular contributions and strategies which involved both lower limbs with a
were found in the plantarflexor group during late stance of gait for both net joint moments and muscle activity in the training study. These results combined with the findings of paper #1 indicate that overall, step length asymmetry post-stroke can be successfully reduced with repeated exposure to the tested SBT protocol with distal lower limb muscles appearing to be strong contributors to locomotor adaptation post-stroke and long-term changes in step length asymmetry. Larger control trials are necessary to confirm the relevance of the use of SBT protocols and to further understand the role of the distal lower limb muscles in improvements in step length symmetry post-stroke.
Keywords: Cerebral stroke, Locomotor adaptation, Split-belt treadmill, Step length symmetry,
Table of Contents
Résumé ... ii
Abstract ...iv
Table of Contents ...vi
List of Tables ... xiv
List of Figures ... xv
List of Abbreviations and Glossary of Terms ... xxiv
List of Equations ... xxvii
Dedication ... xxviii
Remerciements ... xxix
Chapter 1. Introduction ... 1
1.1 General Problem ... 1
1.2 Organisation of the Thesis ... 5
Chapter 2. Literature Review ... 6
2.1 Locomotion in Healthy Individuals ... 6
2.1.1 Definition... 6
2.1.2 Gait Asymmetry in Healthy Individuals ... 9
2.1.3 Net Joint Moments During Walking ... 10
2.1.4 Electromyography ... 12
2.1.4.1 The Electrophysiology of EMG Signals ... 12
2.1.4.2 Interpretation of EMG Signals... 13
2.1.4.3 Factors Affecting EMG Signals ... 14
2.1.4.4 EMG Activity – Force Relationship ... 15
2.1.5 Muscle Activity During Walking ... 17
2.1.5.1 Initial Contact and Early Stance ... 17
2.2 Cerebral Stroke: Overview ... 20
2.3 The Functional Consequences and Burden of a Stroke ... 21
2.3.1 Muscle Weakness ... 22
2.3.2 Altered Muscle Activity ... 23
2.3.2.1 Neuromuscular Control ... 23
2.4 Locomotion After Stroke ... 25
2.4.1 Muscle Activity in Walking Post-stroke ... 25
2.4.1.1 Muscle Activity and Neuromuscular Deficits ... 27
2.4.1.2 EMG and Gait Parameters Relationships ... 28
2.4.2 Step Length Asymmetry Post-stroke ... 29
2.5 The Principle of the SBT Protocol ... 31
2.6 SBT-induced Adaptation and After-effects in Locomotion ... 34
2.6.1 Effects of SBT in Abled-body Locomotion ... 34
2.6.1.1 Fast Changing Spatiotemporal Parameters ... 34
2.6.1.2 Slowly Changing Spatiotemporal Parameters ... 35
2.6.1.3 The Effect of Belt Speeds ... 36
2.6.1.4 How Much Time Is Required for Adaptation and After-effects?... 36
2.6.1.5 How Could The “Error” Be Calculated and Corrected? ... 37
2.6.1.6 Which Structures Are Involved in Locomotor Adaptation? ... 38
2.6.2 Biomechanics Underlying SBT-induced Adaptation and After-effects ... 42
2.6.2.1 The Role of Muscle Activity in SBT Walking ... 42
2.6.2.2 Lower Limb Net Joint Moments ... 47
2.6.3 Effects of SBT Walking on Post-stroke Locomotion ... 48
2.6.3.1 Biomechanics Studied in SBT Walking Following Stroke ... 49
2.6.4 Transfer of SBT After-effects to Walking Over Ground ... 51
2.6.5 Repeated Exposure to SBT Walking ... 53
Chapter 3. Objectives and Hypotheses ... 55
3.1 Main Hypotheses and Objectives ... 55
3.2 Specific Objectives for Scientific Papers in this Thesis ... 57
4.1 Methods: Cross-sectional Study... 59
4.1.1 Participants ... 59
4.1.2 Recruitment ... 60
4.1.3 Clinical Evaluation ... 60
4.1.3.1 Assessments Used for Individuals Post-stroke and Healthy Controls ... 60
4.1.3.2 Additional Assessments for the Stroke Group... 61
4.1.4 Movement Analysis on the Split-belt Treadmill ... 61
4.1.4.1 The Split-belt Treadmill (SBT) ... 62
4.1.4.2 Instrumentation for Biomechanical Analysis and Recording of Muscle Activity ... 62
4.1.5 Experimental Setup and Protocol on the SBT ... 63
4.1.5.1 Familiarization and Determination of Belt Speed ... 63
4.1.5.2 Experimental Protocols ... 64
4.1.6 Data Analysis ... 66
4.1.6.1 Biomechanical Data ... 66
4.1.6.2 Muscle Activity ... 67
4.2 Methods: Pilot Training Study ... 68
4.2.1 Participants ... 68 4.2.2 Recruitment ... 68 4.2.2.1 Recruitment of Participants ... 68 4.2.2.2 Recruitment of Physiotherapists ... 69 4.2.3 Clinical Evaluation ... 69 4.2.3.1 Pre-Evaluation 1 ... 70 4.2.3.2 Pre-Evaluation 2 ... 70 4.2.3.3 Post-Evaluation ... 71 4.2.3.4 Follow-Up ... 71
4.2.4 Biomechanical and EMG Analysis ... 71
4.2.4.1 Instrumentation for Biomechanical Analysis and Recording of Muscle Activity ... 71
4.2.5.2 Training ... 72
4.2.5.3 Post-training ... 73
4.2.6 Symmetry ratios ... 73
4.3 Statistical analysis ... 73
Chapter 5. Results ... 74
5.1 Paper #1: Changes in Lower Limb Muscle Activity After Walking on a Split-belt Treadmill in Individuals Post-stroke. ... 75
5.1.1 Preamble ... 75 5.1.2 Abstract... 76 5.1.3 Introduction ... 77 5.1.4 Methods ... 78 5.1.4.1 Participants ... 78 5.1.4.2 Clinical Evaluation ... 78 5.1.4.3 Experimental Setup ... 78 5.1.4.4 Data Collection ... 79 5.1.4.5 Data Analysis ... 80 5.1.5 Statistics... 80 5.1.6 Results ... 81 5.1.6.1 Step Length ... 81 5.1.6.2 Muscle Activity ... 82 5.1.6.3 Correlation of After-effects ... 82 5.1.7 Discussion ... 83
5.1.7.1 After-effects in Muscle Activity ... 83
5.1.7.2 Adaptation ... 85
5.1.7.3 Limitations ... 86
5.1.8 Conclusion ... 87
5.1.9 Acknowledgments ... 87
5.1.10 Declaration of Conflicting Interests ... 87
5.1.11 Funding... 87
5.1.13 Supplementary Results Paper #1: ... 95
5.1.13.1 EMG Profiles Stroke Group ... 95
5.1.13.2 SBT-induced Changes in Step Length and Muscle Activity in Healthy Controls ... 97
5.1.13.3 Effects on Coactivation and Coordination in Individuals Post-stroke and Healthy Controls ...102
5.2 Paper #2: Repeated Split-belt Treadmill Walking Improved Gait Ability in Individuals with Chronic Stroke: A Pilot Study ...107
5.2.1 Preamble ...107 5.2.2 Abstract...108 5.2.3 Introduction ...109 5.2.4 Methods ...112 5.2.4.1 Participants ...112 5.2.4.2 Pre-Evaluation ...112
5.2.4.3 Evaluation of Outcome Parameters ...113
5.2.4.4 Training Protocol ...114
5.2.5 Statistical Analysis...115
5.2.6 Results ...116
5.2.6.1 Changes in Outcome Parameters ...116
5.2.7 Discussion ...117
5.2.8 Study Limitations ...121
5.2.9 Conclusion ...121
5.2.10 Declaration of Conflict of Interest ...121
5.2.11 References ...128
5.2.12 Supplementary Results Paper #2: Feasibility Study ...132
5.2.12.1 Introduction...132
5.2.12.2 Methods...133
5.2.12.3 Statistical Analysis ...134
5.2.12.4 Results ...134
5.2.12.7 Future Studies ...137
5.2.12.8 References ...137
5.3 Paper #3: A Pilot Study on the Quantification of Lower Limb Muscle Activity and Joint Moments Underlying the Reduction of Step Length Asymmetry Over Ground in Individuals Post-stroke After Repeated Split-belt Treadmill Walking. ...138
5.3.1 Preamble ...138 5.3.2 Abstract...139 5.3.3 Introduction ...140 5.3.4 Methods ...142 5.3.4.1 Participants ...142 5.3.4.2 Evaluation ...143 5.3.4.3 Clinical Evaluation ...143 5.3.4.4 Biomechanical Evaluation ...143
5.3.4.5 Training Protocol and Sessions ...146
5.3.4.6 Statistical Analysis ...146
5.3.5 Results ...147
5.3.5.1 Step Length Symmetry ...147
5.3.5.2 Walking Speed ...148
5.3.5.3 Net Joint Moments ...148
5.3.5.4 Muscle Activity ...149 5.3.6 Discussion ...149 5.3.7 Study Limitations ...155 5.3.8 Conclusion ...156 5.3.9 Conflict of Interest ...156 5.3.10 Funding...156 5.3.11 Acknowledgements ...156 5.3.12 References ...167
Chapter 6. General Discussion ...171
6.1 Principal Findings ...171
6.2 SBT-induced Changes in Outcome Parameters ...174
6.2.1 SBT-induced Effects on Step Length in Individuals Post-stroke ...175
6.2.2 Lower limb Impairments and After-Effects on EMG Activity ...178
6.2.3 The Functional Relevance of SBT-induced Effects on Muscle Activity ...180
6.2.3.1 Mechanisms of Locomotor Adaptation ...181
6.2.3.2 Forward Propulsion and Step Length Changes ...185
6.2.4 EMG Timing and Interlimb Coordination during SBT Walking ...186
6.3 Effects of Reapeated Exposure to SBT Walking ...188
6.3.1 Step Length Asymmetry ...188
6.3.2 Joint Kinetics and Muscle Activity...189
6.3.2.1 Heterogeneity in EMG During Walking Over Ground ...190
6.3.2.2 Symmetry in Biomechanical Parameters and Step Length ...191
6.3.3 Feasibility ...192
6.4 Study Limits ...193
6.4.1 Limitations of the Study Protocols ...193
6.4.1.1 Cross-sectional Analysis ...193
6.4.1.2 The Training Study ...194
6.4.2 Limitations of the Parameters Tested ...195
6.4.2.1 Cross-sectional Analysis ...195
6.4.2.2 Training Study ...196
6.4.3 Generalization ...197
6.5 For Future Research ...198
6.5.1 Recommendations Concerning Parameters Analyzed ...198
6.5.2 Recommendations for Training Studies ...200
6.5.2.1 Parameters Analyzed ...200
6.5.2.2 Study Protocol ...201
6.6 Clinical Implications ...201
6.6.1 The Relevance of Assessing and Training Step Length Asymmetry ...202
6.6.1.1 Recommendations for the Use of the SBT Protocol ...202
Chapter 8. References ...206
Appendix I Acquisition and Treatment of Electromyography Signals in the Scope of the Thesis “Locomotor After-effects and Rehabilitation of Gait in Individuals with Hemiparesis”. i Appendix II Questionnaires Feasibility Study (n = 3) ... xiv
Appendix III Ethics Certification for the Cross-sectional Study ... xxvi
Appendix IV Ethics Certification for the Training Study ... xxix
Appendix V Consent Form for Participants with Stroke (Cross-sectional Study) ... xxxii Appendix VI Consent Form for Healthy Participants (Cross-sectional Study) ... xliv Appendix VII Consent Form for Participants with Stroke (Training Study) ... lvi Appendix VIII Abstracts Published (International Conferences) ... lxix
List of Tables
Chapter 2: Literature Review
TABLE 2-1. Spatiotemporal and Functional Gait Parameters (Mixed Gender). ...8
Chapter 4: Methods
TABLE 4-1. Schedule of Clinical and Biomechanical Evaluations. ...70
Chapter 5: Results
Paper #1:
TABLE 5-1. Patients Demographics (N = 16). ...88 Supplementary Results Paper #1:
TABLE 5-2. Demographics and Functional Parameters of Control (n = 10) and Stroke (n = 16) Participants. ...105
Paper #2:
TABLE 5-3. Participants’ Demographics and Stroke Characteristics. ...122 TABLE 5-4. Gait Parameters at Pre-, Post- and Follow-up Evaluation. ...123
Paper #3:
TABLE 5-5. Participants’ Demographics and Stroke Characteristics. ...158 TABLE 5-6. Kinetic and Kinematic Parameters at Pre-, Post- and Follow-up Evaluation (n=10). ...159 TABLE 5-7. Indices of Peak Net Moments at Pre-, Post- and Follow-up Evaluation (n=10). ...161
List of Figures
Chapter 2: General Introduction
Figure 2-1. Schematic illustration of gait phases in human gait cycle based on the Ranchos Los Amigos terminology: Initial contact and loading response (0 - 10%), mid stance 10 - 30%, terminal stance 30 - 60%, initial swing 60 - 73%, mid 73 - 87% and terminal swing 87 - 100% of the gait cycle (modified from Perry, 1992; SPLER, 2016). ……….7 Figure 2-2. Illustration of muscle activity during gait. A) Muscle activity profiles
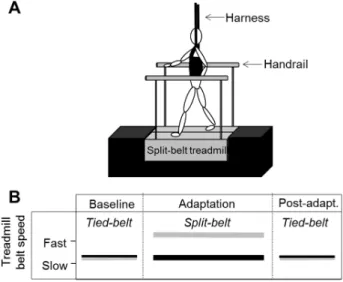
during one gait cycle (0 - 100%). B) Muscles contributing to acceleration (+) or deceleration (-) of a segment. Abbreviations: Q’ceps = Quadriceps; VAS = vastus lateralis; GAS = gastrocnemius lateralis; SOL = Soleus. (A) Modified from Basmajian & De Luca (1985); B) Modified from Zajac, Neptune & Kautz (2003). ………...…………...18 Figure 2-3. A) Schematic representation of a split-belt treadmill (SBT) with handrails and harness. B) Example of a SBT protocol with the tied-belt configuration (Baseline; belts at equal speeds), followed by a split-belt configuration (Adaptation) and finalized with the belts at equal speed again (tied-belt; Post-adaptation); Modified and adjusted from Lauzière et al. (2014a). ………...…….33 Figure 2-4. Left-hand figures illustrate changes in reactive (stride length and %
stance time) parameters. On the right-hand side the adaptive parameter (step length) is shown as symmetry (A) and for each side individually (B). Data is illustrated as differences between limbs. During split-belt configuration, belts had a 3:1-speed ratio. Adapted from Reisman et al. (2005). ………...35 Figure 2-5. Illustration of SBT-induced changes in center of oscillation (A, B) and limb phasing (C) at tied-belt (baseline) and split-belt (early adaptation). IC slow describes the initial contact of the leg walking on the slow belt
during adaptation period (continuous lines) and vice versa for the IC fast (dotted lines). A) shows that the slow leg oscillates less in extension compared to baseline in contrast to the fast leg (B) which oscillates more in extension. This leads to a shorter interlimb phasing duration (C). Modified from Choi & Bastian (2007). ………...…..41
Chapter 4: Methods
Figure 4-1. Instrumented participant on the split-belt treadmill used for data collection described in the present thesis. The participant is secured with a harness and instrumented with surface electrodes and active
markers.é………62
Figure 4-2. Schematic illustration of the experimental protocol; A) Participants in the stroke group walked at two conditions (NP-fast and P-fast condition). B) Healthy individuals conducted the protocol with their dominant side on the fast belt. During the first condition belt speed was increased on the side of the non-paretic leg (NP-fast condition). During the second condition the paretic leg walked on the fast belt during Adaptation (P-fast condition). Conditions included baseline, adaptation (split-belt), and post-adaptation. Continuous lines represent the belts running at comfortable speed for individuals post-stroke or at 70% of comfortable speed for the healthy controls. Dotted lines represent the faster belt. The ▲ are time points of signal registration. The ● indicates the registration time at the end of post-adaptation to quantify the washout of after-effects between the NP-fast and P-fast condition. ….66
Chapter 5: Results
Paper #1:
Figure 5-1. Group mean of step length (SL) for the paretic (A dotted line; B ◊) and non-paretic (A solid line; B ■) limbs as well as SL ratio (C, 1.0 = perfect symmetry) during baseline (Base), early adaptation (EA), late adaptation (LA) and early post-adaptation (EPA) of NP-fast and P-fast
conditions. Late post-adaptation (LPA) presents the washout of after-effects between conditions. Standard deviations are shown with dotted (paretic side) and continuous lines (non-paretic). *significant difference to baseline after Bonferroni correction; [■] denotes significance only on the non-paretic side……...……….89 Figure 5-2. Group mean and standard deviations of normalized EMG for 10 consecutive gait cycles of non-paretic (NP) (■) and paretic (P) (◊) muscles during the NP-fast condition for early adaptation (EA), late adaptation (LA) and early post-adaptation (EPA). *Indicates significant changes when compared to baseline. Abbreviations: tibialis anterior (TA), gastrocnemius lateralis (GL), rectus femoris (RF), semitendinosus (ST), vastus lateralis (VL), and the gluteus medius (GLM). …..……90 Figure 5-3. Group mean and standard deviations of normalized EMG of (NP) (■)
and paretic (P) (◊) muscles during P-fast condition. Figure legend corresponds to Figure 5-2. ……...…..………..91 Figure 5-4. Associations between changes (%max) in paretic GL activity and % of
change in paretic (∆) and non-paretic (●) SL during NP-fast condition. For the P-fast condition, associations between the changes in paretic TA (B1) and ST activity (B2) with % of changes in SL (paretic▲; non-paretic●) and SL ratio (○). ………...…………..………...92 Supplementary Results Paper #1: EMG Profiles Stroke Group
Figure 5-5. Illustration of lower limb muscles with significant changes from baseline to early post-adaptation during the NP-fast condition: paretic gastrocnemius lateralis (GL), non-paretic vastus lateralis (VL) and tibialis anterior (TA). Presented are group mean EMG activation profiles and corresponding standard deviations (black: baseline; grey: post-adaptation) over normalized gait cycle. The horizontal lines represent the duration of stance during baseline (black) and post-adaptation (grey). Percentage of change of the mean RMS is illustrated next to the activation profiles. ………...95
Figure 5-6. Illustration of group average paretic (top panel) and non-paretic (bottom panel) EMG activation profiles with significant changes from baseline to early post-adaptation during the P-fast condition. The muscles are: the paretic tibialis anterior (TA), vastus lateralis (VL), rectus femoris (RF) and paretic gastrocnemius lateralis (GL) and VL. The non-paretic semitendinosus (ST, grey) approached significance. Legend corresponds to the legend of Figure 5-5. ………..…………96 Supplementary Results Paper #1: SBT-induced Effects on Step Length in Healthy Controls Figure 5-7. Step length of the dominant (black continuous) and non-dominant (grey
dotted) side during baseline, early adaptation (EA), late adaptation (LA) and early post-adaptation (EPA). * represent significance for changes in step length and **for the ratio when compared to baseline. Significance level was set at alpha = 0.05 after the Bonferroni correction...…...98 Supplementary Results Paper #1: SBT-induced Effects on EMG Amplitude in Healthy
Controls
Figure 5-8. Scatter graphs with normalized EMG of six dominant (D) (■) and non-dominant (ND) (◊) muscles during the four periods of walking. For early adaptation (EA), late adaptation (LA) and early post-adaptation (EPA), mean values of EMG are presented for 10 consecutive gait cycles. At baseline (Base), 10 gait cycles are averaged. *Indicates significant changes when compared to baseline for non-dominant [◊] or dominant [■]. Abbreviations: tibialis anterior (TA), gastrocnemius lateralis (GL), rectus femoris (RF), semitendinosus (ST), vastus lateralis (VL), and the gluteus medius (GLM). ……….………...101 Supplementary Results Paper #1: Effects on Coactivation and Coordination in Individuals
Post-stroke and Healthy Controls
Figure 5-9. Boxplots illustrating coactivation duration between the tibialis anterior (TA) and the gastrocnemius lateralis (GL) for healthy controls
(left-The duration is represented in % of the gait cycle during baseline (BASE) and post-adaptation (POST). For the stroke group, co-activation is presented for both the NP-fast condition (C1) and P-fast condition (C2). *Denotes significant differences between baseline and post-adaptation period. Significance level was set at alpha = 0.05. ...103 Figure 5-10. Boxplots illustrating coactivation duration between the vastus lateralis
(VL) and the semitendinosus (ST) for healthy controls (left-hand graph) and individuals post-stroke (middle and right-hand graphs). The duration is represented in % of the gait cycle during baseline (BASE) and post-adaptation (POST). For the stroke group, co-activation is presented for both the NP-fast condition (C1) and P-fast condition (C2). *Denotes significant differences between baseline and post-adaptation period. Significance level was set at alpha = 0.05. ……….104 Figure 5-11. Diagrams illustrating coefficient (Rxy) of cross-correlation (CC) for the tibialis anterior (TA), gastrocnemius lateralis (GL), vastus lateralis (VL), rectus femoris (RF), semitendinosus (ST), and gluteus medius (GLM) for individuals post-stroke during both conditions (NP-fast and P-fast) (green) as well as for healthy controls (blue). *indicates significance between groups or period; **indicates significant differences between groups for both, baseline and post-adaptation. ..106 Paper #2:
Figure 5-12. Flow-diagram presenting recruitment, training and evaluation processes………..124 Figure 5-13. (A) Individual (grey and green) and mean (black) step length symmetry
ratios (longer/shorter) during pre- post- and follow-up evaluation. Dotted green lines represent the values for individuals with initial shorter step on the paretic side (paretic-fast group). The grey balk on the level of ratio one represents the range of ratio considered as symmetrical (1.00-1.08) according to Patterson et al (2010). (B) Individual absolute changes in symmetry ratio from pre- to post-evaluation (black) and pre- to follow-up post-evaluation (grey) ordered by
the size of the initial asymmetry (P1 to P12). P1 showed the largest initial asymmetry and P12 the smallest. P<NP = paretic fast group. The black horizontal line represents the threshold for clinically relevant change (0.15). *denotes significant differences between conditions (p ≤ 0.017). ……….125 Figure 5-14. Individual step length (SL) during pre, post- and follow-up evaluation.
A) paretic and B) non-paretic step lengths of participants trained in the non-paretic-fast group; C) paretic and D) non-paretic step lengths for participants trained in the paretic-fast group. The description FAST side refers to the side trained on the faster belt and vice versa for SLOW
side...……….………...126
Figure 5-15. Associations between initial L/S ratio and A) absolute change in L/S ratio from pre- to post-evaluation and B) pre- to follow-up evaluation. C) Associations with initial TUG at comfortable (comf.) (black) and fast (grey) speeds with the absolute change in L/S ratio from pre- to follow-up evaluation, respectively. D) Associations between absolute (abs.) change slow (black) and fast (grey) step length (SL) from pre- to post-evaluation with abs. changes from pre- to follow-up evaluation, respectively. Abbreviations: abs = absolute, pre = pre-evaluation, post = post-evaluation, comf. = comfortable. L/S = longer/shorter, s = seconds; *denotes significant differences between conditions (p ≤ 0.05). …....127 Supplementary Results Paper #2:
Figure 5-16. Areas of feasibility. ……….………...………….134
Paper #3:
Figure 5-17. Illustration of step length ratio (longer/shorter) obtained by 3D-motion analysis (3D-MA) in the laboratory (black) and by walking over a paper carpet (grey) during pre-, post- and follow-up evaluation. The grey bar between 1 and 1.08 on the y-axis represents the range at which the ratio
differences between evaluations (p ≤ 0.05) for both, carpet and laboratory data. The comparison of the ratios obtained during the 3D-motion analysis and walking over a paper carpet did not show any significant differences (p = 0.470). ………...………..…162 Figure 5-18. (A) Slow (pale blue) and fast (dark blue) step lengths (SL) during pre-, post and follow-up evaluation. B) Individual slow and fast step lengths. Group mean is illustrated in black. Dotted lines represent step lengths for participants trained in the P-fast group. *indicates significant changes from post-hoc analysis (p ≤ 0.05). ...163 Figure 5-19. Fast (top) and slow (bottom) net joint moments for ankle (A), knee (B)
and hip joints (C) normalized for cycle duration (0-100%; x-axes). Illustrated are group net moments during pre- (dotted line), post- (black) and follow-up (grey) evaluations. * indicates statistical significance after post-hoc analysis with Bonferroni correction (p ≤ 0.05). Abbreviations: PF = Plantarflexion, DF = Dorsiflexion, Flex = Flexion, Ext = Extension...164 Figure 5-20. Individual EMG activity (%max RMS) during pre-, post- and follow-up (FU) evaluations. EMG values are presented in correspondence to the slow and fast sides with group means (black) and individual means (grey) for paretic-fast trained (dotted) and non-paretic fast trained (continuous) limbs. Effect sizes (Hegdes gav) are reported for the changes pre- to post- [∆] and pre- to follow-up [▲] evaluation considering mean values from both sides. Abbreviations: TA = Tibialis anterior, GL = Gastrocnemius lateralis, VL = Vastus Lateralis, ST = semitendinosus. *The rectus femoris muscles are not illustrated since data from 6 participants were missing for certain evaluation
sessions...……….………....165
Figure 5-21 Group mean peak plantarflexion moments of the participants trained in the P-fast group (A) and NP-fast group (B). Peak moments are illustrated for paretic (grey) and non-paretic (black) side. …………166
Chapter 6: General Discussion
Figure 6-1. Muscles with a significant increase (green dotted lines) or near significance (black dotted lines) from baseline to post-adaptation for healthy controls (upper part) and individuals post-stroke (bottom part). For the stroke group, results from both conditions are presented (NP-fast and P-(NP-fast). Abbreviations: NP = Non-paretic, P = Paretic, D = Dominant, ND = Non-dominant, TA = tibialis anterior, GL = gastrocnemius lateralis, VL = vastus lateralis, RF = rectus femoris. ..181
Appendix I:
Figure A1. Example of the electrical activity of a lower limb muscle registered during walking showing the amplitude of activity (A) and the burst duration (B) of a signal normalized to the gait cycle (0 - 100%). …….iii Figure A2. Illustration of an activation profile of the paretic (black) and (non-paretic) right dorsiflexor muscle (tibialis anterior) from an individual with stroke during one gait cycle. The profile was obtained by the average mean RMS from 10 gait cycles of comfortable walking. …....iii Figure A3. Illustration of several signal bursts whereas one presents a spike-shaped
burst excursion encircled with red. ………...………….iv Figure A4. Screen captures of frequency spectres without (left-hand) and with signal gaps (right-hand). The left-hand image represents a usual and correct frequency spectrum of a lower limb muscle during walking. The arrows on the right-hand image indicate the signal gaps. For both images, x-axes represent the firing frequency and the y-axes amplitude of the electrical activity. Thus in the left-hand image, most of the energy is found in the frequency range 10 - 250Hz. ………...………v Figure A5. A) raw EMG signal from one subject with amplitude artefacts with peak excursion circled in red. B) Illustration of a single spike. The exponential decay of the spike is characteristic for an artefact. The O’Keeffe algorithm detects and corrects the artefact based on a high (HT) and low threshold (LT) C) Superimposed activation profiles
profiles with RMS values without (blue) and with (green) application of the artefact correction (O’Keeffe et al, 2001). Home-based images from an individual post-stroke. …...…………...vi Figure A6. Illustration of strongly zoomed raw signal with signal shifts (white dotted line). The spikes (red) represent the time point of signal shifts. The blue line represents the final, corrected signal. ……….vii Figure A7. A) Depiction of activation profiles from the dorsiflexors during
comfortable walking on the treadmill. Illustrated are individual activation profiles (RMS values) from eight gait cycles and the mean of one participant. B) Shown is the group mean activation profile (pale line). The green areas represent the time where the signal was considered as active. C) presents the normalized mean and the upper and lower limits of standard deviation (SD). Values of the x-axes represent the normalized gait cycle (0 - 100%). ...x Figure A8. Cross-correlation of two signals (X and Y); Baseline correlation
between the two activation profiles (A) contribute to a single point to the cross-correlation function (B). Profile Y gets shifted backwards by one data point (C) which leads to the next correlation value (Rxy) in the function (D). Y is subsequently step-wise shifted backwards until the number of iterations is equivalent to the number of data points in the signal (E) and leads to the final cross-correlation curve (F). Modified from Nelson-Wong et al. (2009)...xii
List of Abbreviations and Glossary of Terms
6MWT 6-Minute Walk Test10MWT 10 Meter Walk Test
%max Percentage of the maximum
ACSM American College of Sports Medicine ADL Activities of daily life
AVC Accident vasculaire cérébral BBS Berg Balance Scale
CC Cross-correlation
CLRC Constance-Lethbridge Rehabilitation Center CRLB Centre de réadaptation Lucie-Bruneau
cm Centimeter
CMRR Common Mode Rejection Ratio
CMSA Chedoke McMaster Stroke Assessment CPG Central pattern generators
DC Double courroie
D Dominant
EMG Electromyography
FAC Functional ambulation category FA-P Anteroposterior force
FM-L Mediolateral force
FV Vertical force
GRF Ground reaction force GL Gastrocnemius Lateralis GM Gastrocnemius Medius GLM Gluteus Medius
GMAX Gluteus Maximus
H-reflex Hoffman reflex HAMS Hamstrings
HSF Heart and Stroke Foundation
Hz Hertz
IRGLM Institut de réadaptation Gingras-Lindsay de Montréal ISEK International Society of Electrophysiology and Kinesiology L/S Longer step length / shorter step length
m Meter
ms Milliseconds
MEG Magnetoencephalography MUR Muscular utilization ratio MVC Maximal voluntary contraction
N Number
ND Non-dominant
NP Non-paretic
NSLD Normalized step length difference
P Paretic
p. Page
RF Rectus Femoris
RMS Root-mean-square
Rxy Correlation coefficient of the cross-correlation analysis
s Second SBT Split-belt treadmill SL Step length SOL Soleus ST Semitendinosus TA Tibialis Anterior TUG Timed Up and Go test UMN Upper motoneuron VL Vastus Lateralis VM Vastus Medialis
Glossary of terms
NP-fast NP-fast refers to the condition when the non-paretic leg walked on the belt which was set at fast speeds during the period of adaptation.
P-fast P-fast refers to the condition when the paretic leg was walking on the belt which was set at fast speeds during the period of adaptation.
Fast-belt Denotes that the results presented refer to the side that was walking on the faster belt during the period of adaptation and vice versa for the expression “slow-belt”.
Fast SL Refers to the step length of the leg that was walking on the faster belt during the period of adaptation; vice versa for “slow SL”; the same concept applies to all parameters described with “slow” or “fast” (e.g., slow TA, or fast GL).
Longer SL This expression indicates that the step length of this side was longer compared to the step length of the other side. Vice versa for “shorter SL”; These terms were also used for the equation of the symmetry ratios in papers #2 and #3.
List of Equations
Paper #2:Equation 5-1. Normalized SL differences ...113 Equation 5-2. Symmetry ratio L/S ...113 Equation 5-3. Symmetry ratio ...145 Equation 5-4. Symmetry index ...145
Dedication
À mes parents qui ont toujours crû en moi, qui m’ont soutenue et qui ont toujours été un ilôt de stabilité dans n’importe quelle situation de ma vie et malgré l’océan entre nous.
Ich widme diese Dissertation meinen Eltern, die seit eh und je an mich geglaubt haben, mich unterstützten und mir Halt gaben in jeglichen Situationen meines Lebens unabhängig der Distanzen, die zwischen uns lagen.
Remerciements
C’est pour moi une véritable chance d’avoir pu faire mon doctorat dans une Université francophone qui est renommée au Québec. J’ai donc choisi d’écrire ces remerciements en français, qui n’est pas ma langue maternelle, mais que j’ai pu pratiquer et améliorer énormément durant mes études. Cette chance, je l’ai eue grâce à ma directrice Sylvie Nadeau. C’est à elle que j’aimerais dédier mes plus sincères remerciements. Tout d’abord, elle m’a donné confiance en moi pour réussir un projet qui me semblait loin de mes capacités. Pendant toutes mes études, elle m’a aidée à garder cette confiance. Également, elle s’est énormément investie dès le début pour permettre à une étudiante internationale comme moi de faire sa place dans un environnement universitaire compétitif. Sylvie, j’aimerais te remercier pour ta confiance, ta disponibilité incroyable et surtout pour ta patience avec moi. Avec ta rigueur scientifique et ton regard critique, tu m’as donné le bagage qui m’a permis d’escalader cette énorme montagne qu’est le doctorat, et de surmonter les passages éprouvants. J’ai retenu une de tes phrases qui disait : « Une carrière est basée sur des modèles, et moi j’ai eu de bons modèles dans mon parcours académique. » Moi, j’ai eu la chance de t’avoir comme modèle, et je ne te remercierai jamais assez pour ton soutien infaillible. J’aimerais aussi adresser de grands remerciements à mon codirecteur Bradford McFadyen. Brad, je me souviendrai toujours des mots que tu répétais souvent : « Everything depends on the question you have ». Grâce à toi j’ai appris à élargir ma façon d’interpréter mes résultats et à ne pas voir juste des chiffres, mais toujours les remettre dans un contexte plus large. Cette façon de réfléchir et les connaissances théoriques que tu m’as apportées m’ont aidée à ne pas me perdre et à suivre le bon chemin vers le sommet de la montagne.
En plus du bagage apporté par mes directeurs, j’ai eu la chance d’être accompagnée par mes deux camarades d’études. J’aimerais d’abord remercier Séléna Lauzière pour son soutien au début de mon projet. Et tout au long de mes études, j’ai apprécié nos bonnes discussions scientifiques, sa rétroaction critique et constructive sur mon travail, et aussi son aide pour bien nommer des outils techniques en québécois : « c’est du tape », « et ça ? », « aussi, du tape ». Ensuite, j’adresse un remerciement sincère à ma compatriote Carole Miéville, qui m’a donné un peu de ma Suisse natale et qui comprenait mieux que personne ma façon de penser. Carole,
merci d’avoir été disponible pour me guider dans les débuts pour m’intégrer à ce système universitaire nouveau pour moi et m’aider à gérer les informations dans une langue étrangère. Surtout, merci d’avoir eu la patience de corriger mon français et de m’aider à le perfectionner. J’aimerais aussi remercier les ingénieurs et techniciens de l’IRGLM Youssef El Khamlichi, Daniel Marineau, Philippe Gourdou et Michel Goyette. Merci pour votre disponibilité, votre aide énorme dans la collecte et le traitement des données. J’aimerais surtout remercier Michel Goyette de m’avoir aidé à trouver des outils pour analyser des signaux EMG, la variable principale de mon projet. J’aimerais aussi remercier les cliniciennes et les coordinatrices de recherche du CLRC et de l’IRGLM pour leur collaboration et leur intérêt dans mon projet. Merci à toutes, c’était une réelle motivation de travailler avec vous. J’aimerais aussi adresser un grand remerciement à tous les participants de mes deux projets, en particulier à Luis et Elizabeth. Tous les participants ont travaillé fort pendant des collectes de données parfois exigeantes. Parmi tous ces participants, les personnes ayant subi un AVC ont joué un rôle très important pour moi, car ils m’ont rappelé pour quoi et pour qui je faisais ces études.
J’aimerais remercier également le Réseau provincial de recherche en adaptation-réadaptation et l’Ordre professionnel de la physiothérapie du Québec qui ont permis la réalisation d’une partie de mon projet de doctorat, ainsi que la Faculté de médecine et la Faculté des études supérieures de l’Université de Montréal pour l’octroi de bourses d’études. Un merci tout particulier à l’équipe de recherche en réadaptation sensorimotrice qui m’a soutenue financièrement pendant 3 ans.
J’aimerais remercier Christian O. et Ian pour leur disponibilité et leur aide pour perfectionner l’anglais dans mon examen de synthèse et dans ma thèse ; Christof et Christian Z., merci d’avoir crû en moi et de m’avoir donné la petite poussée nécessaire pour me lancer dans mes études doctorales ; Ron Clijsen, de « University College Thim van der Laan »,
hartelijk dank d’avoir accéléré les démarches bureaucratiques pour que j’aie un dossier
complet à temps pour la demande d’admission à l’Université de Montréal.
Merci à mes colocataires du « 912 », à Allan et Lucie pour les beaux moments j’ai pu vivre avec vous. Lucie, merci de m’avoir soutenue et aussi de m’avoir supportée pendant nos trois ans de colocation. Thibault et surtout Noémie, merci de m’avoir écoutée et de m’avoir
Claude, vous avez mérité un énorme remerciement pour votre accueil et votre amitié. Merci de m’avoir donné un toit sur la tête pendant mes premières et dernières semaines à Montréal, d’être de si bons amis et parfois des parents de remplacement. J’aimerais mentionner tous mes amis suisses, dont Marisa, Susanne et Nadia (dankä Mädels), qui ne m’ont pas oubliée et qui ont toujours suivi mon parcours même d’aussi loin. J’aimerais aussi remercier sincèrement mon complice Daniel de m’avoir attendue pendant quatre ans, et pour son amour qui n’a jamais diminué malgré l’océan qui était entre nous. Merci Daniel, pour tes messages quotidiens, pour ton regard positif et pour les beaux moments que j’ai pu vivre avec toi en vacances en Amérique du Nord et dans nos montagnes suisses. Dankä Dani, du hesch mer
enorm Chraft gä i dere Zyt.
Le plus grand remerciement est dirigé vers ma famille, mon frère Jonas et mes parents. Ces derniers ont toujours crû en moi, sont restés forts quand j’étais plus faible et m’ont motivée et soutenue tout au long de mes études. Merci Maman et Papa d’avoir toujours été proches par vos pensées, malgré la distance. Dankä Mami und Dädi, dass ihr immer a mich
Chapter 1. Introduction
1.1 General Problem
Recent statistics estimate around 50 000 new cases of stroke occur each year in Canada, with 315 000 Canadians living with the consequences of a stroke (Heart and Stroke Foundation, 2016). These individuals are left with persistent deficits including muscle weakness (Arene & Hidler, 2009; Heart and Stroke Foundation, 2016), contralesional spasticity (Arene & Hidler, 2009; Watkins et al., 2002), impaired balance control (Hayes, Donnellan, & Stokes, 2016), as well as secondary health complications such as fatigue and depression (Robinson-Smith, Johnston, & Allen, 2000; Van de Port et al., 2006). These deficits reduce the quality of life of stroke patients, impairing the performance of daily living activities such as self-care or walking (Harris & Eng, 2004). The Public Health Agency of Canada reported that 80% of stroke survivors are restricted in their daily activities and 60% are not independent in everyday living (Heart and Stroke Foundation, 2016). For example, the analysis of 205 individuals three years post-stroke in the Netherlands revealed that non-independent stroke survivors for activities of daily life (ADL) have 1.93 times the odds of having declined mobility compared to independent individuals (Van de Port et al., 2006). Evidence suggests that improving walking ability by means of intensive physical training can increase mobility status (Kwakkel et al., 2004) and is a key factor for the ability to “get out and about” in the community (Salbach et al., 2013). Indeed, this is in agreement with the report that 74% (97/115) of stroke survivors report that the ability to “walk in the community” is essential to their quality of life (Lord et al., 2004). Therefore, it is not surprising that improving walking function is considered a major goal for recovery in individuals post-stroke at a chronic stage (Harris & Eng, 2004).
While it is clear that improving walking function is critical for the well-being of stroke survivors, it is difficult to attain. After discharge from rehabilitation, 60.7% of 115 stroke survivors reported that they were able to walk in the community, with 7.6 - 16.9% limited to walking within their immediate environment or requiring supervision for leaving home (Lord et al., 2004). Although many stroke survivors do regain some walking function and
independence, their gait capacity is often characterized by reduced walking speed (Ada, Dean, & Lindley, 2013; Mulroy et al., 2003; Perry et al., 1995), endurance (Ada et al., 2013; Dunn et al., 2015) and symmetry (Lauzière et al., 2014b; Patterson et al., 2008a) when compared to unimpaired individuals. Reported mean walking speed in individuals post-stroke ranges from 0.10 - 1.08 m/s (Ada et al., 2013; Perry et al., 1995; Taylor et al., 2006). In terms of endurance post-stroke, individuals can cover a distance ranging from 171 - 318 meters during a six-minute walk test (Dunn et al., 2015). Unfortunately, these values are below the suggested speed (0.9 - 1.2 m/s) and distance (600 m) required for full community ambulation, including passing crosswalks or going to shopping malls (Andrews et al., 2010; Salbach et al., 2013). Moreover, around 60% of individuals post-stroke walk with temporal asymmetries (stance time, double support and swing time) and about 33.3% have interlimb differences in step length (Patterson et al., 2010a; Patterson et al., 2008a). Such gait asymmetry can have major consequences on the structural organization of the body. In particular, gait asymmetry has been associated with a loss of bone density, increased neuromuscular pain on the non-paretic limb (Jorgensen et al., 2000), greater challenges in balance control during walking (De Bujanda et al., 2003) and gait inefficiencies (Detrembleur et al., 2003; Ellis, Howard, & Kram, 2013). Beyond the physical consequences of gait asymmetry, it is important to the psychological well-being of stroke patients, as regaining a “normal” walking pattern is “important” to “very important” for individuals post-stroke (Bohannon, Horton, & Wikholm, 1991).
There are multiple interventions that have been developed to improve walking function in stroke patients. In particular, strong evidence exists for treadmill interventions (with or without body-weight support) in improving walking speed and endurance in individuals with chronic stroke (Macko et al., 1997; Mehrholz, Pohl, & Elsner, 2014; Patterson et al., 2008b; Pohl et al., 2002; Polese et al., 2013). In addition, the use of auditory feedback and increasing walking speeds have resulted in successful improvements in temporal aspects of symmetries such as double stance or cycle duration (Afzal et al., 2015; Cha, Kim, & Chung, 2014; Lamontagne & Fung, 2004; Yen, Schmit, & Wu, 2015). However, these interventions did not improve spatial features of gait such as step length. Indeed, step length asymmetry tends to be more resistant to physical interventions compared to other gait parameters and functional
outcomes. A longitudinal evaluation of individuals post-stroke showed that only 14% (5/35) of the patients improved step length symmetry, compared to 30% and 62% who improved gains in walking speed and balance, respectively (Patterson et al., 2015).
In an attempt to address the lack of successful interventions for step length symmetry, the development of a novel and unconventional therapeutic approach consisting of the use of split-belt treadmill (SBT) walking led to a reduction of step length asymmetry which was maintained over three months post-training in 12/12 individuals with chronic stroke (Reisman et al., 2013). The mechanisms underlying split-belt induced improvements in step length symmetry have been studied with cross-sectional investigations using an error-augmentation strategy (Choi & Bastian, 2007; Malone & Bastian, 2010; 2013; Ramas et al., 2007; Reisman, Block, & Bastian, 2005). Essentially, the SBT disrupts the gait pattern by increasing the speed of one of the belts relative to the other. These unequal belt speeds initially lead to an asymmetry (error) in different gait parameters. This creates a need for the gait pattern to be corrected, in order to overcome and adjust to the new walking demand. As a consequence, the patient’s gait pattern becomes more symmetrical through adaptation of the interlimb gait parameters such as step length. When the belts are set back at equal speeds (ratio 1:1) after-effects can be observed where the individuals continue to walk with their newly adapted step lengths for some steps. Whereas in healthy individuals these after-effects are characterized by an asymmetrical step length, individuals post-stroke with initial step length asymmetry display a reduced asymmetry.
In the last decade, the response to SBT walking has been studied extensively in both healthy controls and individuals post-stroke by using spatiotemporal gait parameters (Dietz, Zijlstra, & Duysens, 1994a; Lauzière et al., 2014a; 2016; MacLellan et al., 2014; Malone & Bastian, 2013; Ogawa et al., 2014; Reisman et al., 2005; Reisman et al., 2007; Vasudevan & Bastian, 2010). However, only a few of these studies have assessed biomechanical parameters that could explain the observed changes in spatiotemporal parameters (Dietz et al., 1994a; Lauzière et al., 2014a; 2016; MacLellan et al., 2014; Ogawa et al., 2014). For example, the analysis of ground reaction forces (GRF) and muscle activity led to the hypothesis that ankle stiffening is a major control strategy used to adjust the gait pattern observed during SBT
and effort after SBT walking were studied in individuals post-stroke (Lauzière et al., 2014a). The results of this study demonstrated that plantarflexion moments play a major role in the SBT-induced step length after-effects in both healthy controls and individuals post-stroke. These results suggest that improving plantarflexor muscle function could facilitate improvements in step length symmetry post-stroke.
Unfortunately, to date lower limb muscle activity in individuals post-stroke has not yet been studied in relation to SBT-induced spatiotemporal changes. This is surprising, considering that impaired muscle function is among the most common deficits following a stroke (Arene & Hidler, 2009; English et al., 2010; Hafer-Macko et al., 2008), with a large impact on gait symmetry, speed and performance (Daly et al., 2011; Hall et al., 2011; Hsu, Tang, & Jan, 2003; Lin et al., 2006). Furthermore, the effects of repeated exposure to SBT walking on muscle activity, joint moments, and other biomechanical aspects have not yet been investigated. As such, the analysis of lower limb muscle activity and biomechanical parameters could contribute to a greater understanding of the mechanisms underlying SBT-induced improvements in individuals who have suffered a cerebral stroke. Furthermore, such analyses could shed light on the strategies used by individuals post-stroke to change their step length symmetry over the long term and how these strategies are related to deficits in muscle function. From a clinical point of view, knowledge about long-term changes in muscle function can facilitate the development of specific and evidence-based treatment approaches targeting improvements in step length symmetry. The results on SBT-induced short- and long-term reduction of step length asymmetry post-stroke are promising. However, the marginal knowledge about the underlying contribution of lower limb muscles affected by the stroke emphasizes the need for more research on this topic.
The main goal of this doctoral thesis was two-fold: 1) to investigate the short-term changes in muscle activity during SBT walking in individuals post-stroke and its associations with the modification of the gait pattern induced by SBT walking; 2) to analyze the effect on gait biomechanics and muscle activity during repeated SBT walking with the aim of improving step length asymmetry in individuals post-stroke.
1.2 Organisation of the Thesis
The thesis begins with a review of the literature before presenting the general hypotheses and objectives. The literature review starts with an overview of the characteristics and biomechanics of gait in healthy individuals to provide a reference for the interpretation of stroke-induced impairments in gait. The characteristics of post-stroke gait are described in a subsequent section which begins with a short overview of epidemiological facts about cerebral stroke. This is followed by a description of the main deficits and disorders relevant for the understanding of impairments in gait post-stroke. A main focus is set on impaired muscle function secondary to a cerebral stroke. Furthermore, studied changes in gait are presented within the framework of our current understandings of error-augmentation theories. The literature review section is followed by the objectives of the present work in line with the three scientific papers included in this thesis. The subsequent method section provides a description of the participants and methods used to approach the objectives. The first paper presents the results of a cross-sectional study on the effects of SBT walking on muscle activity in individuals post-stroke (paper #1). The second (paper #2) and third (paper #3) papers present the clinical and biomechanical changes of a repeated exposure to SBT walking on individuals post-stroke. Finally, in the general discussion section, the results of the three papers are synthesized and their impact discussed relative to what has been shown in the literature. Supplementary results are presented at the end of the corresponding papers. The appendices include a detailed description of the electromyography (EMG) treatment and analysis (Appendix I), questionnaires used in paper #2 (Appendix II) and documents regarding study ethics (e.g., consent forms) (Appendix III - VII) and published abstracts (Appendix VIII).
Chapter 2. Literature Review
2.1 Locomotion in Healthy Individuals
Walking is a complex task requiring the coordination of trunk with upper and lower limbs (Dietz, 2002) that needs to be constantly adapted to the demands of the environment (Lam, Dietz, & Anderschitz, 2006; McFadyen & Carnahan, 1997; Patla et al., 1991) in order to provide controlled forward progression of the body without falling. Smooth progression requires the interaction of different neuronal systems controlling the coordination of limb muscles (Dietz, 1992; MacKay-Lyons, 2002) in an energy efficient manner: “… the human
body, if not influenced markedly by internal or external factors, will integrate the motion of the various segments of the body and control the activity of the muscles so that the energy required for each step is minimal” (Inman, 1966,)abstract, p. 1).
After learning how to walk as a child, locomotion becomes automated and requires little thought, such that it is often taken for granted. However, as attested by the complexity of deficits following injuries (such as a cerebral stroke) and the difficulty of its rehabilitation, it is clear that there is a greater complexity to walking. Over decades, research have investigated human gait and succeeded in the definition of its characteristics and the mechanisms involved (Baker, 2007). The use of biomechanical and EMG analysis have contributed to the quantification of these mechanisms as described in the following sections.
2.1.1 Definition
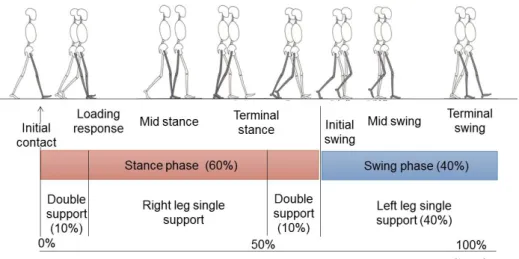
Walking is a dynamic and rhythmic task (Kuo & Donelan, 2010) that can be divided into different gait events (Figure 2-1) which together make up a gait cycle. These events are the initial contact, loading response, mid stance, terminal stance, pre-swing, initial swing, mid-swing and terminal mid-swing as defined, for example, by Perry and colleagues (Perry, 1992; Perry & Burnfield, 2010). During these sub-phases, three main functional tasks are required to provide upright walking and forward progression: 1) shock absorption at weight acceptance during initial contact and loading response, 2) single limb support and equilibrium control during mid stance, energy generation to provide forward acceleration during late stance, and 3) the control of the foot trajectory during swing phases (Winter, McFadyen, & Dickey, 1991;
Winter, 1987). Furthermore, a long-standing and still supported theory suggests that gait kinematics, such as horizontal and vertical displacement of the center of gravity, are regulated with the goal of achieving these subtasks in the most energy efficient manner possible (Kao et al., 2013; Saunders, Inman, & Eberhart, 1953).
When gait characteristics are compared across individuals, the gait cycle must be normalized and converted into a percentage. Initial contact starts at 0% and terminal swing ends at 100% of the cycle. The gait cycle is divided into stance and swing phases. During ‘normal’ gait, a person spends about 60% of the gait cycle in the stance phase as illustrated in Figure 2-1. At its beginning and its end, both feet touch the floor during the so-called double support phase (20-24% of the gait cycle in total). During the remaining approximately 40%, one leg is in swing (single support of the opposite leg).
Figure 2-1. Schematic illustration of gait phases in human gait cycle based on the Ranchos
Los Amigos terminology: Initial contact and loading response (0 - 10%), mid stance 10 - 30%, terminal stance 30 - 60%, initial swing 60 - 73%, mid 73 - 87% and terminal swing 87 - 100% of the gait cycle (modified from (Perry, 1992; SPLER, 2016).
Characteristics of the gait cycle can be quantified by different analysis approaches. For example, the temporal and spatial aspects of the gait pattern can be characterized by its cadence, step length or stance duration (Winter, 2009). In addition, a kinematic analysis can provide a more profound and detailed description of the gait pattern by looking at joint angles,
segment displacements, and velocities or accelerations of joint movements during the different phases. Finally, a kinetic analysis can provide a description of the required effort to achieve the task of walking, as it requires the exertion and absorption of force (Nadeau, Betschart, & Bethoux, 2013; Winter, 2009). Each individual’s gait cycle contains a basic pattern overlaid with some personal characteristics (Inman, 1966). To a certain degree, individual fluctuations in walking patterns are considered normal and tend to increase with age (Brach et al., 2010). As far as spatiotemporal and functional parameters are concerned, Table 2-1 presents a summary of values for different gait parameters measured during walking over ground from studies including healthy elderly individuals of both genders.
TABLE 2-1. Spatiotemporal and Functional Gait Parameters (Mixed Gender). Parameter
[number of participants studied] Range Age (years)
Step length (cm) A [n = 241] 57 - 66 > 60 CWS (m/s) B-D [n = 96 - 941] 1.33 - 1.51 1.22 - 1.49 0.80 - 1.41 40 - 49 50 - 59 60 - 69 Endurance 6MWT (m) E, F [n = 28-35] 607 - 705 563 - 667 48 - 54 55 - 64 412 - 579 65 - 75
Functional mobility TUG (s) E
[n = 281]
7 - 9 60 - 69
A) (Aboutorabi et al., 2015); B) (Bohannon & Williams Andrews, 2011); C) (Studenski et al., 2011); D) (Salbach et al., 2013); E) (Steffen, Hacker, & Mollinger, 2002); F) (Elazzazi et al., 2012); Abbreviations: cm = centimeter; m = meters; s = second; CWS = comfortable walking speed; 6MWT = 6 Minute Walking Test; TUG = Timed Up and Go test.
The relevant measures for this thesis include step length and walking speed, endurance and functional mobility. Step length symmetry ratios in healthy individuals will be presented separately because of the parameter’s particular relevance to this thesis. While it may be
assumed that healthy individuals display symmetrical gait patterns, this has been a topic of debate as described in the following section.
2.1.2 Gait Asymmetry in Healthy Individuals
According to Sadeghi et al. (2000) symmetry is defined as “a perfect agreement between the actions of the lower limbs” during walking (p. 35). In more practical terms, this can be defined as the absence of statistical differences when comparing bilaterally measured parameters of gait (Sadeghi et al., 2000). These authors reviewed 25 studies to address the assumption of symmetrical gait in individuals without pathologies. Among the reviewed studies, several differences in step or stride length, foot placement or joint motion can be found. In addition, two studies were reported that found differences between the amplitude of lower limb muscle activity or in the muscular contribution to locomotion (Arsenault, Winter, & Marteniuk, 1986; Ounpuu & Winter, 1989). However, these discrepancies between the gait cycles of each side of the body were considered as a natural and functional consequence of the phenomenon of limb dominance. Furthermore, comparison of gait kinematics of older adults with younger controls revealed that only older adults presented step length asymmetries (Nagano et al., 2013). The asymmetry found in this group of older adults might be explained by the increased asymmetry in lower limb strength found to be associated with ageing (Perry et al., 2007). Therefore, gait asymmetry (spatiotemporal, kinematic or kinetic) can be age-related and not only induced by pathologies. The lack of step length asymmetry found in the younger group was in accordance with the aforementioned findings on muscle activity and joint kinetics (Burnett et al., 2011; Teixeira-Salmela et al., 2008). For example, the analysis of trunk and lower limb muscle activity in 31 healthy young adults during different functional tasks, such as walking, revealed no asymmetry between sides during any task (Burnett et al., 2011). In agreement with this observation, Teixeira-Salmela and colleagues (2008) found no statistical difference in the joint power and mechanical work of lower limbs when comparing between dominant and non-dominant sides.
These functional and natural asymmetries in gait parameters found in older individuals emphasize the use of a range of symmetry rather than talking about the lack of statistical
81 healthy participants (mean age = 64.2 [SD 22.4] years) during walking over ground for that purpose (Patterson et al., 2010a). With regards to the step length parameter, healthy participants showed a mean value of 1.03 (SD 0.02). The range of “normal” asymmetry was between 0.92 - 1.08 in healthy individuals, where a ratio of “1” indicates perfect symmetry. To perform statistical analyses of these asymmetries, the authors recommended the use of a simple ratio which divides the larger value by the smaller value in order to obtain values always ≥ 1. If the direction of asymmetry (shorter paretic or non-paretic side) is relevant, the use of a ratio with respect to the side was recommended by a recent topical review on gait symmetry (e.g., dominant/non-dominant, paretic/non-paretic) (Lauzière et al., 2014b). Overall, it is clear that to achieve the task of walking and to provide a symmetrical pattern of walking requires complex control of joint biomechanics and muscle activity. The biomechanics and muscle activity underlying the task of walking in healthy individuals will be described in the following section.
2.1.3 Net Joint Moments During Walking
During the stance phase at comfortable walking speed, the ground reaction forces (GRF) quantify the forces exerted on the ground during walking. The vertical component (FV)
represents the vertical acceleration including the weight support, the anteroposterior component (FA-P) is associated with the braking and forward propulsion phases and the third
component represents the mediolateral acceleration (FM-L) of the body (John et al., 2012;
Kesar et al., 2011; Nadeau et al., 2013). Using kinematic and anthropometric models, these forces can be used to calculate the net joint moments (Winter, 2009).
During walking, the main contribution to support and forward acceleration of the body is within the sagittal plane (Eng & Winter, 1995) and includes the hip, knee and ankle joints (Winter, 1980). At the hip, the sagittal joint moment profile at comfortable walking speed is biphasic and characterized by an extension moment at initial stance (Eng & Winter, 1995). This extension moment subsequently turns into a flexion moment from mid stance to toe off producing a hip flexion to accelerate the leg into swing. An extension moment appears at the end of swing phase contributing to a deceleration of the swinging leg and to prepare for initial contact (Eng & Winter, 1995).