doi: 10.3389/fbuil.2020.549106
Edited by: Lance Manuel, University of Texas at Austin, United States Reviewed by: Karl Kim, University of Hawaii, United States Jennifer M. Brown, National Oceanography Centre, United Kingdom *Correspondence: Tracy Kijewski-Correa tkijewsk@nd.edu
Specialty section: This article was submitted to Wind Engineering and Science, a section of the journal Frontiers in Built Environment Received: 04 April 2020 Accepted: 25 August 2020 Published: 22 September 2020 Citation: Kijewski-Correa T, Taflanidis A, Vardeman C II, Sweet J, Zhang J, Snaiki R, Wu T, Silver Z and Kennedy A (2020) Geospatial Environments for Hurricane Risk Assessment: Applications to Situational Awareness and Resilience Planning in New Jersey. Front. Built Environ. 6:549106. doi: 10.3389/fbuil.2020.549106
Geospatial Environments for
Hurricane Risk Assessment:
Applications to Situational
Awareness and Resilience Planning
in New Jersey
Tracy Kijewski-Correa1* , Alexandros Taflanidis2, Charles Vardeman II3, James Sweet3, Jize Zhang2, Reda Snaiki4, Teng Wu4, Zachariah Silver2and Andrew Kennedy2
1Department of Civil and Environmental Engineering and Earth Sciences, College of Engineering and Keough School of Global Affairs, University of Notre Dame, Notre Dame, IN, United States,2Department of Civil and Environmental Engineering and Earth Sciences, College of Engineering, University of Notre Dame, Notre Dame, IN, United States,3Center for Research Computing, University of Notre Dame, Notre Dame, IN, United States,4Department of Civil, Structural and Environmental Engineering, University at Buffalo, Buffalo, NY, United States
Mitigation of losses due to coastal hazards has become an increasingly urgent and challenging problem in light of rising seas and the continued escalation of coastal population density. Unfortunately, stakeholders responsible for assuring the safety of these coastal communities are not equipped with the engineering research community’s latest tools for high-fidelity risk assessment and geospatial decision support. In the event of a hurricane or nor’easter, such capabilities are exceptionally vital to project storm impacts on critical infrastructure and other municipal assets and to inform preemptive actions that can save lives and mitigate property damage. In response, a web-based visualization environment was developed using the GeoNode content management system, informed by the needs of municipal stakeholders. Within this secure platform, registered users with roles in planning, emergency management and first response can simulate the impact of hurricanes and nor’easters using the platform’s storm Hazard Projection (SHP) Tool. The SHP Tool integrates fast-to-compute windfield models with surrogate models of high-fidelity storm surge and waves to rapidly simulate user-defined storm scenarios, considering the effects of tides, sea level rise, dune breaches and track uncertainty. In the case of a landfalling hurricane, SHP tool outputs are automatically loaded into the user’s dashboard to visualize the projected wind, storm surge and wave run-up based on the latest track information published by the National Hurricane Center. Under either use case, outputs of the SHP Tool are visualized within a robust collaborative geospatial environment supporting the seamless exploration of centralized libraries of geographic information system (GIS) data from federal, state, county and local authorities, with tools to add user-supplied annotations such as notes or other geospatial mark-ups. This paper will overview the development and deployment of
this platform in the State of New Jersey, detailing the cyberinfrastructure design and underlying computational models, as well as the user stories that inspired the platform’s functionalities and interfaces. The study concludes with reflections from the process of piloting this project with stakeholders at the state and municipal level to support more risk-responsive and data-informed decision making.
Keywords: risk assessment, hurricane, nor’easter, wind, storm surge, waves, cyberinfrastructure
INTRODUCTION
Mitigation of losses due to coastal hazards has become an increasingly urgent and challenging problem worldwide. Recent studies suggest that populations exposed to coastal flooding have nearly tripled at upwards of 480 million people (Kulp and Strauss, 2019). The United States is not immune to this trend: 126 million people or 40% of the nation’s population live in coastal counties, a 39% increase since 1970 (NOAA, 2020). Vulnerability of these populations to storm-induced wind, wave and surge effects is particularly noteworthy, considering that much of the densely populated Atlantic and Gulf Coasts are just meters above mean sea level. This vulnerability has been tragically illustrated in recent years, with four of the five costliest hurricanes occurring in the past decade (2012: Sandy, 2017: Harvey, Irma and Maria) (Insurance Information Institute, 2018). In the coming decades, annual losses associated with hurricanes are estimated to increase from $28 billion to $39 billion and outpace the growth of the economy (CBO, 2016). This is in part driven by increased coastal inundation, rainfall rates, and intensity/frequency of major hurricanes associated with anthropogenic warming and sea level rise (Knutson et al., 2019, 2020). This has rightfully created great urgency around resilience-enhancing activities in many coastal communities.
Regrettably, stakeholders responsible for assuring the safety of these coastal communities are not equipped with tools that offer the level of fidelity and granularity needed to inform preemptive actions that can save lives and mitigate property damage, both in support of long-term planning and management of coastal development, but also for emergency preparedness and response to approaching storms. In both use cases, stakeholders require an accurate projection of site-specific wind, wave, and surge hazards, which can be challenging to deliver in an approachable manner to the non-specialists leading these efforts given the sophistication and complexity of these simulations. These hazards in turn must be examined in light of community-specific socio, economic and infrastructural vulnerabilities, requiring access to a large volume of locally-sourced and ever evolving geospatial information. Without the development of tools that can support the exploration of the intersections between hazard exposure and vulnerability at sufficient fidelity and granularity, and with the level of site-specificity necessary for local decision making, resilience-enhancing outcomes cannot be achieved and significant time, effort and resources can regrettably be misdirected.
In response, this study overviews the development and implementation of a new web-based visualization environment that enables non-specialists to explore critical geographic
information system (GIS) data including visualizations of site-specific wind and coastal hazards resulting from their own user-defined tropical and extratropical storm scenarios. The sections that follow overview the situational awareness and planning use cases that inspired the platform’s development, the underlying computational models, their integration into cyberinfrastructure with custom user interfaces, and the lessons learned in the translation of this research into practice to support more risk-responsive and data-informed decision making. While the process engaged by the authors to develop this platform is readily extensible more generally to coastal communities confronting the effects of sea level rise and tropical/extratropical storms, the development herein focuses on the State of New Jersey given its recent experience with the devastating losses in Superstorm Sandy, 90% of which were the result of storm surge (NJ-OEM, 2014). Sandy also exposed barriers to effective emergency management, post-disaster recovery and resilient planning processes that created the need for this web-based visualization environment, which the state has now deployed under the banner ofNJcoast1.
TECHNOLOGY LANDSCAPE
The localized nature of decision making to mitigate coastal hazards has given rise to a number of custom simulation tools and platforms, with varying levels of fidelity, data interoperability, resolution, and access, serving both specialist and non-specialist end users. For instance, the Modeling and Decision Support Framework (MDSF) is a UK initiative to quantify economic and social impacts of flooding under present and future scenarios using the ArcGIS visualization
environment frequented by specialists (Ramsbottom et al.,
2005). In the context of specialist-led planning initiatives, such federally-funded products are the dominant source of hazard characterizations, e.g., New Jersey practitioners similarly employ the Federal Emergency Management Agency (FEMA) Hazus-MH loss estimation framework, supplemented by other simulation tools such as the National Hurricane Center’s (NHC) Sea, Lake, and Overland Surges from Hurricanes (SLOSH) maximum of
maximums storm surge model (NJ-OEM, 2014). However,
non-specialists play a critical role in local decision making to reduce risk or support recovery after storm events. These practitioners and policy makers may have limited capacity to engage platforms designed for specialists at the state or federal level, forcing greater reliance on published regulatory products, e.g., FEMA’s
flood insurance rate maps (FIRMs). However, without the ability to explore scenarios, these products offer only low-resolution “snapshots” of risk that are limited in their ability to inform the full spectrum of local decision processes necessary for coastal resilience.
The recognition of the need to more broadly reach non-specialists and the public-at-large has given rise to other platforms that have packaged similarly valuable coastal risk information in more consumable, web-accessible formats.
Particularly in humanitarian response, there has been
a proliferation of non-specialist, web-based hazard and vulnerability mapping environments for sharing information and developing custom web-based solutions for managing
disaster risk, e.g., OpenDRI Platform (OpenDRI, 2020).
Another non-specialist example is Climate Central’s Surging Seas platform, which has assembled a range of web-accessible interactive maps and tools to visualize coastal flood risk and sea level rise (Climate Central, 2020). The application site of this study, New Jersey, similarly recognized the need for more interactive visualizations of hazard data for the non-specialist
decision maker, with NJ FloodMapper (NJADAPT, 2020)
offering the capability to visualize infrastructure data overlaid with static hazard maps (e.g., FEMA Flood Zones, select SLOSH results for categories 1–4, Superstorm Sandy inundation levels, sea level rise scenarios).
The prior examples all provide select storm or flood scenarios, often the worst case, to visualize risk for future planning, but are incapable of visualizing the impacts of specific storm events, which is particularly important for emergency managers responding to a landfalling hurricane or conducting table-top exercises. This use case has given rise to another class of web-based platforms, with examples in the US including SURGEDAT (SCIPP, 2020) and the Mid-Atlantic Regional Association Coastal
Ocean Observing System (MARACOOS, 2020), which visualize
historical or current oceanic data. Of particular relevance to this study is the Coastal Emergency Risks Assessment (CERA) platform, which projects storm surge levels for the latest NHC track simulated using the Advanced CIRCulation
(ADCIRC) model (CERA, 2020). This platform represents a
major enhancement to situational awareness under landfalling hurricanes, offering significantly higher accuracy than the NHC’s SLOSH-based approaches in near-shore coastal regions (Resio and Westerink, 2008). Still none of these platforms can support the site-specific evaluation of arbitrary storm scenarios at the request of the user, nor combine their visualizations of these hazards with the locations of critical infrastructure assets in a given community, making them limited in their utility for the non-specialist.
This unmet need motivated the authors’ initial development of a credentialed, web-based geospatial environment called CyberEye, which used a Django-based GeoAnalytics framework to enable non-specialists to execute high-fidelity, real-time probabilistic risk assessments for user-specified hurricane scenarios in the Hawaiian Islands (Kijewski-Correa et al., 2014). This marked the first integration of surrogate models within a web-based environment to enable the rapid, user-led simulation and visualization of ADCIRC-caliber storm surge projections
based only on the input of a handful of storm parameters. As these ADCIRC storm surge simulations normally take thousands of hours of computing time and considerable sophistication to execute (Luettich et al., 1992), the translation of this capability to a 2-minute simulation executed by a non-specialist in a web browser marked a significant advance. This success in overcoming the non-specialist’s limited technical capacity and computational resources by using a surrogate model provided the scaffold upon which the NJcoast platform, detailed in the following sections, was constructed.
SYSTEM REQUIREMENTS
The design of NJcoast was ultimately anchored by three objectives. The first was to encourage greater use of the state’s considerable GIS data investments, regardless of the municipal user’s level of proficiency in common GIS platforms or ability to generate and maintain such data locally. The second objective was to support better risk-informed decision making by giving municipalities access to the state-of-the-art simulation tools for coastal hazards in a manner that was approachable to non-specialists and reduced the computational effort from hours in a cluster to minutes on a personal device. The third was that the resulting decision-support system be deployed quickly (18-month timeline) using a scalable, sustainable approach that would allow the state to maintain the system and steadily grow the user base (and add new GIS data) without substantial additional investment. Meeting this aggressive timeline necessitated leveraging the CyberEye project (see section “Technology Landscape”), previous advances in modeling and simulation by the authors and their partners (see section “Storm Hazard Projection Tool”), and existing open GIS platforms (see section “Data Services”) to develop a centrally-managed, cloud-hosted service. This approach ensured that end users at the municipal level would not have to invest in installing, maintaining, or learning new software: internet access and sufficient memory to operate a standard web browser would be the only user requirement, ensuring compatibility with any personal computer or mobile device.
Meanwhile, it was important that the first two objectives were met in a manner that was responsive to the needs of the targeted end users. As such, detailed needs assessments were conducted in two New Jersey pilot municipalities impacted significantly by Superstorm Sandy: the Borough of Keansburg (Monmouth County) and Berkeley Township (Ocean County). Confirmed breaches in Keansburg, which relies significantly on its dunes for protection from storm surge, and considerable back bay flooding in Berkeley were the primary drivers of the substantial storm-surge losses in these communities. Generative sessions with these stakeholders prioritized the data critical to municipal functions, identified pain points in their planning and emergency management processes, and benchmarked their capacity/technology-readiness. These sessions revealed that both communities continued to struggle with recovery efforts following Superstorm Sandy, experiencing continued nuisance flooding and the impacts of seasonal winter storms
that only further degraded their coastal protective systems. Vulnerabilities in both communities centered on considerable residential development in close proximity to the shoreline with strong reliance on waterfront amenities, recreation and tourism. Emergency management infrastructure and critical facilities in both municipalities were also inundated and suffered substantial losses of functionality, hampering rescue efforts. Berkeley’s vulnerabilities were further compounded by its large senior population with significant mobility challenges and electricity dependence. Over 500 properties were “substantially damaged” in these communities during Sandy and major efforts are underway to mandate elevating properties above new base flood elevations, particularly in Keansburg, which is almost entirely in a FEMA Special Flood Hazard Area (SFHA). The needs assessments documented the desire for multi-hazard storm projection tools simulating both hurricanes and the more frequent winter storms, evaluation of dune breaches and tide impacts, real-time updates for landfalling hurricanes, roles-based data access, and user reporting/annotation tools to further enrich third-party GIS data as local information evolves. These needs were mapped to functional design requirements, as summarized in Table 1.
User Roles
These objectives and design requirements ultimately guided the development of cyberinfrastructure that would support collaborative decision making using geospatial data, as well as the computational models that would characterize the hazards of greatest concern to these coastal communities. Central to the design was role-based data management. While all users would have secure access to a common dashboard environment, the data pre-loaded into that dashboard would be dictated by that individual’s role (and corresponding need/authority to access sensitive data). Further, since the platform would host data from potentially hundreds of municipalities, the system would need to similarly tailor the data served to users: only those with an approved municipal affiliation would have their dashboards populated with that municipality’s GIS data, in addition to the statewide open data available to all users. As such, the system was designed to manage secure groups dedicated to each of the state’s 565 municipalities.
Beyond municipal affiliation, the needs assessments ultimately identified three roles that further inspired the user stories driving core functionalities of the platform. The Planning & Service
Delivery role supports users in Planning, Engineering and Public Works who generally need access to the full inventory of geospatial data discussed later in section “Data Services,” while retaining the ability to export GIS layers created in NJcoast to commercial environments like ArcGIS for more advanced analysis by specialists. Meanwhile, theEmergency Management role supports “war room” functions with a subset of the full geospatial data inventory more relevant to response planning, evacuation and staging activities under landfalling storms. Finally, the First Responders role is a subset of the prior role, reducing the amount of pre-loaded data so that non-specialists on the ground can interact with only the most essential information on their mobile device as they respond to calls or assist in evacuation, rescue and response functions.
User Stories
Through the Agile development process, three user stories were developed to articulate functional requirements of the system. The first story is around scenario planning wherein users execute aUser-Specified Scenario for a hurricane or nor’easter with the intensity and landfall location of their choosing and in doing so, potentially explore additional scenarios such as the impact of high tides, sea level rise or a breach of their dunes. Within minutes, these users can visualize the projected wind field, storm surge or total run-up in their community. These results can be saved and loaded into collaborative maps where they are displayed against a range of infrastructure assets within the catalog of GIS layers, discussed later in section “Data Services,” pre-loaded into their dashboard based on role. With the ability to swiftly execute, save, query and load countless storm simulations into collaborative maps, users can use this powerful desktop simulator to lead their own systematic exploration of “what if ” scenarios of greatest concern. Accordingly, this user story supports planning, engineering and public work officials working on major deliverables like Floodplain Management and Capital Improvement Plans, as well as Office of Emergency Management teams executing tabletop exercises. In the latter case, the platform’s probabilistic simulation capabilities can time march using different “time to landfall” settings to understand how track uncertainties would affect staging, evacuation and response protocols. These user interfaces are discussed later in section “User Interfacing.” The Planners, Engineers and Public Works officials inspiring this user story drove the considerations
TABLE 1 | Identified user needs and design requirements.
Identified need Resulting design requirement
Support for multiple hazards: Hurricanes and nor’easters (winds, storm surge, inland flooding), nuisance flooding in high tides, inland flooding due to rainfall, high wind events
SHP Tool Extensions:
Nor’easter modeling capabilities (wind, surge) Scenario settings for effect of tides
Loss of protective features: Simulate breaches in dune system SHP Tool Extensions: scenario settings for impact of degraded and compromised dunes Dedicated roles: Not all users need access to the same data,
capabilities
Dedicated roles/groups pre-loaded with relevant GIS layers based on role, municipal affiliation
Situational awareness support: Real-time updates during landfalling storm tracks
Automatic execution of SHP Tool based on latest NHC track, continual refresh for active storms
Annotation capabilities: Simplified interface to enrich existing geospatial data with evolving information
associated with managing and manipulating a large catalog of GIS data – resulting in many of the requested features at the backside of the platform for integrating, maintaining and visualizing GIS data from different third-party sources.
The second user story focuses on emergency management. The municipal Emergency Managers experiences inspired expanded simulation capabilities for the Storm Hazard Projection Tool, prompting the team to add several features: nor’easter simulation options, breach scenarios, and tide effects. These users also requested a new level of automation that resulted in the platform’sActive Storm simulation mode. When there is an active hurricane in the North Atlantic Basin that has the potential to impact New Jersey, the system automatically ingests the latest NHC storm track and pre-loads the wind field, storm surge and total run-up results into the user dashboard so they can be swiftly examined alongside relevant GIS layers, enhancing situational awareness in the days and hours prior to landfall. In comparison with the coarse storm surge height projections normally reported to officials over entire coastlines, NJcoast projects wave run up over land to reveal the depth of water anticipated at a given parcel, enabling officials to better identify dry zones for staging or wet zones that may need more assistance in evacuation. By preloading these results, users can swiftly explore additional scenarios to determine if high tide or breaches may require modifications to these preparedness plans. In order to reference past experience, users can also access cached results fromHistoric Storm simulations that use archival tracks from events like Superstorm Sandy for comparison with the approaching event. Unfortunately, nor’easter tracks are not similarly issued by the NHC, though User-Specified Scenarios could still be used manually by emergency managers to prepare for an approaching nor’easter. Note that these three user simulation actions: User-Specified Scenarios, Active Storms and Historic Storms require executions of the Storm Hazard Projection (SHP) Tool and appropriate user interfacing, respectively discussed later in sections “Storm Hazard Projection Tool” and “User Interfacing.” The third and potentially unexpected user story centers on the use of the platform forService Delivery. Even in the absence of a hurricane warning or planning activity, a user-friendly, web-based environment to create custom maps accessing a centralized library of GIS data from federal, state and municipal sources was of considerable value in managing the day-to-day operations within municipalities staffed by non-specialists with limited technical capacity. For this and the other two user stories, the ability to save, mark-up, and share maps across teams, using a suite of annotation tools, discussed later in section “User Interfacing,” invited better coordination and capture of data that was commonly still managed through inefficient paper trails. While users requested integration of other mobile reporting tools for functions such as permitting, damage assessment and code enforcement to further streamline exchange of information and enhance situational awareness, this ultimately was not authorized in the final scope of work from the State of New Jersey. However, users have created workarounds using the platform’s annotation tools to add notes to NJcoast maps with comments reporting conditions and observations at specific locations.
While these user stories identified the platform requirements and preferred features at the onset of the project, the agile development process also re-engaged these same users for acceptance testing at later stages of the project. Periodic testing windows presented beta-test scenarios to elicit feedback on user interfaces and visualizations so that the density of information could be optimized further for each role, especially critical for Emergency Managers and First Responders who need to be able to use the tool to make decisions swiftly.
CYBERINFRASTRUCTURE DESIGN AND
IMPLEMENTATION
Based on these user requirements and an evaluation of available open-source geospatial content management systems (CMS),
GeoNode2 was adopted as the CMS for NJcoast, given the
criticality of geospatial services in this project. GeoNode brings together a number of mature and stable open-source software projects under a consistent and easy-to-use interface, including
the popular Django3 web framework development platform
and GeoServer4 for its geospatial services. As such, it enables
non-specialized users to efficiently create and visualize catalogs of geospatial data as interactive layered maps. These layered maps capture rich expressions of critical data such as coastal hazards, infrastructure and other assets, as well as user-supplied annotations that can be easily saved, loaded and shared with other registered users. GeoNode is already being used to
share and visualize hazard datasets globally (GRDRR Lab,
2020), with a tool suite that enables efficient integration of diverse third-party and user-supplied GIS data and metadata. Its security standards and credentialed user access to data based on assigned role ensures trustworthy management of sensitive data across diverse teams. More critical to this application is the fact that GeoNode can be easily adapted to support custom toolsets tailored to meet unique geospatial data generation and visualization needs, which was leveraged in this case to create the SHP Tool detailed in section “Storm Hazard Projection Tool.”
GeoNode is maintained by the Open Source Geospatial Foundation (OSGeo)5, which provides a large, sustainable, active
community of developers ensuring the framework’s viability as well as rapidly addressing bug issues and security concerns. Given its use by the World Bank and United Nations, among others, it continues to receive active support and development (World Bank, 2017). GeoNode further ensured accessibility at all levels of the user community, with web-based access from any device through direct export of GIS layers as a web map service (WMS) to other software like ArcGIS.
In order to facilitate agile development that would allow the underlying computational models to be efficiently
updated to improve performance and visualization in
2http://geonode.org/
3https://www.djangoproject.com/ 4https://www.osgeo.org/projects/geoserver/ 5https://www.osgeo.org/
GeoNode, the development team used Linux containers in a microservice architecture to allow for a self-contained execution environment with its own isolated CPU, memory, block I/O, and network resource. Containerization also allows “Infrastructure as Code” best practices, where provisioning of infrastructure (bare-metal servers) is accomplished through declarative, machine-readable definition files. This facilitates more efficient version tracking, testing and reproducible deployment. Docker6, a portable, multiplatform containerization
engine with declarative configuration files, was chosen as the deployment environment. Containers are orchestrated,
managed and deployed using Kubernetes7 with the Helm8
package management system to manage the Kubernetes infrastructure. Github was used for software version control and issue tracking during the development process. The core infrastructure deployment consists of a Kubernetes controller container, a geonode container9 that also contains
the SHP Tool user interface and customization, a geoserver container10, a PostGIS database container, and the Simulation
Queue server11. The SHP Tool computational models are
also deployed as containers on demand by the Simulation Queue server. Docker images are built from Dockerfiles contained in the respective Github repositories. SHP Tool
models are developed in Matlab12 and converted to C++
using the Matlab Coder13 product, facilitating rapid integration
of changes to computational models while still optimizing execution performance. Once model executables are built, they are integrated as part of a Docker Container environment with an interface bridge to accept JSON combined with
GeoJSON14 input and GeoJSON output files from the SHP
Tool’s user interface. The Simulation Queue server is extensible allowing other computational models to be added to the system at a later date.
The current NJcoast instance of GeoNode is cloud-hosted by Amazon Web Services (AWS), ensuring redundancy, particularly during a landfalling storm. All docker images are deployed to an AWS Elastic Container Services (ECS) image repository and “pulled” for deployment on both AWS and local developer
resources, with Amazon ECS for Kubernetes (Amazon EKS15)
directly providing the Kubernetes orchestration infrastructure.
STORM HAZARD PROJECTION TOOL
The Storm Hazard Projection (SHP) Tool, which simulates the wind field, storm surge and total run-up due to the combined effect of storm surge and waves driving water over land, is
6https://www.docker.com 7https://kubernetes.io/ 8https://helm.sh 9https://github.com/NJCoast/cyberspatial-ui 10https://github.com/NJCoast/GeoServerDocker 11https://github.com/NJCoast/SimulationQueue 12https://www.mathworks.com/ 13https://www.mathworks.com/products/matlab-coder.html 14https://tools.ietf.org/html/rfc7946 15https://aws.amazon.com/eks/
constructed as a Django Application using GeoNode for spatial data and user administration. By engaging the most up-to-date (and publicly available) information on topography, bathymetry and land use/land cover for the State of New Jersey, the SHP Tool estimates the site-specific hazard exposure for any locale in the state under any arbitrary hurricane scenario. This capability was extended for the wind fields and storm surge under extratropical storms (nor’easters), in response to the needs assessment in section “System Requirements.” The following sections detail the underlying models implemented for each hazard, with references as appropriate to the original publications for further details of validation and ground truthing previously conducted to ensure fitness for use. It is important to of course acknowledge the dynamism of coastal processes and development in coastal areas, which over time will change the topography, bathymetry and land use/land cover in the study zone. The following sections note the years in which the datasets used to develop each hazard model were generated; these underlying datasets are updated infrequently (on the order of every 5–10 years), and thus each of underlying hazard models will warrant revision when new data becomes available.
Wind Field
To maintain computational efficiency, wind fields are simulated using a highly efficient, linear analytical model for the boundary-layer winds of a moving hurricane, responsive to local typography (Snaiki and Wu, 2017a,b). This is accomplished by calculating the hurricane wind velocity as the summation of two components: the gradient wind in the free atmosphere and the frictional component near the ground surface, influenced by the surface roughness. While the gradient winds are straightforward to derive, the frictional component requires a scale analysis of the fully non-linear Navier-Stokes equations, solved through a systematic procedure with full consideration of the site-specific surface roughness defining the exposure in each New Jersey county. To do so, an effective roughness length (weighted average of the upwind terrain) is determined from the Land Use/Land Cover data reported by the state’s Bureau of GIS, which has a 10 km resolution, constraining the overall resolution of the wind field model. While the model is fully height-resolving and time-evolving, for a given hurricane scenario, the wind hazard is characterized by the maximum 10-min mean wind speed observed during the entire hurricane track. This is reported at the reference height of 10 m over a uniform grid (0.85-mile spacing) across the entire state, with wind speeds displayed to the nearest whole mile. The model’s accuracy was validated using wind records from past hurricanes, obtained from the NHC’s revised Atlantic hurricane database (HURDAT2: 1851–2017). An example validation against a previous North Atlantic Hurricane Bertha (1996) is provided in Figure 1, with additional validation results in Snaiki and Wu (2017a,b). Note that the model does not capture small-scale variabilities of the wind speed such as those related to rainbands or local intensifications and retains symmetry of the wind field with a single radius of maximum winds to maintain consistency with the hurricane parameters used in the surrogate model in section “Coastal Storm Surge.”
FIGURE 1 | Observed and simulated wind speeds in Hurricane Bertha (1996).
This approach was then adapted to enable a similar rapid simulation of the wind field in nor’easter events (Snaiki and Wu, 2019); a process that was complicated by the fact that (1) pressure parameterizations and track information are not readily available for extratropical storms in the North Atlantic Coastal Comprehensive Study (NACCS) (Nadal-Caraballo et al., 2015) used for the surrogate storm surge model, as discussed further in section “Coastal Storm Surge,” and (2) there are limited observational datasets for extratropical storms. Thus the relevant information must be extracted from reanalysis data, which is generated as a combination of numerical weather predictions and atmospheric observations based on data assimilation techniques. Tracks were identified from the European Centre for Medium-Range Weather Forecasts (ECMWF) Re-Analysis (ERA) Interim data (Dee et al., 2011), using the filtered 850 hPa relative vorticity with a temporal resolution of 6 h (Dacre et al., 2012). It was shown that the pressure contour for the nor’easters is not a circular-type shape, as would be expected from a hurricane system, but rather presents an elliptical shape. The asymmetric pressure field was characterized by a function of both the radial and azimuthal coordinates and was found to be dependent on two parameters: namely the azimuthally-dependent radius of maximum winds and shape factor. The scale-analysis-based reduced-order Navier-Stokes equations that govern the nor’easter wind field were then coupled with these 2D pressure profiles. Accordingly, the 3D boundary-layer wind field of a given nor’easter can be efficiently obtained based on the analytical, height-resolving wind model with the identified track (including standard storm parameters, i.e., central pressure, translational speed, approach angle, location of storm center, surface roughness). Using this approach, the boundary-layer winds were generated for six extratropical storms impacting New Jersey in January 1993, February 2001, January 2002, December 2003, January 2005, and February 2006, serving as the basis for its nor’easter model.
Coastal Storm Surge
The storm surge model underpinning the SHP tool builds on the surrogate modeling approach used in the aforementioned
CyberEye platform (Jia and Taflanidis, 2013;Jia et al., 2015). The foundation of the implementation is a simplified description of each hurricane scenario by a small number of model parameters corresponding to the characteristics at landfall: (i) landfall location; (ii) track heading; (iii) central pressure; (iv) forward speed; and (v) radius of maximum winds. The storm scenarios in the underlying reference database are then parameterized with respect to this model parameter vector and support the development of a Kriging metamodel predicting the storm surge over the entire coastal region of interest and possibly at different times during the hurricane history, if such data is available in the original database. Note that while this data was available for this application, time-evolution of storm surge is not visualized in NJcoast, presenting only the maximum hazard intensity to preserve a more conservative approach to emergency management. Given the high-dimensionality of the predicted output, principal component analysis (PCA) is employed to maintain computational efficiency (Jia and Taflanidis, 2013).
The reference database used to develop the surrogate model was the US Army Corps of Engineers (USACE) North Atlantic Coastal Comprehensive Study (Nadal-Caraballo et al., 2015). Available for download at the USACE Coastal Hazard System Coastal Hazards System (CHS) (Nadal-Caraballo et al., 2020)16,
the NACCS is a collection of over 1000 high-fidelity numerical simulations of hurricanes using the ADCIRC storm surge model (Luettich et al., 1992), coupled with STWAVE: Steady-State Spectral Wave model (Smith et al., 2001) to capture the additional effects of waves offshore. The tracks adopted for these simulations are a mixture of 1050 synthetic storms and 100 historical storms, which include the effect of 96 random tides and up to 1 m of sea level rise (SLR). This SLR value was selected by USACE to reflect likely scenarios for time-horizons in the range of 50–100 years (USACE, 2015). The inclusion of sea level rise and tides within the NACCS enables additional scenario options to be included in the development of the surrogate model outputs.
Combined tide effects are more challenging to accommodate in the surrogate model, since peak tides and peak surge vary spatially and temporally (Bernier and Thompson, 2007). Instead, the effect of typical and high tide ranges was determined by evaluating the statistics of the 96 tide scenarios in the NACCS and defining the median (termed as “Typical Tides” based on user preferences) and maximum (termed as “High Tides” based on user preferences) additive tidal effects for each location to yield the maximum water elevation (over the duration of each storm). The NACCS dataset reports storm surge at ∼3000 USACE-defined locations along the New Jersey coast (called “save points”). These save points are, on average, 200 m apart, with finer resolution in areas with complex topographies. Ultimately the different outputs for the surrogate model’s surge predictions at each save point correspond to: (i) peak surge for the baseline scenario (no tides and no sea level change) as well as additive surge for (ii) 1 m sea level rise, (iii) typical tides and (iv) high tides. Separate surrogate models were developed for each of these of these five cases for the bypassing and landfalling storms (Zhang et al., 2018). With respect to sea level rise outputs, a linear scaling of the 1-m benchmark sea level rise was then implemented to provide users with the ability to evaluate not just the 1-m scenario in the NACCS, but any arbitrary amount of sea level rise up to 4.5 feet, moderately extrapolating beyond the SLR value considered by the USACE.
The US Army Corps of Engineers went through an extensive process to validate and ground truth the simulations in the
NACCS (Nadal-Caraballo et al., 2015); a secondary quality
assurance process, conducted in consultation with the USACE, further reduced the 1050 tropical storms in the NACCS database down to 1031 tropical storms that would be used to calibrate the SHP Tool’s hurricane surrogate model (Zhang et al., 2018). Of these, 595 were landfalling tracks and 436 were bypassing tracks. For coastal save-points that were not inundated in some of the simulated synthetic storms (around 10% out of the 3000 locations), a modification described in Jia et al. (2015) was implemented to further enhance the database.
The output depth of storm surge above ground was then geospatially interpolated to 110,000 nearshore nodes at ∼120 m spacing and conservatively reported to the nearest tenth of a foot in the inundation maps. These were derived by comparing the projected storm surge height from the surrogate model to the elevation of the topography, with nodes whose elevation is below the estimated surge height classified as “inundated.” The depth of storm surge above the ground surface is then visualized as the differential between these elevations. This inundation map is displayed along the entire New Jersey coast at the aforementioned 120 m resolution.
The computational efficiency of the storm surge surrogate model readily enables the incorporation of a probabilistic analysis to address track uncertainties. Based on the time to landfall, a statistical dispersion is assumed for the hurricane parameters (track and intensity) following the recommendations in Resio et al. (2017), representing typical forecasting errors for hurricanes in the Atlantic over the past decade. Based on this dispersion, 500 perturbations (samples) of the input corresponding to the most probable NHC track are generated. The surge output for
each of these tracks is estimated through the surrogate model, utilizing the corresponding input sample. Statistical analysis of this output captures the impact of forecasting uncertainties, with “Probabilistic expected” designated as the median value and “Probabilistic extreme” at 10% probability of exceedance. The same approach, using the 500 most probable track perturbations, is adopted for quantifying uncertainties in the predicted wind field discussed previously in section “Wind Field” and wave run-up, discussed shortly in section “Wave Run-Up.”
The surrogate modeling approach was validated using leave-one-out cross validation (Kohavi, 1995), with a coefficient of determination close to 0.96 and correlation coefficient close to 98% (Zhang et al., 2018), while the overall validity of the simulation techniques used to generate the high-fidelity hurricane databases like NACCS has been previously established against measurements collected during Hurricanes Katrina, Ike, Gustav and Iniki (Kennedy et al., 2011, 2012) and more recently against hurricanes affecting New Jersey (Nadal-Caraballo et al., 2015).
By contrast, the USACE has not released any track information for the nor’easters used in the NACCS, so characteristics of these storms along their tracks were not available to inform the development of a corresponding nor’easter surrogate model. To maintain a similar input format as the hurricane surrogate model, the six nor’easter tracks developed for the wind field in section “Wind Field” were perturbed in terms of track and strength characteristics to create a total of 100 synthetic extratropical storms. Lacking a standard intensity measure like the Saffir-Simpson scale, three intensity levels were statistically defined: 1, low; 2, moderate; 3, high, corresponding to wind speeds with 60, 30 and 0.1% respective probabilities of being exceeded. The effect of tides and sea level rise on storms surge under nor’easters were then addressed by averaging the available results over the NACCS storms.
Wave Run-Up
In the development of the surrogate model in section “Coastal Storm Surge,” additional wave run-up simulations were conducted to capture the interaction of the waves with site-specific bathymetry/topography, along transects in all New Jersey coastal counties. To do so, a one-dimensional Boussinesq model (BOUSS-1D) was simulated at the pre-selected transects (Demirbilek et al., 2009). This provided a phase-resolving time series of runup over a 30-min period, with the largest runup selected as representative. The elevation profile along the transect was extracted from the Coastal Topographic Lidar, sourced from NOAA Office for Coastal Management [specifically the 2015 USGS CoNED Topobathy DEM: New Jersey and Delaware (1888–2014) dataset]. The dataset has a vertical accuracy of 20 centimeters tested to meet vertical root mean square error (RMSEz) in open terrain and a horizontal spatial resolution of 1 meter. This resulted in run up depth with accuracies estimated as better than 0.25 m for typical conditions. Note that the one-dimensional nature of the transects implies that strong focusing or defocusing could not be simulated.
Transect locations for the run-up simulations were selected by dividing the defined coastline into 1640 foot (0.5 km)
segments. Following this subdivision of the coastline, transects were constructed that extend approximately perpendicular to the coast. The transects extend 4921 feet (1.5 km) offshore and 3280 feet (1 km) onshore. Each transect is then subdivided into 32.9 foot (10 m) intervals to discretize the bathymetry/topography along its length. The driving point for each simulation was located 4101 feet (1.25 km) offshore along each transect. A nearest neighbor input was selected for peak wave period and zero moment wave height (from STWAVE) and water elevation (from ADCIRC) results in the NACCS database. At each interval along the length of the transect, the mean water elevation, max water elevation, max water depth, and significant wave height were computed and saved as outputs and incorporated into the hurricane surrogate model introduced in section “Coastal Storm Surge.” This ultimately facilitated the calibration of a separate surrogate model to provide wave run-up predictions along each of the considered transects. These outputs are then used to generate a second type of inundation map, specifically constructing two contours: one defining the Limit of Moderate Wave Action (LiMWA), noting the point along each transect
where the significant wave height first exceeds 1.5 feet (delineated the damaging wave zone), with a second contour establishing the extent of wave-driven inundation, or the point along the transect where the max water depth is zero relative to the topography, thus establishing the effective wet-dry boundary. This second class of inundation map is coarser than the storm surge inundation map discussed in section “Coastal Storm Surge,” with values calculated only at the transect locations along the New Jersey coast.
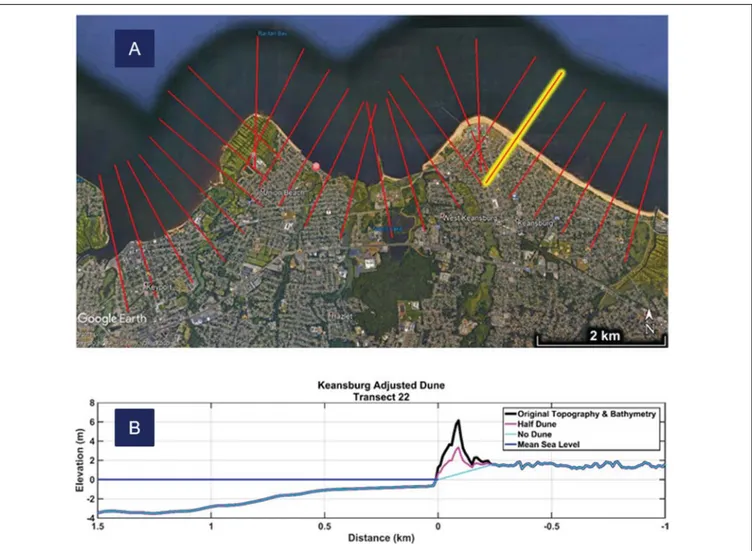
As the needs assessment revealed the importance of simulating losses of coastal protective features, these simulations were conducted not only the current dune elevations, but also for two deteriorated cases: degraded dunes where transect elevations were reduced by 50% and compromised dunes where the elevation of the dune was reduced to grade level to simulate a breach. Figure 2 illustrates a cross-sectional view of Transect 22 in the pilot community of Keansburg. Positive values are offshore, zero indicates the shoreline, and negative values indicate on-shore points along the transect. A lack of requisite information for nor’easters
FIGURE 2 | (A) Google Earth view of Keansburg transects with transect #22 highlighted in yellow. (B) Cross sectional view of transect #22 showing the profile of the original topography & bathymetry (current), degraded, and compromised profiles as an example of how these coastal protection scenarios were simulated.
in the NACCS limited the wave run-up modeling to only hurricane tracks.
DATA SERVICES
Beyond the capability to simulate site-specific coastal hazards at the parcel level, this project also sought to reduce the barriers to accessing GIS data among non-specialists traditionally not versed in geospatial data processing. As GIS data was previously fragmented across local, state and federal providers, one immediate benefit of the NJcoast platform was the integration of diverse sources of data central to managing coastal risk in one user-friendly dashboard environment. Based on the user stories in section “System Requirements,” identified data needs for each role were mapped to vetted data providers from state agencies and their local contractors, who each have processes for quality assurance, updating and long-term maintenance. Inevitably, geospatial data from different providers may have incompatibilities in adopted coordinate systems and reference datum, requiring care and additional processing when integrating them into a common platform. Further, as heterogeneous data can have wide ranging levels of quality, accuracy and resolution, it is equally critical that data sourced from such trusted providers be well-documented with relevant metadata exposed. Thus, NJcoast was designed to ensure users could access all metadata exposed by the provider so they can make an informed judgment regarding data’s suitability and reliability. The platform design also capitalized upon the more-user friendly metadata interfaces in Geonode so users could more seamlessly report on the quality and trustworthiness of third-party data within the NJcoast dashboard.
To further ensure NJcoast data would benefit from these ongoing data stewardship efforts by the original data providers, the platform took advantage of GeoServer’s high level of implementation of Open Geospatial Consortium (OGC) standards and services, using OGC WMS and web feature services (WFS) endpoints to link (not upload) data whenever possible, allowing the layers to automatically refresh as these existing curation processes continue to release improved versions of the data. This allows data to remain with its original provider where it can be maintained and continually updated without
additional burden on the municipal end user. Unfortunately, many of the GIS layers available through the New Jersey Geographic Information Network and the state’s OpenGIS platform are being exposed using the Environmental Systems Research Institute (ESRI) RESTful interface, requiring manual intervention to upload new releases of this data into NJcoast as they become available.
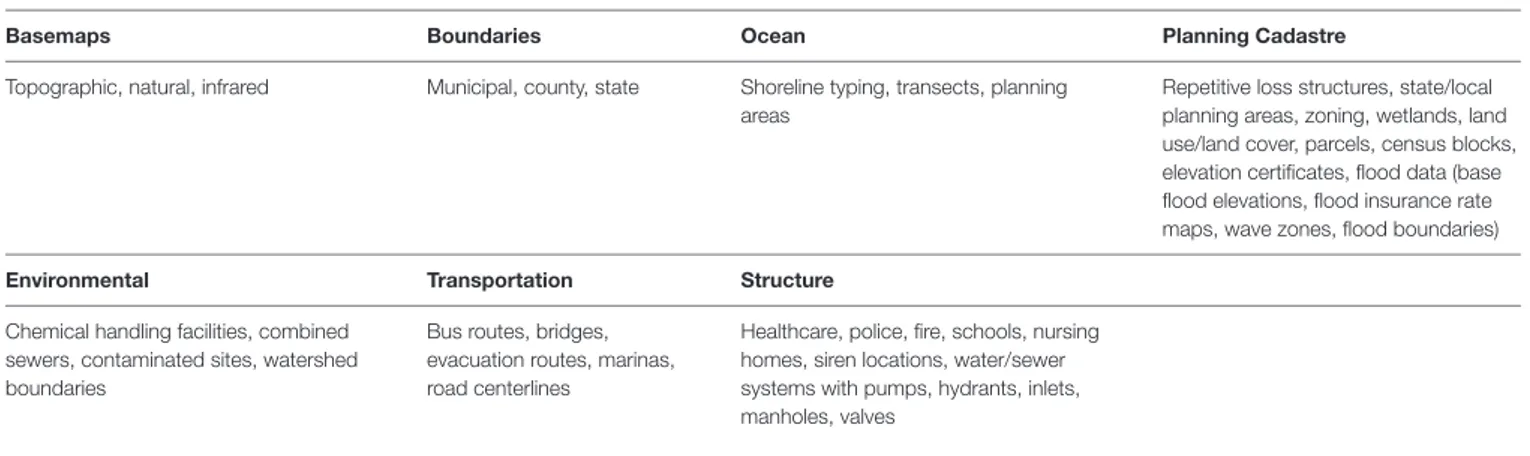
The GIS layers integrated into NJcoast were categorized according to Geographic Information Metadata Standards from the International Organization for Standardization (ISO 19115) and are queryable based on title, category, date and keyword.
Table 2 summarizes the data types encompassed by a typical
data catalog, grouped by ISO category, with corresponding user interfacing described in section “User Interfacing.”
USER INTERFACING
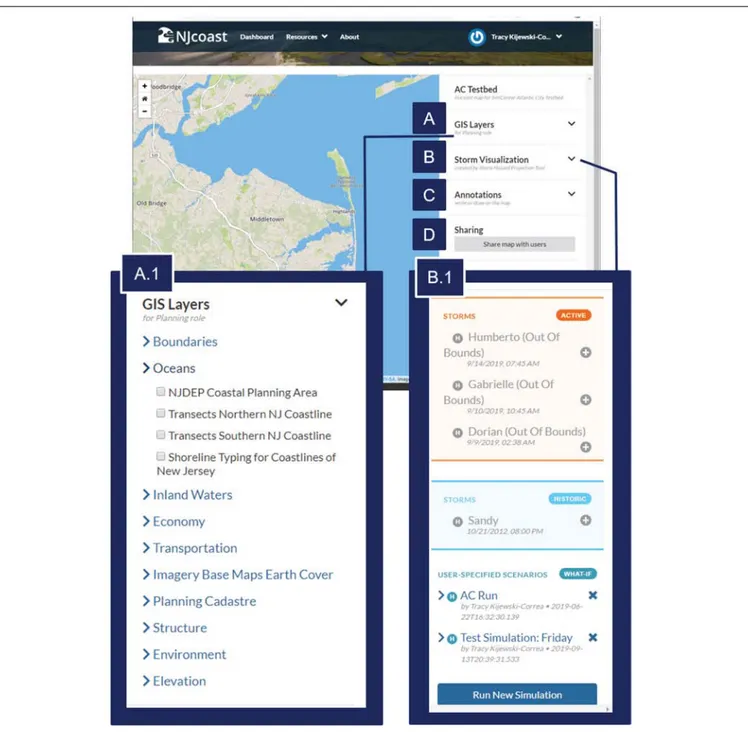
Based on the user stories and requirements, a suite of user interfaces was developed to enable non-specialists with little to no formal training in GIS to query, visualize, annotate and share geospatial data. The user’s Map view serves as the primary geospatial environment for interacting with role-managed GIS layers and outputs of the SHP Tool. As illustrated by Figure 3, the Map view menus are grouped under four main headings: (1) GIS Layers, which provides nested menus of pre-loaded, role-defined GIS layers, organized by ISO 19115 category (Figure 3A), (2)Storm Visualization, which groups any available cached Active Storm projections, pre-loaded Historic Storm results, and any new or savedUser-Specified Scenarios that the user has chosen to display on the map (Figure 3B), (3)Annotations, which enables access to tools for marking-up maps (Figure 3C), and (4)Sharing, which saves and disseminates user maps (Figure 3D).
For User-Specified Scenarios, the SHP Tool user interface
in Figure 4 prompts users for three types of inputs: the storm type (Figure 4A), the storm characteristics (Figure 4B) and optional scenario parameters (Figure 4C). Based on the selected storm type – hurricane or nor’easter (Figure 4A), the storm characteristics user interface automatically updates. In the case of hurricanes (Figure 4A.2), after inputting the landfall location, the users will access one of two tabs. The advanced tab (Figure 4B.2.2) requests the remaining four TABLE 2 | Typical GIS layers in NJcoast municipal data catalogs (grouped by ISO Category).
Basemaps Boundaries Ocean Planning Cadastre
Topographic, natural, infrared Municipal, county, state Shoreline typing, transects, planning areas
Repetitive loss structures, state/local planning areas, zoning, wetlands, land use/land cover, parcels, census blocks, elevation certificates, flood data (base flood elevations, flood insurance rate maps, wave zones, flood boundaries)
Environmental Transportation Structure
Chemical handling facilities, combined sewers, contaminated sites, watershed boundaries
Bus routes, bridges, evacuation routes, marinas, road centerlines
Healthcare, police, fire, schools, nursing homes, siren locations, water/sewer systems with pumps, hydrants, inlets, manholes, valves
FIGURE 3 | NJcoast Map View with four menus: (A) GIS layer, (B) Storm visualization, (C) Annotation, and (D) Sharing. Callout (A.1) shows an example of the ISO 19115 categories under the GIS layers menu and specifically the pre-loaded GIS layers displayed under the Oceans Category for a planner with no specific municipal affilition. Callout (B.1) shows an example of the three types of storm simulation results loaded into this user’s map: Active storms (screen capture was taken during the 2019 Hurricane season), Historic storms (Superstorm Sandy), and User-Specified Scenarios (two What-If scenarios uniquely named and saved by the user). Pressing “Run New Simulation” allows the user to add yet another What-If storm scenario to this map at any time.
parameters used in the surrogate model: heading (angle) and three additional parameters describing the hurricane’s intensity and translational speed (see section “Coastal Storm Surge”). As most users will not have the expertise necessary to specify these parameters, an alternative interface was created under the basic tab (Figure 4B.2.1) prompting users to select one of the five categories on the Saffir-Simpson scale. Through a statistical
analysis of the five surrogate model parameters for each category of storm in the NACCS database, a suite of 25 probable hurricane scenarios is identified for each category. These are analyzed by the SHP and the one producing the worst-case impacts is output for visualization. On the other hand, the selection of nor’easters as the storm type (Figure 4A.1) results in a similar simplified storm characteristics interface. Due to the lack of a convenient
FIGURE 4 | NJcoast SHP Tool interface requesting inputs for (A) Storm type, (B) Storm characteristics, and (C) Scenario parameters. Callout (A.1) shows how the selection of nor’easters updates the (B.1) storm characteristics and (C.1) scenario options accordingly. Callout (A.2) shows how the selection of Hurricanes result in two tabs for storm characteristics: (B2.1) a basic tab and (B2.2) an advanced tab, both accompanied by (C.2) updated scenario options.
parameterization, as well as the consistent heading of these extratropical storms, the nor’easter user interface (Figure 4B.1) requires only the specification of the intensity level 1–3 (as defined in section “Coastal Storm Surge”).
The SHP Tool also supports a range of scenario preferences (Figure 4C), which also update based on the selected storm type. For hurricanes (Figure 4C.2), these scenarios include exploring the effect of Sea Level Rise (variable heights – see section “Coastal Storm Surge”), Tides of “None”, “Typical” or “High” (defined as no, median and maximum tides – see section “Coastal
Storm Surge”), andCoastal Protection of “Current,” “Degraded” or “Compromised” (defined as 0, 50, and 100% dune loss – see section “Wave Run-Up”). Another scenario preference in Figure 4C.2 enables a probabilistic analysis considerate of the temporal variation in the cone of uncertainty in hurricane tracks prior to landfall. This is enabled by toggling from “Deterministic” Analysis Type to either “Probabilistic expected” or “Probabilistic extreme” (median or worst-case impacts as defined in section “Coastal Storm Surge”) to accordingly modify surge, total run-up and wind field results based on Monte Carlo results. For a
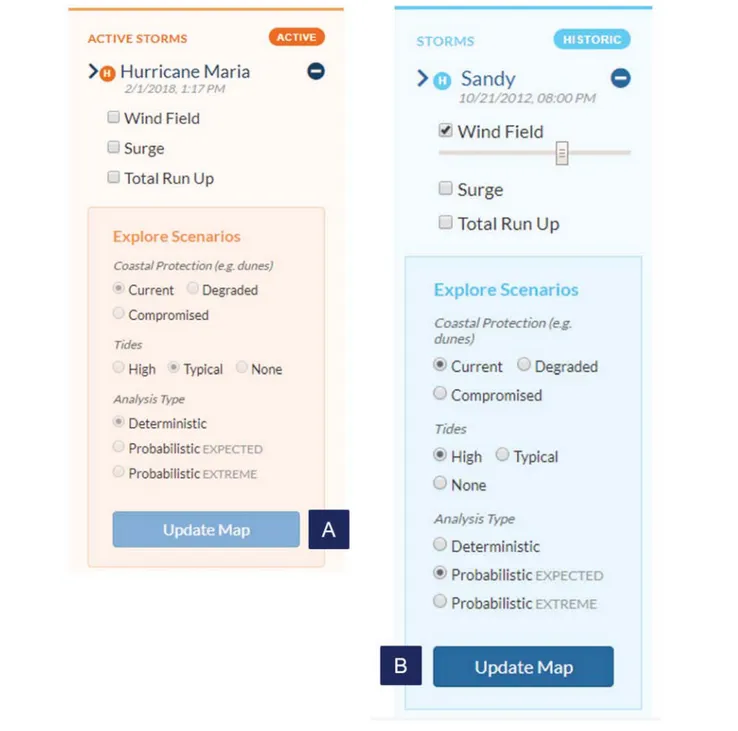
FIGURE 5 | Display option available when clicking on a preloaded Active Storm (A) or Historic Storm (B) Simulation result. Note in (B) that the selection of any hazard output activates a slider bar that can be used to adjust the transparency of the output layer on the map.
User-Specified Scenarios simulation, the choice of probabilistic Analysis Type requires inputting a “Time to Landfall” value (up to 96 hours). A subset of these scenario preferences are available for nor’easters (Figure 4C.1):Coastal Protection scenarios were not executed for nor’easters and, and since the approach adopted for defining nor’easter outputs already has an explicit treatment of uncertainty, additional probabilistic analyses are not offered in its scenario preferences (see Figure 4C.1). Note that the SHP Tool is automatically executed to generate Active Storm simulations
(refreshing results based on the latest NHC tracks for as long as the storm remains a threat for the state of New Jersey) and also was used to create the cached Historic Storm events pre-loaded into the user’s Map View (see Figure 3B.1), in both cases running the suite of all relevant scenario options. Users then have the option to select which of these pre-calculated scenarios and hazard outputs is displayed in their map view as illustrated in Figure 5, though inputs like “Time to Landfall” and “Seal Level Rise” are, respectively, no longer relevant (since that information
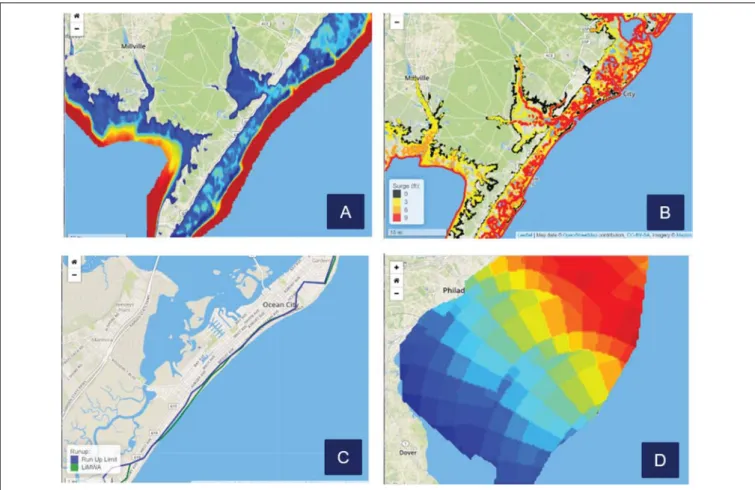
FIGURE 6 | NJcoast visualization options for SHP Tool outputs: (A) Storm surge heat map, (B) Storm surge contours, (C) Total run-up contours, and (D) Wind speed heat map.
was automatically extracted from NHC track information) or would not be applicable to a contemporary or historical event.
Given the specified inputs, the SHP Tool will then output windfields, storm surge depths, and total run-up. Since these vary spatially as well as temporally during the course of a given storm, the SHP Tool visualizes the maximum wind speed, storm surge and total run-up at each grid point, as a conservative projection of hazard exposure using the Leaflet17Javascript library. Storm
surge depth over land can be visualized using one of two options: at the regional scale, it may be preferable to select the color-gradient heat map (Figure 6A), while block- or parcel-level decision making may consider surge contours (Figure 6B): the storm surge depth associated with each contour (0, 3, 6, 9 feet) maintains consistency with maps developed in prior Floodplain Management Plans. Figure 7 illustrates how a user might view municipal GIS data against these storm surge contours, while engaging the annotation toolset (accessible under the menu in Figure 3C) to mark-up the map. To provide a similarly clean visualization at the parcel-level, geospatial interpolation between transects was used to define two total run-up contours: (1) the Limit of Moderate Wave Action (LiMWA), which defines the damaging wave zone expected to receive 1.5-foot or greater
17https://leafletjs.com/
breaking waves, and (2) the extent of wave run up establishing the effective wet-dry boundary (Figure 6C). Finally, wind fields are presented as a color-gradient heat map simulated over the entire state (Figure 6D). Transparency of the output layers can be adjusted through slider bars (see Figure 5B) so that other GIS layers are not obscured, particularly helpful for heatmaps of wind fields or storm surge.
REFLECTIONS ON PLATFORM
DEVELOPMENT AND TRANSITION
After designing the computational models and
cyberinfrastructure necessary to deliver the required capabilities, the authors led repeated rounds of beta-testing and refinement with end users in the state’s Department of Community Affairs (DCA), as well as the two pilot municipalities (Keansburg and Berkeley), in the second quarter of 2018. The platform went live at NJcoast.us in the third quarter of 2018, using the next year to enroll users and demonstrate the platform for various state agencies. Note that the state has taken a conservative approach to onboarding users as it assembles its long-term plans for platform development; currently 67 users are active in the system, which includes authorized users in the two pilot municipalities, state
FIGURE 7 | Example of map displaying storm surge contours against parcel data and locations of critical facilities, engaging the annotation toolset to add labeled polygons to the map.
officials, and officials in federal agencies like FEMA and USACE. Recognizing the need to eventually scale this effort to possibly dozens of municipalities along the New Jersey coast, self-guided training resources (handbooks, user manuals, and step-by-step
tutorials for specific use cases, accompanied by YouTube18
videos) were developed and curated on the NJcoast website. It is important to emphasize that by adopting a web-based platform with simplified interfacing comparable to staples like Google Maps, users did not have to learn any advanced GIS software to access municipal data and run high-fidelity storm simulations, making training requirements minimal. At the request of DCA, the lead author did conduct an on-site, half-day training in each of the pilot municipalities focused on three use stories: scenario planning, emergency management in advance of a landfalling hurricane, and use of GIS data for routine service delivery.
This experience revealed a range of municipal capacity (and aspirations) to consume, produce and maintain GIS data. At the municipal-scale, open data practices were still in their infancy; even for those whose GIS assets were developed and maintained by local consultants, enforcing consistent data standards and exposing quality metadata remained a challenge that may only be addressed by a statewide investment in data policies and capacity building. While the pilot municipalities were working
18https://www.youtube.com/watch?v=tYAfldUS_oM
to adopt more streamlined workflows, many records remained paper-based or had recently made the digital transition only to be siloed across different platforms. Thus, user interactions with NJcoast delivered a powerful impetus to more fully embrace digital modes of work using GIS data, well beyond the immediate application to coastal risk reduction. Unfortunately, the dynamism of coastal processes and the continued post-Sandy recovery could stifle this momentum as datasets and underlying models for platforms such as NJcoast become dated and dependent on further investments to update as new LiDAR, capital improvements, and beach replenishment projects unfold. If the state continues its commitment to maintain and periodically update quality open GIS data, some of this burden can be offloaded from municipalities. This benefit can be further multiplied if accompanied by a commitment to publishing WMS or WFS endpoints that can be more seamlessly integrated into platforms built on OGC standards, like NJcoast.
While there are many directions possible for further development of the simulation tools introduced in this paper, including the possibility to build climate change projection capabilities into the hazard simulations, the next directions of NJcoast are ultimately driven by the state’s priorities and resources. These are currently focused on: (1) building the capacity of the New Jersey Department of Community Affairs to fully administer the system and maintain this GeoNode
instance on AWS in coordination with other resilience initiatives, and (2) onboarding more municipalities (registering users and integrating data from local providers). The latter requires the state to conduct additional outreach and capacity building so these municipalities can better steward the critical local GIS data needed for integration within NJcoast.
CONCLUSION
Mitigation of losses due to coastal hazards has become an increasingly urgent and challenging problem in light of the continued escalation of US coastal population density. Coastal states like New Jersey, the application site for this study, have placed greater focus on risk mitigation against tropical and extratropical storms using toolsets appropriate for non-specialist practitioners. In response, this study developed and deployed a secure web-based environment called NJcoast19. The design of the
platform has encouraged greater use of the state’s considerable GIS data investments among municipal users, even those with limited to no proficiency in the consumption or production of GIS data. Perhaps more powerfully, the platform has supported better risk-informed decision making by giving municipalities access to the state-of-the-art simulation tools for site-specific coastal hazards in a manner that is approachable and reduces computational demands from hours in a cluster to minutes on a personal device. This was accomplished using a fast-to-compute linear analytical model for the boundary-layer winds of a moving hurricane coupled with a surrogate modeling approach for storm surge that leverages existing databases of simulations for synthetic hurricanes and historical nor’easters to provide a highly efficient emulator using a small number of model parameters. Coupling this with a one-dimensional Boussinesq model further captured the effects of wave run-up overland. These computational models were bundled into a single Storm Hazard Projection (SHP) Tool that allows users to simulate storm scenarios of their choosing with the same fidelity as the models used by Federal Emergency Management Agency (FEMA) and the US Army Corps of Engineers (USACE), while cutting the computational time by orders of magnitude. This approach allows efficient exploration of what-if scenarios such as the impact of tides, sea level rise, breach of dunes or uncertainties in the storm track. It further enables automated projection of wind, storm surge and total run-up associated with active hurricanes in the Atlantic Basin using the most recently published track information, guiding response and evacuation planning during landfalling storms. This was made possible through the adoption of GeoNode as NJcoast’s content management system, leveraging the Django web framework development platform and GeoServer for its geospatial services. GeoNode’s interactive map environment integrates SHP Tool outputs with a collation of geospatial data from federal, state and municipal providers to seamlessly visualize the interactions between these hazards and municipal assets.
19www.njcoast.us
NJcoast was recently deployed in the state of New Jersey, allowing users to securely access the platform to manage their customized dashboard, pre-populated with GIS layers appropriate to their roles as planners, emergency managers or first responders and their municipal affiliation. In the process of moving simulation capabilities closer to the non-specialists making critical decisions, the importance of engaging these end users early and continuously in the development process proved vital. These engagements further underscored the need to accommodate a range of municipal capacities to consume, produce and locally maintain GIS data, but also the potential for impact that is possible through a commitment to statewide capacity building and data standards. Conversely, the extensive effort required to include nor’easters in the SHP Tool further reiterates the importance of greater investment in the study and publishing of track data for extratropical storms. Ultimately, with its continued use and scale-up to municipalities across the state, NJcoast will be able to demonstrate how granular, high-fidelity simulation tools can better inform planning, emergency management, disaster response and service delivery.
DATA AVAILABILITY STATEMENT
The North Atlantic Coastal Comprehensive Study dataset used for the surrogate model is available at https://chs.erdc.dren.mil. The NJcoast website is available at www.njcoast.us and requires a request of credentials from the State of New Jersey, which are granted at their discretion. All statewide GIS data can be accessed at https://njogis-newjersey.opendata.arcgis.com/. All developed software and supporting documentation is curated in the GitHub organization NJcoast (https://github.com/njcoast).
AUTHOR CONTRIBUTIONS
TK-C was the principal investigator of the study, developing the overall platform concept and overseeing its development, additionally leading all engagements with the user community. AT was the risk assessment lead and led the development of the SHP Tool and surrogate model with JZ. CV was the cyberinfrastructure lead, directing the conceptualization and development of the GeoNode environment working with JS, the lead programmer on the developer team. TW developed the wind field model in collaboration with RS. AK supervised the run-up simulations executed by ZS. TK-C wrote the first draft of this manuscript, assembling written contributions from AT, CV, TW, and AK. All authors contributed to manuscript revision, read and approved the submitted version.
FUNDING
This work was funded under the Statewide and Regional Planning Assistance Grant Program under the New Jersey Department of Community Affairs (NJDCA), Office of Local