HAL Id: hal-01272765
https://hal.archives-ouvertes.fr/hal-01272765
Submitted on 26 Apr 2019
HAL is a multi-disciplinary open access
archive for the deposit and dissemination of
sci-entific research documents, whether they are
pub-lished or not. The documents may come from
teaching and research institutions in France or
abroad, or from public or private research centers.
L’archive ouverte pluridisciplinaire HAL, est
destinée au dépôt et à la diffusion de documents
scientifiques de niveau recherche, publiés ou non,
émanant des établissements d’enseignement et de
recherche français ou étrangers, des laboratoires
publics ou privés.
Interest of energy dispersive X-ray microanalysis to
characterize the surface composition of milk powder
particles
Ingrid Murrieta-Pazos, Laurence Galet, C. Rolland, J. Scher, C. Gaiani
To cite this version:
Ingrid Murrieta-Pazos, Laurence Galet, C. Rolland, J. Scher, C. Gaiani. Interest of energy dispersive
X-ray microanalysis to characterize the surface composition of milk powder particles. Colloids and
Surfaces B: Biointerfaces, Elsevier, 2013, 111, pp.242-251. �10.1016/j.colsurfb.2013.05.025�.
�hal-01272765�
Interest of energy dispersive X-ray microanalysis to characterize the
surface composition of milk powder particles
I. Murrieta-Pazos
a,b, L. Galet
b, C. Rolland
b, J. Scher
a, C. Gaiani
a,∗aUniversité de Lorraine, LIBio (Laboratoire d’Ingénierie des Biomolécules), 2 Avenue de la forêt de Haye, TSA 40602, 54518 Vandœuvre-lès-Nancy Cedex, France
bUniversité de Toulouse, Mines Albi, CNRS UMR 5302, Centre RAPSODEE, Campus Jarlard, 81013 Albi cedex 09, France
Keywords: Dairy powders
Energy dispersive X-ray technique Surface composition
Composition gradients
a b s t r a c t
Energy dispersive X-ray (EDX) is a technique rarely used for organic powders. Nevertheless, this tech-nique is of great interest in the characterization of milk particle surface. In order to validate the method, the EDX technique was tested on pure milk components, on model powders composed of different ratio of lactose/whey proteins and on whole milk powders presenting or not free fat at the surface. For all these powders, satisfactory results were obtained with correct experimental atomic percentages in com-parison with expected theoretical percentages. The technique was then applied to skimmed and whole milk powders sieved in 4 fractions. The surface and the core (cut particle) were analyzed by EDX and compared. A relationship between the particle size and the surface composition was observed. X-ray photoelectron spectroscopy (XPS) often used to characterize milk powder surface, however no differ-ences were observed between surface and core composition using this method. The depth of analysis by EDX is far more significant (1 !m) in comparison to that of the XPS (5 nm); hence it was concluded that the analysis of cut particle by EDX was not interesting since too close to the results obtained at the surface. Finally, the technique was coupled with XPS and successful hypothesis concerning composition gradients were done.
1. Introduction
Milk powders are produced by spray drying milk from a feed to contain uniformly distributed components. Nevertheless, it has been demonstrated by various authors[1–6]that these compo-nents were redistributed during the droplet formation process. The resulting particles present an heterogeneity between the surface and the core. In addition, the surface/core heterogene-ity may be accentuated by packaging, storage and/or transport conditions[7–9]. In turn, it is now generally well accepted that the particle surface composition has a strong impact on powder functional properties (reconstitution properties [10], stickiness
[5], flowability[11], floodability, oxidation[12]. . .). As the food powder production increases new and innovative methodologies are required to understand the behaviour of these powders regard-ing their functional properties. For this, a growregard-ing number of
Abbreviations: EDX, energy dispersive X-ray; ESEM, environmental scanning electron microscopy; NMC, native micellar casein; NWI, native whey isolate; SEM, scanning electron microscopy; SMP, skim milk powder; WMP, whole milk powder; XPS, X-ray photoelectron spectroscopy.
∗ Corresponding author. Tel.: +33 3 83 59 58 78; fax: +33 3 83 59 58 04. E-mail address:claire.gaiani@univ-lorraine.fr(C. Gaiani).
interesting methods allowing the surface characterization of milk powders has been used recently or are under development[13].
During the two last decades, the most used technique to char-acterize the surface of dairy powders was the X-ray photoelectron spectroscopy (XPS). XPS provides elemental (atomic percentages) and chemical (binding percentages) information for the first 5–10 nanometres below the particle surface[1,3,5,8,14–18]. From the atomic values, the determination of the principal components percentages (protein, lactose and lipids) present at the powder surface can be done with the help of a matrix formula[1,2,14]. Another classical approach was also possible with the development of scanning electron microscopy (SEM). Investigations performed by SEM may indeed present some disadvantages as: information about components is difficult to obtain (if not used in conjunction with EDX). In addition, samples have to be coated with a conductive material (creation of artefacts). By SEM, different surface content in lactose, lipids and/or proteins were related to differences in surface topography. For example the powders were more or less shrivelled, smooth. . .[19]. Nevertheless, quantitative information is impossible to obtain in this way. Surface investigations were also possible by solvent extraction, but these techniques were only produced interesting results for powders containing fat[12]. EDX is another powerful technique allowing an elemental analysis of the surface (as well as XPS). This technique, contrary to XPS, allows
the surface characterization at a deeper level from the first micron to the five first microns. In addition, EDX allows a very localized characterization in the particle whereas the area of XPS analysis is larger (300 × 700 !m)[20]. Recently, environmental scanning elec-tron microscopy (ESEM) images were combined with EDX analysis. The environmental mode allows examination of the specimen without the necessity to coat and then eliminates the inteference of sample coating during chemical analysis. The EDX analysis system works as an integrated feature of an ESEM equipment and cannot operate on its own. Its characterization capabilities are due in large part to the fundamental principle that each element has a unique atomic structure allowing X-rays to be identified uniquely from one another. An EDX spectrum is a plot of how frequently an X-ray is received for each energy level. The higher a peak in a spectrum, the more concentrated the element is in the sample. In the field of food powders, EDX was rarely used[3,13,21]. Only few authors used this technique to investigate the chemical composition of dairy powders[3]. Even if this technique seems to be very promising, these first results need in depth validation.
For this purpose, industrial skim and whole milk powders were used. In addition, pure milk components were purchased to vali-date the methodology. The aim of this paper is to test a recent and innovative technique called EDX and to see if this technique can be used to characterize the surface or the composition gradient of dairy powders.
2. Materials and methods
2.1. Materials
Two industrial milk powders obtained from Lactalis (Laval, France) were studied. Proteins and lactose content were deter-mined by Kjeldahl method and enzymatic kit (Enzytec Lactose/d-Galactose, Diffchamb SARL, Lyon, France) respectively. Fat content was determined with a Röse-Gottlieb extraction and ashes were measured after incineration at 550◦C (from the American Dry
Prod-uct Institute, 2002). Moisture content was determined by weight loss after drying 1 g of powder at 103◦C for 5 h (from the American
Dry Product Institute, 2002).
The following compositions (% w/w) were measured respec-tively for skim milk powder (SMP): water (3.8), proteins (37.1), lactose (52.0), lipids (1.4) and ashes (5.7) and whole milk powder (WMP): water (3.9), proteins (26.2), lactose (36.7), lipids (27.3) and ashes (5.9).
For method validation, powders containing pure components were used. To study milk proteins, native micellar casein (NMC) and native whey isolate (NWI) powders were used. NMC powder was obtained from International Dairy Ingredient (IDI, Arras, France). This industrial powder (Promilk 872B) is obtained by microfiltra-tion from milk and presents a high percentage of native micellar casein (more than 88% w/w). NWI powder (Prolacta 90) was pro-vided by Lactalis (Laval, France) and present more than 90% wt/wt whey. Monohydrated lactose was purchased from VWR-Prolabo (Fontenay sous Bois, France) and Anhydrous Milk Fat (AMF) was obtained by centrifugation of melted butter.
2.2. Whole milk powder without free fat
The free fat was defined as the fat that was not entirely coated and stabilized by surface-active elements or a matrix containing proteins and lactose[12]. The free fat is located both at the surface and in inner parts of a powder particle surface. The free fat was extracted[22]with some adaptations. Petroleum ether was added to 10 g of powder in a 1:5 (p:p) proportion. After mixing for a period of 5 min at 300 rpm, the solvent was eliminated by filtration. After 5
extractions, the powder was dried under fume cupboard and ready for further analysis.
2.3. Particle sieving
Between 10 and 20 g of powders were sieved in a Retsh sie-ving device (Retsch GmbH AS200 digit, Haan, Germany). The siesie-ving duration was 20 min at a power of 60 in the machine scale. Pow-ders corresponding to different sizes were obtained by using sieves corresponding to 40, 80, 125 and 160 microns.
2.4. X-ray photoelectron spectroscopy
XPS is a quantitative spectroscopic technique that measures the elemental composition up to 5 nm depth. It provides elemental and chemical state data in solid samples. XPS is performed in an ultra-high vacuum (10−8kPa) which may limit the technique in the food
industry and specifically for liquids. Nevertheless, it is not an incon-venient in the case of food powders. The use of XPS was extended for the last 20 years to the surface composition of dairy powders. From the C, O and N percentages, the contents in protein, lactose and fat at the surface were calculated with a matrix formula already used in a great number of studies[1,2,7,14,15,23].
The XPS analyses were carried out with a Kratos Axis Ultra (Kratos Analytical, Manchester, UK) photoelectron spectrometer. The instrument uses a monochromatic Al K" X-ray source. The powder samples were attached to the sample holder with a double side conductive tape. The analyzed area was about 700 × 300 !m. Spectra were analyzed using the Vision software from Kratos (Vision 2.2.0). Quantification was performed using the photoemi-ssion cross-sections and the transmiphotoemi-ssion coefficients given in the Vision package.
2.5. Energy dispersive X-ray analysis
2.5.1. EDX equipment
Powder samples were characterized with an EDX analyzer cou-pled to a ESEM XL30 (Philips) microscope instrument operating at 20 kV and equipped with an EDAX EDX detector with an atmo-spheric thin window and a link analytical system. An average elemental composition of the samples was obtained by a data col-lection at 3 different !m2sized windows (5 !m2) on the powder
surface. Samples analyzed by this technique were not metallized EDX is a technique coupled with ESEM to enable the analysis of the atomic composition of the sample. It works in a depth of approx-imately 1 !m of EDX for the determination of the surface content in lactose, protein and lipids
The application of the technique to dairy powder has been adapted from XPS data treatment[1,2,5,23–25]. Here, the relative atomic concentration of carbon, oxygen and nitrogen at the surface (∼5 !m) of the powder was quantified and used in a matrix formula to calculate the relative surface content P, L and F in proteins (P), lactose (L) and fat (F).
IC= ˛P.ICP+ ˛’L.ICL+ ˛′′F.ICF (1)
IO
= ˛P.IOP+ ˛’L.IOL+ ˛′′F.IOF (2) IN= ˛P.INP+ ˛’L.INL+ ˛′′F.INF (3)
where IC, IO, INare the mole fractions of carbon, oxygen and
nitro-gen in the sample surface, obtained from the areas of the C 1s, O 1s and N 1s EDX peaks.
ICP, ICL, ICFare the percentages of carbon in proteins, lactose and
fat; IOP, IOL, IOFare the percentages of oxygen in proteins, lactose
and fat and INP, INL, INFare the percentages of nitrogen in proteins,
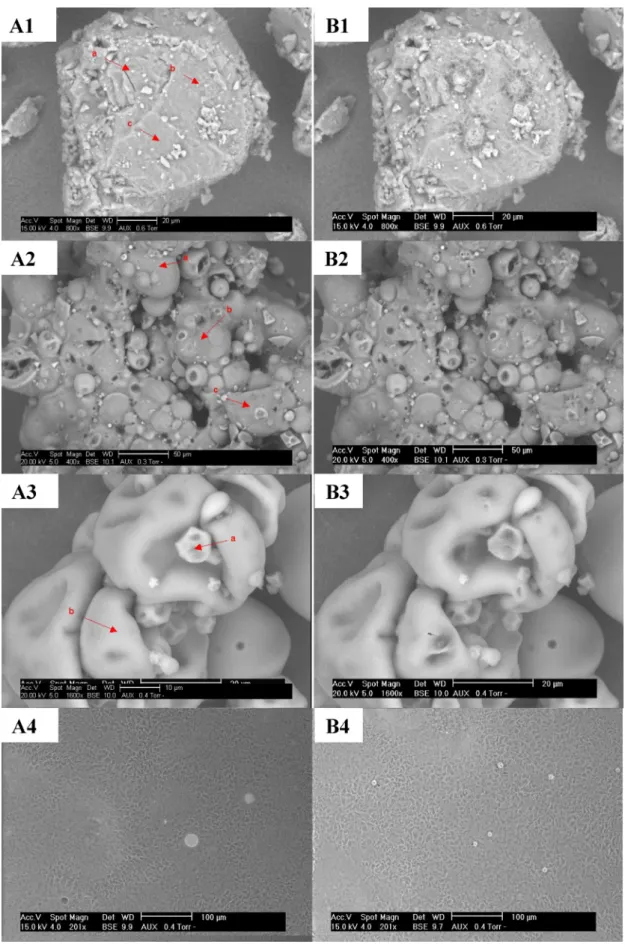
Fig. 1. Scanning electron micrographs (×200) of reference pure components: native whey isolate powder (A), native micellar casein powder (B), alpha-lactose powder (C) and anhydrous milk fat (D), and of commercial powder: whole milk powder (E) and skim milk powder (F).
Experimental values obtained from the reference samples (casein, whey proteins, anhydrous milk fat and monohydrated lac-tose) are estimated and used to carry out these calculations. By solving the matrix, (!P), (!’L), (!”F), respectively the proteins, lactose and fat surface contents are determined.
3. Results and discussion
3.1. Powders characterization by ESEM-EDX
3.1.1. Pure milk components
The structure of NWI (Fig. 1A) and NMC (Fig. 1B) powders observed by ESEM are typical of spray dried powders. More or less agglomerated powders were observed for NWI whereas individual almost spherical structures can be appreciated for NMC powders. The largest size of agglomerated NWI particles (around 100 !m) compared to NMC particles (around 50 !m) which are in agreement
with the values found by static light scattering (data not shown). On NWI powders, a higher heterogeneity in particle size in comparison with NMC powders was noticed. All the particles present a smooth surface and the presence of dents was observed. Typical structures (less spherical and more irregular) were observed for lactose par-ticles with the presence of small crystals at surface (Fig. 1C). In the case of AMF (Fig. 1D), a drop of molten fat was placed on the sup-port. As the temperature in the ESEM chamber was near to 5◦C, a
solid film was formed. No additional specific details were observed. For lactose, three points (red arrows) were analyzed on the same particle and are represented before and after analysis (Fig. 2A1–B1). After analysis, local degradation of the lactose can be observed. These degradations are representative of the fragility of the lactose structure and may also cause problems during the analysis. Indeed, the EDX analysis is sensitive to the angle of anal-ysis with respect to the detector. Such penetration of the electron beam in the particle could prevent a good spread of X-rays to the
Fig. 2. Scanning electron micrographs before (A) and after (B) EDX analysis of lactose monohydrated powder (×800) (1), native whey isolate powder (×400) (2), native micellar casein powder (×1600) (3) and anhydrous milk fat (×200) (4).
Table 1
Atomic composition (%) of the reference powders analyzed by EDX in 3 points (represented by a, b and c inFig. 2) for NWI, Lactose and AMF and in 2 points for NMC.
Powder Atomic composition (%) Points of analyze Average S.D.
a b c
Native whey isolate powder C 74.37 77.96 75.67 76.0 1.9 N 11.80 10.35 12.58 11.6 1.1 O 11.17 9.06 10.12 10.1 1.1 P 0.30 0.30 0.20 0.3 0.1 S 1.37 1.45 0.96 1.3 0.3 K 0.52 0.43 0.25 0.4 0.1 Ca 0.47 0.45 0.22 0.4 0.1 Lactose powder C 80.71 81.75 81.22 81.2 0.5 O 19.29 18.25 18.78 18.8 0.5
Native micellar casein powder C 75.15 75.15 – 75.1 0.0 N 9.41 9.52 – 9.5 0.1 O 10.67 10.74 – 10.7 0.1 P 1.45 1.23 – 1.3 0.2 S 0.70 0.71 – 0.7 0.3 K 0.24 0.28 – 0.3 0.0 Ca 2.38 2.37 – 2.4 0.0
Anhydrous milk fat C 94.58 94.91 94.96 94.9 0.3
O 5.42 5.09 5.04 5.1 0.3
detector. The particle shape can be also a parameter of influence. Ideally, the sample should be analyzed as a tablet, to get a flat and not-hilly surface to permit an ideal angle of response. However, the aim of this work was to study the surface of the particles, as such, the powder should be directly placed in the support. The results of the three points analyzed are shown inTable 1. For lactose, which is a carbohydrate molecule, only carbon and oxygen were found as expected. This is a classical composition of carbohydrate. By consequence, these analyses may confirm the efficacy of the EDX technique to detect the elements that actually make up organic particles. Nevertheless, when looking to the carbon value for lactose, an overestimation was immediately observed. However, the atomic concentration ratios (C: 79.2 and O: 20.0) were not in agreement with the expected stoichiometric values (C: 50 and O: 50). This overestimation of carbon is common when using X-ray techniques[26,27]. The C peak intensity was more important and may be due to carbon contaminant and impurities collected from the atmosphere during the sample transfer into the EDX chamber or during product manufacturing. Nevertheless, the standard deviation does not vary significantly. This means that there is a good reproducibility of the results for a given particle.
The points of analyzes performed on the NWI particles are pre-sented before and after analysis (Fig. 2A2–B2). In contradiction with the lactose powder, no degradation of the material occurred. The structure of NWI seemed to be more resistant than the lactose one and was not affected by the X-ray beam. This resistance can help to reduce variations in the results and also enable multiple analyses on one single particle. InTable 1, the atomic concentrations obtained at the surface of NWI powder are presented. In addition to C and O elements, the presence of nitrogen (expected as NWI is a protein powder) and minerals are detected. In milk powders, proteins are the only molecules that can have nitrogen element in their compo-sition. Consequently, the N percentage is directly proportional the protein percentage in the powder surface. Sulfur is the most abun-dant mineral in NWI[28]. As expected, the atomic concentration in NWI did not vary significantly; this confirms a more resistant material which allows a better reproducibility of the analysis (in comparison with lactose).
For NMC powders,Fig. 2A3–B3 shows respectively the localiza-tion of 2 points of analysis before and after analysis. The dot a was performed on a small particle close to a bigger one (dot b). After the analysis, it can be observed again that there was no degradation of the material constituting these proteins. In this protein, carbon,
oxygen and nitrogen are again observed but the quantity of min-eral was higher as micellar casein is known to be rich in calcium and phosphorus in comparison with NWI[28]. The standard deviation was minimal; by consequence the reproducibility of the analysis for this sample was very good (Table 1).
Finally, the analysis was also performed on the AMF (Fig. 2A4–B4). The state of this component is not a particle but a thin film. It can be clearly observed that degradation is caused by the analysis. This effect was fully expected; as the texture was very soft due to a melting point around 40◦C which makes it very fragile.
Consequently, it can easily change its stat to become liquid. How-ever, a good reproducibility in the analysis was achieved (Table 1). It can be also appreciated that only carbon and oxygen are detected in the analysis with a very high atomic concentration of carbon. These results correspond to the theoretical atomic composition of AMF.
3.1.2. Industrial milk powders
Fig. 1E and F show the general structural aspect of WMP and SMP respectively. The powders analyzed were both characterized by heterogeneous particles. Usually a smooth surface is appreciated in WMP mainly due to surface covered by free fat[12]. On the other hand, a more rigid and wrinkled surface is observed for SMP mainly due to the presence of a lactose-protein matrix and less surface fat. These appearances were characteristic and were already widely observed by others[1,2,4] and also by the authors on the same powders[29].
3.1.3. Variation of analysis (by particle and by day)
The EDX analysis is not typically used in organic samples like dairy powders. Up to now, it was not really clear if different parti-cles could have different atomic elements at the surface. In order to interpret the results correctly, it was very important to obtain a good repeatability. Consequently, measures at the surface of different particles and measures realized on different days were performed (Table 2). The variations from one day to another can be explained by the pollution in the microscope chamber. This may occur if some samples with high carbon content were prior ana-lyzed; further analysis may be altered. Averages of more than 10 analyses on different particles on more than 4 different days were performed for each pure milk component as presented. The influ-ence of the particle on the reproducibility was correct for NMC, NWI and AMF (a S.D. maximum of 2.8 for the Oxygen). Only the results
Table 2
EDX average data the same day on different particles and on the same particle during different days for lactose powders, native whey isolate powders (NWI), native micellar casein powders (NMC) and anhydrous milk fat (AMF).
Atomic concentration for various pure components (%)
Lactose NWI NMC AMF
Average on different particles (more than 10) C 74.0 ± 7.3 72.4 ± 2.2 73.5 ± 1.5 94.9 ± 0.3 O 20.6 ± 3.1 12.8 ± 2.8 12.2 ± 1.2 5.1 ± 0.3 N – 13.8 ± 1.4 10.7 ± 1.0 – P – 0.2 ± 0.1 1.2 ± 0.1 – S – 0.8 ± 0.3 0.5 ± 0.1 – K – 0.2 ± 0.1 0.2 ± 0.1 – Ca – 0.2 ± 0.1 1.7 ± 0.5 – Average on different days (4 days) C 77.9 ± 2.7 73.0 ± 2.7 73.5 ± 1.5 93.9 ± 1.4 O 22.1 ± 2.7 13.4 ± 1.8 10.7 ± 0.7 6.1 ± 1.4 N – 12.3 ± 1.9 12.2 ± 1.4 – P – 0.2 ± 0.1 1.2 ± 0.1 – S – 0.9 ± 0.3 0.5 ± 0.1 – K – 0.3 ± 0.1 0.2 ± 0.0 – Ca – 0.3 ± 0.1 1.7 ± 0.4 –
for lactose presented higher deviation. Concerning the day of anal-ysis, the repeatability was very good whatever the pure component analyzed.
3.2. Analysis of pure milk components powders
3.2.1. Determination of experimental values on pure milk components
Experimental EDX values obtained after analysis of at least 13 points on pure milk components are presented inTable 3. It can be observed that values for carbon were systematically overestimated in comparison with theoretical values. Consequently, the nitrogen and oxygen were underestimated. Nevertheless, this carbon over-estimation is well known for X-ray techniques like XPS[1,2,27]. Lactose values are particularly far from the theoretical ones in com-parison with proteins and AMF. As seen inFig. 2, lactose was also the only sample presenting degradation after analysis. This could explain higher chamber pollution by carbon atoms. This is why it is necessary to integrate the experimental values of each pure component in the equation system, to take into account the error associated to each pure component.
Experimental values of the same pure components obtained by XPS and EDX present also some differences (Table 3). Usually, XPS values are closer to the theoretical ones than EDX. This could be
explained by less precision of the EDX analysis and a carbon pollu-tion affecting the analysis.
3.2.2. Analysis of binary mixtures
To corroborate values obtained by EDX, it was necessary to test known mixes and to compare the obtained results with their real composition. Binary mixtures of lactose and whey proteins were prepared and analyzed by EDX under a pellet form after freeze dry-ing of the solutions. As the area of analysis is small (5 !m2), the
sample must be homogeneous enough at that scale. The choice of lactose and whey proteins was done for this reason, as these compounds are soluble in water and can produce quite good homo-geneous solutions. The aspect of the three pellets were observed by ESEM and were quite similar whatever the concentration. The surface seems to also be homogeneous (images not shown). The composition of the surface components was obtained from the equations system (1, 2 and 3) fed by the atomic percentages. The three equations system considers three atoms (O, C and N) and three families of molecules (sugar, protein and lipid). This is the reason why two types of results were presented inTable 4. If three elements are calculated (lactose, proteins and lipids) by the use of the three equations (presented in Section2), it can be observed that lactose is systematically underestimated and fat is present (whereas AMF was not added in these mixes). Two explanations
Table 3
Theoretical and experimental values for XPS and EDX measures on pure milk components.
Theoretical values for the atomic composition (%)
Experimental values for the atomic composition obtained fromTable 1(%)
EDX XPS
C O N C O N C O N
Lactose 50 50 0 79.2 20.8 0.0 62.7 37.3 0.0
Caseins 65 19 16 76.0 12.8 11.2 69.8 16.3 13.9
Whey proteins 65 19 16 73.3 12.8 13.9 68.0 18.0 14.0
Total milk proteinsa 65 19 16 75.5 12.8 11.7 – – –
Anhydrous milk fat 89.1 10.9 0 93.8 6.2 0.0 87.0 12.3 0.7 aCalculated by taking into account 17% whey proteins and 83% casein.
Table 4
Composition of binary mixtures calculated from the equation system (Eqs.(1)–(3)).
Equation Ratio Lactose/Protein 70/30 50/50 30/70
Eqs.(1)–(3) Lactose 62 ± 6 40 ± 6 13 ± 5
Protein 34 ± 3 54 ± 2 74 ± 5
AMF 4 ± 3 6 ± 5 13 ± 3
Eq.(3)only Lactose 67 ± 4 46 ± 1 28 ± 5
Table 5
Core and surface composition determined by EDX on different size fractions (0–40; 40–80, 80–125 and 125–160 !m) of skim milk and whole milk powders.
Skim milk powder Whole milk powder
Surface composition (%) Core composition (%) Surface composition (%) Core composition (%)
1 2 3 4 Mean ± SD 1 2 3 4 Mean ± SD 1 2 3 4 Mean ± SD 1 2 3 4 Mean ± SD Particle size 0–40 !m Lactose 30 24 14 18 22 ± 5 23 40 23 8 23 ± 8 21 30 26 16 24 ± 4 29 28 11 17 21 ± 7 Proteins 78 80 81 70 77 ± 3 53 49 45 79 57 ± 2 29 29 24 33 29 ± 2 23 25 56 45 38 ± 13 AMF −9 −6 1 7 −2 ± 5 19 0 22 11 13 ± 8 50 39 47 48 46 ± 3 45 44 30 35 39 ± 6 Minerals 1 2 4 5 3 ± 1 6 10 11 2 7 ± 2 0 2 3 3 2 ± 1 2 2 3 3 3 ± 0 Particle size 40–80 !m Lactose 33 37 33 35 34 ± 2 5 36 22 17 20 ± 8 28 21 15 18 21 ± 4 28 21 15 18 21 ± 4 Proteins 81 53 61 60 64 ± 8 71 50 74 80 69 ± 9 30 61 66 41 49 ± 14 30 61 66 41 49 ± 14 AMF −17 6 1 2 −2 ± 7 23 7 2 −2 7 ± 7 39 14 19 37 27 ± 10 39 14 19 37 27 ± 10 Minerals 3 5 5 3 4 ± 1 1 7 2 5 4 ± 2 3 3 1 4 3 ± 1 3 3 1 4 3 ± 1 Particle size 80–125 !m Lactose 32 30 24 18 26 ± 5 40 23 39 37 34 ± 5 33 33 28 25 29 ± 4 33 33 28 25 29 ± 4 Proteins 54 54 65 54 57 ± 4 54 62 46 50 53 ± 5 23 23 36 49 33 ± 10 23 23 36 49 33 ± 10 AMF 10 10 7 22 12 ± 5 2 9 9 8 7 ± 2 41 41 31 22 34 ± 7 41 41 31 22 34 ± 7 Minerals 4 6 4 4 4 ± 1 4 6 5 5 5 ± 1 4 4 6 4 4 ± 1 4 4 6 4 4 ± 1 Particle size 125–160 !m Lactose 28 44 24 18 28 ± 7 23 33 28 11 24 ± 6 46 49 13 19 32 ± 15 46 49 13 19 32 ± 15 Proteins 59 53 65 54 58 ± 4 62 49 47 70 57 ± 9 31 37 60 40 42 ± 9 31 37 60 40 42 ± 9 AMF 10 −1 7 22 10 ± 6 9 12 19 15 14 ± 2 19 11 24 35 22 ± 7 19 11 24 35 22 ± 7 Minerals 3 4 4 6 4 ± 1 6 5 6 4 5 ± 1 4 4 3 5 4 ± 1 4 4 3 5 4 ± 1
are possible for these results. First, the overestimation of fat and the underestimation of polysaccharide are inherent to this tech-nique as already observed with the XPS techtech-nique[1,2]. Second, NWI powder contains residual lipids due to the methods of pro-duction[15]. These residual lipids may be located at the surface of the tablets and artificially increase the fat percentage. The reality could be between these two hypotheses. If only equation 3, corre-sponding to nitrogen, was used a correct prediction is done for the 3 mixtures (70/30, 50/50 and 30/70).
In order to go further, three components mixture containing fat were produced. However, homogeneous pellets were impossible to obtain with AMF (data not shown). The analysis was sometimes located on a zone containing a lactose/protein matrix and some-times on a fatty zone making the analysis non reproducible.
3.3. Application of the technique to the surface and core composition of milk powders
3.3.1. Skim milk powder
After validation of the EDX methodology, this technique was used to analyze the surface and core of SMP. In order to do so, industrial SMP were sieved in five different fractions. The objective of this size classification was to keep a standard depth of anal-ysis. As it was already mentioned, the analysis works in a depth of 1–5 microns approximately. Hence the particle diameter could influence the results of the analysis. From the literature[3], it is already known that a milk particles’ surface is formed by a thin fat layer, then a skin rich in protein and finally a lactose-protein matrix including some fat globules. However the thickness of these layers is unknown. The layers could have different thick-ness according to the particles size; consequently a classification by size was necessary.
Details of some repetition for different sieved fractions are pre-sented inTable 5. For all the sizes observed, differences between surface and core are not significant. For example, there was no sig-nificant increase in the amount of lactose at the core, however XPS analyses confirmed the presence of more lactose in the core
[1,17,30]. Still by XPS an opposite localization for fat is also sys-tematically observed, but not here. The explanation may be that the surface analysis by EDX was much deeper than the surface analysis
by XPS; hence the surface analysis by EDX may be equivalent to the core analysis by EDX or very close in atomic percentages. Con-cerning the effect of particle size, no clear tendency was observed between small and large particles.
3.3.2. Whole milk powder
Some representative examples of atomic composition at the sur-face and core of sieved particles are shown inTable 5. Again no differences were observed between the surface and the core. With this technique, the depth of analysis is around 1–5 !m and not 5 nm like for the XPS methods. So, the strong overrepresentation of lipids at the surface of WMP observed by others may be linked to the thickness of fat. One hypothesis may be that the fat at the powder surface is thin enough to be detected by XPS but a mean was done by EDX with other components.
For SMP, a heterogeneity was observed in the distribution of the components in the particle. For example, the quantity of lipids increases in comparison with SMP. This indicates that the method is sensible to variation in lipids content. But aberrant values are also found. As it was previously explained it can be caused by a zone of analysis containing only one or two components (lactose/protein). Over 10 analyses were performed by size on a large number within the particle to obtain an accurate mean.
Contrary to SMP, significant differences are observed with the particle size. Whatever the localization of analysis (surface or core) the fat percentage decreased with increasing size and increasing lactose percentage.
3.3.3. Analysis of defatted powder
After the analysis of SMP and WMP, it was necessary to corrob-orate the sensibility of the analysis to fat in the sample. As it was already mentioned, productions of mixtures with three compo-nents were not performed due to non homogeneity in the pellet. As an alternative, the WMP was treated in order to change its lipid sur-face composition. An extraction of the sursur-face fat was done[3,12]
and permitted to establish the sensibility of the method for fat. WMP without free fat and sieved between 80–125 !m and 125–160 !m were analyzed and an example of the zones measured are shown onTable 6. The surface compositions calculated from the atomic percentages are given again. As expected, the fat content
Table 6
Surface composition measured by EDX of whole milk powder before and after free fat extraction.
Before free fat extraction After free fat extraction
1 2 3 4 Mean ± SD 1 2 3 4 5 6 Mean ± SD Particle size 80–125 !m Lactose 36 38 44 42 40 ± 3 46 38 36 41 39 46 42 ± 4 Proteins 29 26 27 32 28 ± 2 42 30 39 41 29 41 37 ± 5 AMF 32 33 26 23 28 ± 4 8 27 20 15 28 8 17 ± 8 Minerals 3 4 4 4 3 ± 0 5 4 4 4 5 5 4 ± 1 Particle size 125–160 !m Lactose 45 56 36 39 44 ± 6 46 38 36 45 46 46 42 ± 4 Proteins 27 33 44 40 36 ± 5 36 44 41 39 45 42 41 ± 6 AMF 24 9 16 17 16 ± 4 17 9 17 6 6 5 9 ± 9 Minerals 3 3 4 5 4 ± 1 4 5 5 3 3 3 4 ± 1
ESEM image obtained during analysis
decreases significantly while proteins and lactose increased. This is a very important point to validate the method, because even if lipids are generally overestimated; the trends observed are valuable. 3.3.4. Interest of the technique for milk powder
Different results when analysing the core of particles were expected as the core of milk powders presents a complex struc-ture with a lactose-protein matrix and more or less lipid deposits. In addition, results for the surface composition were expected to be more reproducible and it was not the case. One explanation may be that surface measurements by EDX are deeper than XPS. And finally, by EDX, measures done in the core (by cutting the parti-cles) may be very close to measures done at the surface. It is very important to take into account that most of the EDX analyses are performed at a theoretical 1–5 !m from the surface. This depth is important for a milk particle and depending on the zone analyzed
very different results may be obtained. In addition, if the sample is fragile (a lot of lactose) a structure degradation may occurred due to the electron beam.
3.4. Interest of coupling XPS and EDX for the determination of milk powder gradient composition
3.4.1. Objectives
The methodology presented before in this work permits charac-terization of the surface and the core of the milk powders by EDX. But it could be interesting to couple this methodology to another technique: XPS. As the depth and the area of analysis are totally different, coupling these two techniques may allow a better knowl-edge of the composition gradient.
Table 7detailed the atomic and component percentages for WMP and SMP. The surface was determined by XPS (5–10 nm) and
Table 7
Gradients in whole and skim milk powders by coupling XPS (surface depth around 5 nm), EDX on raw particles (surface depth around 1 !m) and EDX on cut particles (core).
Whole milk powder Skim milk powder
Surface Core
Before free fat extraction After free fat extraction Surface Core
XPS EDX XPS EDX EDX XPS EDX EDX
Atomic composition (%) C 87.4 ± 1.8 78.6 ± 1.9 77.1 ± 1.1 77.1 ± 1.7 77.8 ± 4.2 65.1 ± 0.5 73.6 ± 2.2 73.7 ± 3.0 O 11.6 ± 1.2 13.6 ± 1.5 19.9 ± 0.6 14.5 ± 0.8 13.5 ± 2.7 26.5 ± 0.3 13.9 ± 1.9 13.5 ± 2.1 N 1.0 ± 0.6 4.5 ± 1.9 2.9 ± 0.2 4.3 ± 0.6 5.2 ± 2.1 7.2 ± 0.1 7.8 ± 2.2 6.9 ± 1.6 K – 0.3 ± 0.1 0.2 ± 0.0 0.3 ± 0.0 0.3 ± 0.1 0.5 ± 0.4 0.45 ± 0.7 0.4 ± 0.1 Ca – 0.1 ± 0.0 0.1 ± 0.0 0.3 ± 0.4 0.1 ± 0.1 0.2 ± 0.0 0.2 ± 0.0 0.2 ± 0.1 Cl – 0.6 ± 0.2 – 0.9 ± 0.1 0.6 ± 0.2 0.2 ± 0.2 1.0 ± 0.4 1.1 ± 0.5 S – 0.2 ± 0.1 – 0.3 ± 0.0 0.3 ± 0.1 0.1 ± 0.0 0.4 ± 0.1 0.4 ± 0.2 P – 0.8 ± 0.2 – 0.7 ± 0.1 0.6 ± 0.2 0.1 ± 0.0 0.7 ± 0.3 1.0 ± 0.5 Na – 0.6 ± 0.2 – 1.0 ± 0.0 1.0 ± 0.5 – 1.2 ± 0.6 1.6 ± 0.9 Mg – 0.2 ± 0.0 – 0.8 ± 0.0 0.8 ± 0.5 – 0.9 ± 0.4 1.3 ± 0.7 Component composition (%) Lactose −3.2 ± 2.5 36.1 ± 14.1 24.7 ± 1.0 41.7 ± 3.8 31.7 ± 13.2 42.2 ± 1.1 28.2 ± 16.2 27.5 ± 16.5 Proteins 2.2 ± 2.7 32.6 ± 13.4 18.8 ± 1.5 38.3 ± 4.9 36.9 ± 11.0 54.0 ± 1.5 64.3 ± 21.2 57.8 ± 18.2 AMF 101.0 ± 1.7 29.4 ± 12.9 56.4 ± 0.7 17.5 ± 7.9 28.5 ± 14.1 2.7 ± 0.8 4.5 ± 17.8 7.5 ± 23.7 Minerals – 3.3 ± 0.7 0.3 ± 0.0 4.3 ± 0.6 3.7 ± 1.3 1.1 ± 0.7 4.9 ± 2.5 6.0 ± 3.0
EDX (1–5 !m). The core was determined only by EDX by cutting one particle. In order to obtain more information, results for WMP without free fat were also added (surface by XPS and EDX; core by EDX).
To obtain the values of EDX an average of all the analysis was done (mean for different particles and different sieves). For XPS, these results are the mean of three independent experiments. 3.4.2. Gradients for skim milk powders
By observing the atomic percentages, the mineral gradients are remarkable. A significant increase of mineral percentage was observed from the surface (XPS), to the narrow surface (EDX) and finally the core (EDX cut particle). The C, O and N elements were not interpreted directly; as no interesting information can be obtain from these values. When C, O and N percentages are inserted in the matrices formula, the percentage in lactose, proteins and lipids is calculated. The lactose gradient was also evident with a decrease from the surface (42%) to the narrow surface (28%) and the core (27%). Fat was more important in the core in comparison with the surface and no real tendency was observed for proteins.
3.4.3. Gradients for whole milk powders
Again a clear trend appears for minerals in WMP. At the surface (XPS), minerals were not detected. At the narrow surface (EDX), minerals appeared in small quantities. After free fat removing, few minerals (K, Ca) were present at the surface of the powder (XPS). Finally, when cutting the particle and further analysing by EDX some mineral appeared in higher quantity: Mg, Na. This mineral distribution corresponds with the abundance of each element in milk. Potassium and calcium are the most abundant and conse-quently the first to be detected; and so on. The surface (XPS) was totally covered by lipids. When the analysis was done at the narrow surface (EDX), less fat (29%) and more lactose (36%) and proteins (32%) appeared. In the core (after cutting the particle), the same percentages were observed. This means that the core composition and the narrow surface contain the same elements at the same proportions.
The free fat extraction was interesting and gave us more infor-mation. The surface by XPS of the deffated particle was different in comparison with the raw particle. As expected less fat, more lactose and proteins were observed. When the analysis was done by EDX (narrow surface), the tendency was the same but the percentages were closer to the core composition with less fat.
4. Conclusion
The ESEM-EDX technique is a good choice to study the structure of milk powders as images can be easily obtained without vacuum and labelling. In addition, it is possible to focalize the analysis on a zone of interest thanks to the microscope (fat globule, crystallized lactose. . .). Coupling the EDX and XPS technique seems to be also very interesting and promising for SMP and WMP. More powders will be analyzed in the future to see if it is possible to generalize to all dairy powders. Indeed, information on the surface gradients was obtained and the components repartition was coherent with expected results and literature.
Nevertheless, the EDX technique presents some problems of repeatability. But these problems are inherent to the technique as the zones analyzed are very small and as the depth of analysis is important. Consequently, depending on the localization of the analysis zone different results may appear. However, by analyzing a great number of particles at different locations; it is possible to optimize this repeatability.
Acknowledgments
ANR funding from programme “Reactive Powder” are grate-fully thanks. In addition, first author thanks CONACYT as well as SEP scholarships in Mexico for financial resources. LCPME labo-ratory (Laboratoire de Chimie Physique et de Microbiologie pour l’Environnement, Nancy) is thanks for performing XPS analyses. The authors appreciated the work of Adetoke D. Ogunsanya in the correction of the English in the manuscript.
References
[1]C. Gaiani, J.J. Ehrhardt, J. Scher, J. Hardy, S. Desobry, S. Banon, Surface com-position of dairy powders observed by X-ray photoelectron spectroscopy and effects on their rehydration properties, Colloids Surf., B 49 (2006) 71–78.
[2]E.H.J. Kim, X.D. Chen, D. Pearce, Surface characterization of four industrial spray-dried dairy powders in relation to chemical composition, structure and wetting property, Colloids Surf., B 26 (2002) 197–212.
[3]I. Murrieta-Pazos, C. Gaiani, L. Galet, J. Scher, Composition gradient from surface to core in dairy powders: agglomeration effect, Food Hydrocolloids 26 (2012) 149–158.
[4]J.J. Nijdam, T.A.G. Langrish, The effect of surface composition on the functional properties of milk powders, J. Food Eng. 77 (2006) 919–925.
[5]A.K. Shrestha, T. Howes, B.P. Adhikari, B.J. Wood, B.R. Bhandari, Effect of protein concentration on the surface composition, water sorption and glass transi-tion temperature of spray-dried skim milk powders, Food Chem. 104 (2007) 1436–1444.
[6]S. Kentish, M. Davidson, H. Hassan, C. Bloore, Milk skin formation during drying, Chem. Eng. Sci. 60 (2005) 635–646.
[7]C. Gaiani, P. Schuck, J. Scher, J.J. Ehrhardt, E. Arab-Tehrany, M. Jacquot, S. Banon, Native phosphocaseinate powder during storage: lipids released onto the sur-face, J. Food Eng. 94 (2009) 130–134.
[8]E.H.J. Kim, X.D. Chen, D. Pearce, Surface composition of industrial spray-dried milk powders. 3. Changes in the surface composition during long-term storage, J. Food Eng. 94 (2009) 182–191.
[9]J.J. Fitzpatrick, M. Hodnett, M. Twomey, P.S.M. Cerqueira, J. O‘Flynn, Y.H. Roos, Glass transition and the flowability and caking of powders containing amor-phous lactose, Powder Technol. 178 (2007) 119–128.
[10]L. Forny, A. Marabi, S. Palzer, Wetting, disintegration and dissolution of agglom-erated water soluble powders, Powder Technol. 206 (2011) 72–78.
[11]E.H.J. Kim, D.C. Xiao, D. Pearce, Effect of surface composition on the flowa-bility of industrial spray-dried dairy powders, Colloids Surf., B 46 (2005) 182–187.
[12]M.L. Vignolles, R. Jeantet, C. Lopez, P. Schuck, Free fat, surface fat and dairy powders: interactions between process and product. A review, Lait 87 (2007) 187–236.
[13]I. Murrieta-Pazos, C. Gaiani, L. Galet, R. Calvet, B. Cuq, J. Scher, Food pow-ders: surface and form characterization revisited, J. Food Eng. 112 (2012) 1–21.
[14]P. Faldt, B. Bergenstahl, G. Carlsson, The surface coverage of fat on food powders analyzed by ESCA (electron spectroscopy for chemical analysis), Food Struct. 12 (1993) 225–234.
[15]C. Gaiani, M. Morand, C. Sanchez, E.A. Tehrany, M. Jacquot, P. Schuck, R. Jeantet, J. Scher, How surface composition of high milk proteins powders is influenced by spray-drying temperature, Colloids Surf., B 75 (2010) 377–384.
[16]E.H.J. Kim, X.D. Chen, D. Pearce, Surface composition of industrial spray-dried milk powders. 1. Development of surface composition during manufacture, J. Food Eng. 94 (2009) 163–168.
[17]E.H.J. Kim, X.D. Chen, D. Pearce, Surface composition of industrial spray-dried milk powders. 2. Effects of spray drying conditions on the surface composition, J. Food Eng. 94 (2009) 169–181.
[18]A. Millqvist-Fureby, Characterisation of spray-dried emulsions with mixed fat phases, Colloids Surf., B 31 (2003) 65–79.
[19]V.V. Mistry, H.N. Hassan, D.J. Robison, D.J. McMahon, D.N. Holcomb, V.R. Har-walkar, Effect of lactose and protein on the microstructure of dried milk, Food Struct. 11 (1992) 73–82.
[20]D. Briggs, M.S. Seah, Practical surface analysis, Auger X-ray Photoelectron Spec-trosc. 1 (1994) 657.
[21]A. Laskin, J.P. Cowin, Automated single-particle SEM/EDX analysis of submicrometer particles down to 0.1 !m, Anal. Chem. 73 (2001) 1023–1029.
[22]E.H.J. Kim, X.D. Chen, D. Pearce, Melting characteristics of fat present on the surface of industrial spray-dried dairy powders, Colloids Surf., B 42 (2005) 1–8.
[23]M. Jayasundera, B. Adhikari, P. Aldred, A. Ghandi, Surface modification of spray dried food and emulsion powders with surface-active proteins: a review, J. Food Eng. 93 (2009) 266–277.
[24]P. Faldt, B. Bergenstahl, The surface composition of spray-dried protein-lactose powders, Colloids Surf., A 90 (1994) 183–190.
[25]P. Faldt, B. Bergenstahl, Spray-dried whey protein/lactose/soybean oil emul-sions. 2. Redispersability, wettability and particle structure, Food Hydrocolloids 10 (1996) 431–439.
[26]P.A. Gerin, P.B. Dengis, P.G. Rouxhet, Performance of XPS analysis of model biochemical compounds, J. Chim. Phys. Phys. Chim. Biol. 92 (1995) 1043–1065.
[27]P.G. Rouxhet, M.J. Genet, XPS analysis of bio-organic systems, Surf. Interface Anal. 43 (2011) 1453–1470.
[28]C. Gaiani, M. Mullet, E. Arab-Tehrany, M. Jacquot, C. Perroud, A. Renard, J. Scher, Milk proteins differentiation and competitive adsorption during spray-drying, Food Hydrocolloids 25 (2011) 983–990.
[29]I. Murrieta-Pazos, C. Gaiani, L. Galet, B. Cuq, S. Desobry, J. Scher, Comparative study of particle structure evolution during water sorption: skim and whole milk powders, Colloids Surf., B 87 (2011) 1–10.
[30]P. Faldt, B. Bergenstahl, Spray-dried whey protein/lactose/soybean oil emul-sions. 1. Surface composition and particle structure, Food Hydrocolloids 10 (1996) 421–429.