HAL Id: hal-02353893
https://hal.archives-ouvertes.fr/hal-02353893
Submitted on 7 Nov 2019
HAL is a multi-disciplinary open access
archive for the deposit and dissemination of
sci-entific research documents, whether they are
pub-lished or not. The documents may come from
teaching and research institutions in France or
abroad, or from public or private research centers.
L’archive ouverte pluridisciplinaire HAL, est
destinée au dépôt et à la diffusion de documents
scientifiques de niveau recherche, publiés ou non,
émanant des établissements d’enseignement et de
recherche français ou étrangers, des laboratoires
publics ou privés.
Towards a Reliable Machine Learning Based Global
Misbehavior Detection in C-ITS: Model Evaluation
Approach
Issam Mahmoudi, Joseph Kamel, Ines Ben-Jemaa, Arnaud Kaiser, Pascal
Urien
To cite this version:
Issam Mahmoudi, Joseph Kamel, Ines Ben-Jemaa, Arnaud Kaiser, Pascal Urien. Towards a Reliable
Machine Learning Based Global Misbehavior Detection in C-ITS: Model Evaluation Approach.
Inter-national Workshop on Vehicular Adhoc Networks for Smart Cities (IWVSC’2019), Nov 2019, Paris,
France. �hal-02353893�
Global Misbehavior Detection in C–ITS: Model
Evaluation Approach
?Issam Mahmoudi1,2, Joseph Kamel1,3, Ines Ben-Jemaa1, Arnaud Kaiser1, and
Pascal Urien3
1 Institut de recherche technologique (IRT) SystemX, 91120 Palaiseau, France
{issam.mahmoudi,joseph.kamel,ines.ben-jemaa,arnaud.kaiser}@irt-systemx.fr
2 Paris Descartes University, 75006 Paris, France
3 T´el´ecom ParisTech, 75013 Paris, France
{joseph.kamel,pascal.urien}@telecom-paristech.fr
Abstract. Global misbehavior detection in Cooperative Intelligent Trans-port Systems (C–ITS) is carried out by a central entity named Misbe-havior Authority (MA). The detection is based on local misbeMisbe-havior detection information sent by Vehicle’s On–Board Units (OBUs) and by Road–Side Units (RSUs) called Misbehavior Reports (MBRs) to the MA. By analyzing these Misbehavior Reports (MBRs), the MA is able to compute various misbehavior detection information. In this work, we propose and evaluate different Machine Learning (ML) based solutions for the internal detection process of the MA. We show through exten-sive simulation and several detection metrics the ability of solutions to precisely identify different misbehavior types.
Keywords: Misbehavior Detection, Machine Learning, C–ITS
1
Introduction
Cooperative Intelligent Transport Systems (C–ITS) is a mature technology that aims at improving road safety, traffic efficiency and users comfort. This technol-ogy relies on the exchange of information between moving Intelligent Transport Systems (ITS) Station (ITS–S) (vehicles, trucks, motorbike, bicycle, etc.) and fixed ones (Road–Side Units (RSUs)). ITS–S periodically broadcast kinematic information (geographical position, speed, heading, etc.) to advertise their neigh-bors. These information are then used by safety applications embedded in each ITS–S to detect and avoid potentially dangerous situations. The C–ITS technol-ogy is standardized by the European Telecommunications Standards Institute (ETSI) in Europe and by the IEEE in the US.
?This research work has been carried out in the framework of the Technological
Re-search Institute SystemX, and therefore granted with public funds within the scope of the French Program Investissements d’avenir
Securing communications between vehicles and the infrastructure (also called Vehicle–to–Everything (V2X) communications) is thus of paramount impor-tance. The C–ITS community worldwide agreed to use a Public Key Infrastruc-ture (PKI) to perform this task. Basically speaking, the PKI provides unique digital certificates to ITS–S. ITS–S then use these certificates to digitally sign their V2X messages in order to guarantee authentication, integrity and non-repudiation. ITS–S also frequently change the certificate they are using in order to avoid potential tracking which may lead to break driver’s privacy [18].
The PKI is a solution that protects C–ITS against external attacks. However C–ITS still remains vulnerable against internal attacks. It is indeed possible for a malicious ITS–S that is authenticated at the PKI to deliberately send false information in its V2X messages in order to disrupt the system. MisBehavior Detection (MBD) is a promising technology that aims at monitoring the C–ITS in order to detect potentially misbehaving ITS–S. Basically speaking, the MBD process can be divided into the following three steps:
1. Local detection: detection at the ITS–S level of potentially misbehaving ITS–S in the neighborhood
2. Reporting: reporting the detected misbehaving ITS–S to the Misbehavior Authority (MA) localized in the Cloud
3. Global detection: decision-making at the MA level: is the reported ITS–S actually misbehaving or not?
In this paper, we focus our work at the MA level. The objective of the MA is to classify the reported ITS–S as: (1) misbehaving (and what kind of attack it does), (2) faulty (e.g. the MA has a broken sensor), (3) genuine (false positive). We believe that the MA will benefit from using Artificial Intelligence (AI) solutions such as Machine Learning (ML) to perform this task. In this work, our goal is to evaluate different ML approaches for the MA. To this end, we implemented the complete MBD process in an extension of VEINS simulator [3]. Our results show that the use of ML enables the MA to precisely classify the reported ITS–S and identify the different types of misbehavior.
The remainder of the paper is as follows. Section 2 presents the state of the art of ML based approaches used for MBD. Section 3 presents the C-ITS general architecture and details the misbehavior detection concept. Then, section 4 presents our evaluations and discuss the obtained results. Finally, section 5 concludes this work and gives some future work.
2
Related Work
In this section, we give a brief overview of machine learning based techniques used for MBD in the context of C–ITS.
Grover et al. [7] propose a machine learning based approach to detect mis-behavior in VANETs. For this purpose, the authors experiment with different classifiers implemented in WEKA toolset including Naive Bayes, Instance based learner (IBK), Decision Tree (J-48), Random Forest (RF) and AdaBoost. They
conduct a comprehensive comparison and show that RF and J-48 classifiers per-form best. In a subsequent paper [6], the authors improve the detection perfor-mance by replacing the single classification algorithm with several classification algorithms. They aggregate, through a majority voting ensemble-based scheme, the results of previously mentioned classifiers into a single stronger classifier. They show that the ensemble-based model is more robust and efficient in clas-sifying multiple misbehaviors present in VANETs and could achieve a better result in comparison to each individual base learner.
Ghaleb et al. [5] train a feed forward neural network to detect misbehavior in a C–ITS system. The authors create features from the data model as well as historical values of several plausibility and consistency checks. In total, the network takes 7 features as input. The training and performance evaluation is done using a relatively small real-world traffic dataset called NGSIM. They show that the proposed solution could generalize better than some baseline models.
So et al. [21] propose a machine learning based framework to detect and classify location spoofing. Their model is based on 6 plausibility checks as a feature vector. They build two machine learning models: k-nearest neighbors (k-NN) and support vector machine (SVM). The training and data evaluation are done on using VeReMi dataset [9]. They show that they can improve the overall detection precision of the plausibility checks used in the feature vectors by over 20%, while maintaining a recall within 5% of that of the plausibility checks.
Gyawali and al. [8] propose a ML based scheme to detect two categories of attacks: false alert attack and position falsification attack. The false alert mes-sages are generated using the Veins simulator. The position falsification mesmes-sages are extracted from the VeReMi dataset. They train multiple machine learning models including Logistic Regression, k-NN, Decision Tree and Random Forest. They claim that the proposed scheme is more effective to detect internal attacks as compared to the one proposed in VeReMi.
So et al. [20] propose 3 novel physical-layer plausibility checks. They use ma-chine learning models to evaluate their proposed checks. They test these models on the VeReMi dataset. They show that these checks outperform recently pro-posed machine learning based schemes operating at the application-layer.
Note that the studies cited in this section operate at the local level of the C– ITS misbehavior detection process. We believe that a global detection could yield better results and still not studied well in the context of C–ITS. In this work, we focus on machine learning based solutions for the global detection process done at the MA level.
3
System Model
3.1 C–ITS General Architecture
The vehicular network is based on a set of On–Board Units (OBUs) and RSUs that periodically broadcast V2X safety messages. Each message contains several kinematic information such as the position, the velocity, the heading. This in-formation is generally provided by the vehicle’s internal sensors. To send and
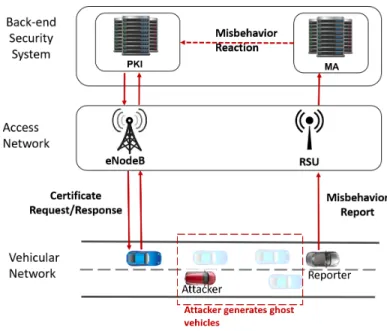
Fig. 1. C–ITS security architecture
receive safety messages the vehicle needs to acquire digital certificates. These certificates are requested from the PKI through the IEEE 802.11p or the cellu-lar technologies. Upon reception of a valid request, the PKI delivers one long term and several short term certificates. The short term certificates are often re-ferred to as pseudonym certificates. Vehicles frequently change their pseudonym certificates to avoid tracking and protect their privacy. These certificates are used by each transmitting vehicle to sign its messages. Figure 1 illustrates the C–ITS security architecture and the data flows sent between the security enti-ties. The signature allows receiving vehicles to authenticate the sender and to verify the integrity of the transmitted data. Authenticating vehicles is simply verifying that their certificate is valid. Whereas the integrity test consists on verifying through the message signature if data is altered by a malicious entity. However, a malicious vehicle with a valid certificate and a valid data sig-nature, may send intentionally bogus information. Additionally, vehicles may experience sensors defect. In this situation, the sent information would be erro-neous as well. This type of malicious behavior, which targets the data semantics, or shortly misbehavior, is managed by the MA. The MA is also localized in the back-end security system. The MA receives misbehavior alerts, called misbe-havior reports from vehicles which contain data about a potential misbehaving vehicles. It proceeds then to an internal analysis and processing of the received data. Finally, once it obtains the MBD results of the data processing, it sends a report to the entity which is in charge of the misbehavior reaction. In figure 1, we suppose that the entity which is in charge of the misbehavior reaction is the PKI. The whole process of MBD is detailed in section 3.2.
3.2 Misbehavior Detection Overview
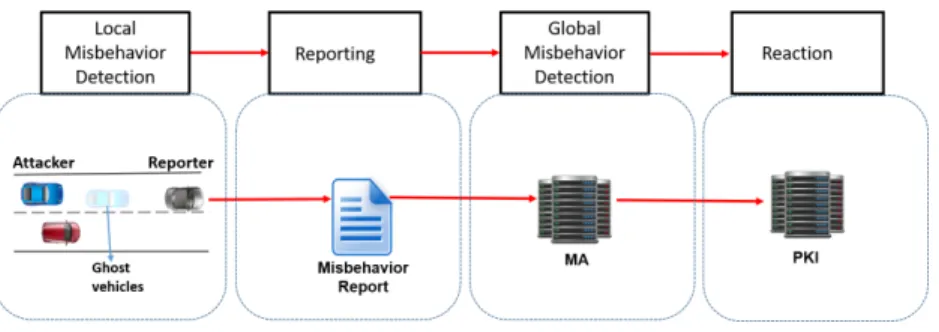
Fig. 2. Misbehavior detection steps
Commonly, the MBD process is based on four steps (see Fig. 2).
1 - Misbehavior local detection: Sybil attack is a situation where an attacker sends ghost beacon messages to simulate the existence of ghost vehicles on the road. The attack performed by the blue vehicle (see Fig. 2). This attack is able to create a virtual road congestion situation. The local MBD is performed by each single vehicle’s OBU and RSU in the local vehicular network to detect a potential misbehaving entity. It is based on checking the plausibility and the consistency of the received beacon messages. These checks are described in section 3.3. 2 - Misbehavior reporting: The reporting process consists on building and trans-mitting a Misbehavior Report (MBR) message containing the relevant detection information. More precisely, vehicles are required to provide evidences to prove the type of the detected misbehavior to the MA. This evidence consists mostly of the messages used in the detection process. After collecting enough evidence, the MBR is then sent to the global MA. This action is performed by the grey vehicle (see Fig. 2). More details on the reporting protocol are available [12]. 3 - Misbehavior global detection: This operation consists on collecting the re-ceived MBRs during a specific time frame. These MBRs are then processed to evaluate their integrity then accurately define the type of misbehavior. This operation is performed by the MA which is a back-end security management system. Notice that due to the amount of processed data and the requirements of a high detection reliability, this operation is not required to be real-time. 4 - Misbehavior reaction: Once the detection results are obtained, the MA may inform the authority in charge of proceeding to the appropriate misbehavior reaction. This can be, for instance, an immediate revocation of the misbehaving entity. Notice that in figure 2, we just provide an example where the PKI is in charge of proceeding to the appropriate reaction. As this is not yet standardized, other authorities may be in charge of misbehavior reaction in the future.
3.3 Local Detectors
The local MBD is based on checks performed by the ITS–Ss on every received message. These checks are simple and fast to calculate plausibility detectors. The features of the detection process in detailed in the following study [14]. Based on these detectors, the vehicle decides if a report should be send or not. Here is a simple summary of the functionality of all implemented local detectors:
– Range plausibility: The position of the sending ITS–S must be inside of the ITS–S maximum radio reception range.
– Position plausibility: The position of the sending ITS–S must be at a plausible place (e.g. on a road, no overlaps of physical obstacles, etc.). – Speed plausibility: The speed advertised by the sending ITS–S must be
less than a predefined threshold.
– Position consistency: Two consecutive beacons coming from a same ITS–S have plausible separating distance.
– Speed consistency: Two consecutive beacons coming from a same ITS–S must have plausible acceleration or deceleration.
– Position speed consistency: Two consecutive beacons coming from a same ITS–S must have consistent speed and separating distance.
– Beacon frequency: The beacon frequency of a sending ITS–S must be compliant with the standards.
– Position heading consistency: The positions in two consecutive beacons coming from a same ITS–S must correspond to the heading advertised in the respective beacons.
– Intersection check: Two beacons coming from two different ITS–S must not have overlapping positions.
– Sudden appearance: The ITS–S must not suddenly appear within a cer-tain range, with a preset positive speed.
– Kalman Filter Tracking: The ITS–S advertised information must be within a plausible range of the Kalman filter predicted information. The calculation implementation is open source [13]. As proposed in [11], this would us to recalculate the following detectors: (1) Position Consistency, (2) Speed Consistency, (3) Position Speed Consistency.
3.4 Attacker Model
We consider an attacker as any misbehaving entity sending inaccurate data on the network. The misbehavior is divided into two categories: Faulty behavior and attacks. A node is exerting faulty behavior if one or more of its sensors is sending inaccurate data. A node is considered an attacker if it is intentionally altering the message data before sending it over the network. We extracted from the literature a set of possible misbehavior types [19] [24]. Details of all the implemented misbehavior mechanisms are presented below:
Faulty Behavior
– Constant Position: The vehicle broadcasts the same position each beacon. – Constant Position Offset: The vehicle broadcasts its real position with a
fixed offset.
– Random Position: The vehicle broadcasts a random position from the playground.
– Random Position Offset: The vehicle broadcasts its real position with a random offset limited to a max value.
– Constant Speed: The vehicle broadcasts the same speed each beacon. – Constant Speed Offset: The vehicle broadcasts its real speed with a fixed
offset.
– Random Speed: The vehicle broadcasts a random speed with a upper limit. – Random Speed Offset: The vehicle broadcasts its real speed with a
ran-dom offset limited to a max value.
– Delayed Messages: The vehicle broadcasts its information with a delay from reality.
Attacks
– DoS: The attacking vehicle broadcasts its information with a higher fre-quency than what is defined in the standard. This increase in the beaconing frequency would inflict an overhead on the broadcasting channel. At a certain frequency increase, he channel becomes unusable by other vehicles.
– DoS Random: Similarly to DoS, the vehicle increase its beaconing fre-quency. However, the data sent in the transmitted messages is completely random.
– DoS Random Sybil: A DoS Random attack where the attacker also changes the pseudonym used at every received message.
– Disruptive: The attacking vehicle broadcasts messages with data extracted from previously received beacons. The data broadcasted in generated by genuine vehicles, thus making it plausible on some levels. The saturation of the channel by this type of data would theoretically deteriorate the quality of the C–ITS system.
– Dos Disruptive: This attack is a combination of the DoS and the Disruptive attack. The attacker sends disruptive data while simultaneously increasing its beaconing frequency.
– DoS Disruptive Sybil: A DoS Disruptive attack where the attacker also changes the pseudonym used at every received message.
– Data Replay: The attacking vehicle chooses a target and replays its data instantly with a certain minor epsilons added. Consequently, for an observer it would seem that there are two vehicles in the same space-time dimension. – Data Replay Sybil: Similar to the Data Replay attack, however the at-tacker changes his pseudonym when changing the target vehicle to avoid detection.
– Eventual Stop: The attacking vehicle simulated a sudden stop by setting the speed to zero and fixing the position.
– Traffic congestion Sybil: The attacking vehicle uses the multiple stored pseudonyms to generate ghost-vehicles. The ghost vehicles data is generated in a grid like matter to simulate a traffic congestion.
4
Misbehavior Authority Evaluation
In this work, we focus on global MBD done at the MA level. More specifically our aim is to detect the type of misbehavior signaled by the local entities with MBRs. We cast this problem as a multi-class classification problem. We are given a series of observations (x1, x2, ..xn) and the task is to learn a classifier that generates predictions ˆy of the true labels y.
In our context, the data we are dealing with is sequential. Within the same ITS–S, all the data sent to the MA are time-dependent. To elaborate, data of more recent MBRs depends on data of previously received MBRs. Therefore, a predictive system that can learn and model these types of dependencies is highly recommended.
4.1 Simulation settings and scenarios
(a) Train Network: Luxembourg City
(b) Test Network: Paris Scalay
(c) Train Vehicle Density (d) Test Vehicle Density Fig. 3. Simulation Scenarios
In order to evaluate our proposed solution, we first need a set of data. Due to the lack of reports data from deployment projects, we resolve to use the F2MD framework [3]. F2MD is a VEINS extension, VEINS [22] is an open source
framework for vehicular network simulations. VEINS uses OMNeT++ [25] for network simulation and SUMO [16] for road traffic simulation.
We use different simulation scenarios for the training part and testing part of our ML algorithms (see Fig. 3). We use the Luxembourg SUMO Traffic (LuST) scenario for the train vehicle traces [2]. These traces are a synthetic data set generated with SUMO and validated with real data. Therefore the vehicle den-sity is somewhat realistic with morning and evening peaks. The network size is 1.61km2 and the peak density of 67.4V ehicle/km2. The train scenario contains 2, 131, 150 transmitted MBRs. For the testing we generated a test bench with random vehicle traces data on a network extract of Paris Scalay. Consequently the vehicle density is somewhat stable. The choice of this test scenario has a purpose of having a significantly different train and test set. The test bench has a network size of 1.11km2 and semi constant density around 17.1V ehicle/km2.
The test bench contains 1, 047, 670 transmitted MBRs. For further technical de-tails, the source code of our VEINS extension along with all the configuration details of the simulated scenario are published on github [13].
4.2 ML Features
A feature is any attribute that can be used to characterize the data. They are individual independent variables that serve as inputs to a ML system. The qual-ity and quantqual-ity of the features can dramatically affect the results we are trying to achieve. Thus, choosing a good set of features is of paramount importance. The process of deriving features from raw data is called feature engineering. In this work, we use the following features:
– The local detection checks done on the V2X messages (see Section 3.3). – Kinematic data of the V2X messages (Speed, Acceleration and Position). – Some generic features (count features, binary features computing the number
of checks that return a complete failure).
4.3 Results and analysis
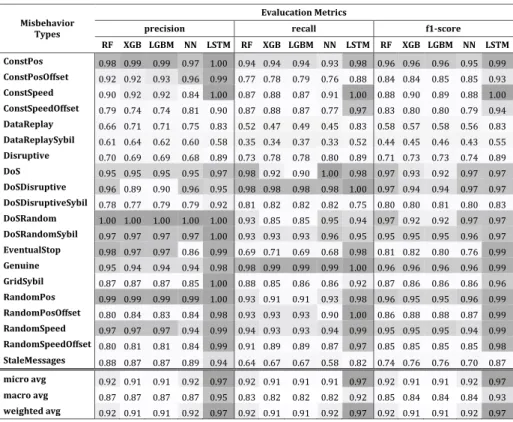
In order to better understand the data and the problem we are solving, we perform multiple experiments using several baseline ML algorithms. In this work we focus our testing on tree-based ensemble techniques and neural networks. This decision is based on the high state-of-art performance the former models showed on a wide variety of real-world problems. Algorithms like Random Forests [1] and Gradient Boosted trees [4] help us to gain valuable insights about the data by providing a way to estimate the relevance of each feature. Conversely, our proposed solution is not based on these algorithms since they mostly lack the ability to model time-dependent data when used in a purely supervised fashion. The experimental results of all the trained algorithms are listed in Table 1.
Table 1. Test scenario results of different trained ML models
Misbehavior Types
Evalucation Metrics
precision recall f1-score
RF XGB LGBM NN LSTM RF XGB LGBM NN LSTM RF XGB LGBM NN LSTM ConstPos 0.98 0.99 0.99 0.97 1.00 0.94 0.94 0.94 0.93 0.98 0.96 0.96 0.96 0.95 0.99 ConstPosOffset 0.92 0.92 0.93 0.96 0.99 0.77 0.78 0.79 0.76 0.88 0.84 0.84 0.85 0.85 0.93 ConstSpeed 0.90 0.92 0.92 0.84 1.00 0.87 0.88 0.87 0.91 1.00 0.88 0.90 0.89 0.88 1.00 ConstSpeedOffset 0.79 0.74 0.74 0.81 0.90 0.87 0.88 0.87 0.77 0.97 0.83 0.80 0.80 0.79 0.94 DataReplay 0.66 0.71 0.71 0.75 0.83 0.52 0.47 0.49 0.45 0.83 0.58 0.57 0.58 0.56 0.83 DataReplaySybil 0.61 0.64 0.62 0.60 0.58 0.35 0.34 0.37 0.33 0.52 0.44 0.45 0.46 0.43 0.55 Disruptive 0.70 0.69 0.69 0.68 0.89 0.73 0.78 0.78 0.80 0.89 0.71 0.73 0.73 0.74 0.89 DoS 0.95 0.95 0.95 0.95 0.97 0.98 0.92 0.90 1.00 0.98 0.97 0.93 0.92 0.97 0.97 DoSDisruptive 0.96 0.89 0.90 0.96 0.95 0.98 0.98 0.98 0.98 1.00 0.97 0.94 0.94 0.97 0.97 DoSDisruptiveSybil 0.78 0.77 0.79 0.79 0.92 0.81 0.82 0.82 0.82 0.75 0.80 0.80 0.81 0.80 0.83 DoSRandom 1.00 1.00 1.00 1.00 1.00 0.93 0.85 0.85 0.95 0.94 0.97 0.92 0.92 0.97 0.97 DoSRandomSybil 0.97 0.97 0.97 0.97 1.00 0.93 0.93 0.93 0.96 0.95 0.95 0.95 0.95 0.96 0.97 EventualStop 0.98 0.97 0.97 0.86 0.99 0.69 0.71 0.69 0.68 0.98 0.81 0.82 0.80 0.76 0.99 Genuine 0.95 0.94 0.94 0.94 0.98 0.98 0.99 0.99 0.99 1.00 0.96 0.96 0.96 0.96 0.99 GridSybil 0.87 0.87 0.87 0.85 1.00 0.88 0.85 0.86 0.86 0.92 0.87 0.86 0.86 0.86 0.96 RandomPos 0.99 0.99 0.99 0.99 1.00 0.93 0.91 0.91 0.93 0.98 0.96 0.95 0.95 0.96 0.99 RandomPosOffset 0.80 0.84 0.83 0.84 0.98 0.93 0.93 0.93 0.90 1.00 0.86 0.88 0.88 0.87 0.99 RandomSpeed 0.97 0.97 0.97 0.94 0.99 0.94 0.93 0.93 0.94 0.99 0.95 0.95 0.95 0.94 0.99 RandomSpeedOffset 0.80 0.81 0.81 0.84 0.99 0.91 0.89 0.89 0.87 0.97 0.85 0.85 0.85 0.85 0.98 StaleMessages 0.88 0.87 0.87 0.89 0.94 0.64 0.67 0.67 0.58 0.82 0.74 0.76 0.76 0.70 0.87 micro avg 0.92 0.91 0.91 0.92 0.97 0.92 0.91 0.91 0.91 0.97 0.92 0.91 0.91 0.92 0.97 macro avg 0.87 0.87 0.87 0.87 0.95 0.83 0.82 0.82 0.82 0.92 0.85 0.84 0.84 0.84 0.93 weighted avg 0.92 0.91 0.91 0.92 0.97 0.92 0.91 0.91 0.92 0.97 0.92 0.91 0.91 0.92 0.97
Baseline classifiers: In this work, we test a number of baseline classifiers. (1) Random Forests (RF), (2) XGboost (XGB), (3) LightGBM (LGBM) and (4) Neural networks (NN). For the sake of brevity, we detail only the architecture of two models:
1. XGBoost: The proposed XGBoost model is fairly straightforward. We use grid search based on 5-fold cross validation to tune the hyper-parameters, which were set to the following values: (1) Learning rate: 0.05. (2) Maximum depth of trees: 3. (3) Sample bagging fraction: 0.9. (4) Feature fraction: 0.6. (5) All other parameters were set to default.
2. Neural Network model: The proposed neural network architecture con-sists of two hidden dense layers with 300 units in each of them. After each dense layer a Batch Normalization layer [10] and a dropout layer [23] with probability 0.1 are used. The activation function for hidden layers is Rectified Linear Unit (ReLU). In this experiment, we are dealing with a multi-class classification problem. Therefore, the MLP uses a softmax activation in the output layer. The optimized loss function is a categorical cross entropy and the model is trained for 20 epochs using Adam optimizer [15] with a learning rate of 0.1.
Proposed solution: As mentioned above, the MBRs coming from the same ITS–S are time-dependent. These MBRs include beacon messages as well as lo-cal check detectors as evidence (see Section 3.2). The beacon messages contain kinematic time-series data (Position, Speed, Acceleration, etc...). However, the local check detectors are Independent and Identically Distributed (I.I.D) obser-vations. To account for both data types, a two-way neural network architecture with two input types is proposed and trained in an end-to-end fashion. We use a sliding window based technique by computing statistical features (mean, me-dian, min, and quartiles). This method allows us to condense a batch of multiple observations into a single observation. We experiment with different model ar-chitectures and resolve to the architecture detailed below.
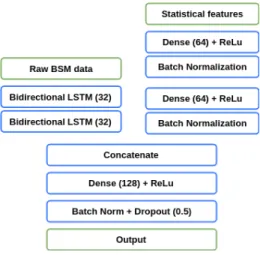
Fig. 4. Architecture of the proposed solution
The proposed architecture consists of two branches (see Fig 4) : Time-series branch (left side) and meta-features branch (right side). The time-series branch takes as input the raw beacon message data. It has two bidirectional LSTM layers with 32 units each. The meta-features branch takes all the statistical features as input. It consists of two fully connected layers with 64 neurons followed by a ReLu activation function and a Batch Normalization layer. Both branches are concatenated and are followed by a fully connected layer, a ReLu activation function, Batch normalization and Dropout with probability 0.5.
The goal of training is to find model parameters that minimize a loss func-tion between the predicted distribufunc-tion and the actual target labels. This can be achieved by using Stochastic Gradient Descent algorithm (SGD). At each iteration, the SGD updates the parameters towards the opposite direction of the gradients to find a good local minimum. In our solution, we use the focal loss with parameters suggested by Tsung-Yi et al. [17]. We experiment with multiple set of parameters and we find that the default parameters yield the best results
on our validation set. This loss function allows our model to account for the class imbalance present in the data. Additionally, to combat overfitting, we use early stopping based on the model performance on the validation set. In this sense, we evaluate the model accuracy after every epoch on the validation set and stop training when the accuracy stops improving or goes down. The model is trained for 10 epochs with Adam optimizer and a learning rate 0.1.
The experimental results regarding this solution are also reported in Table 1. From this results, we can see that the proposed solution based on a LSTM model outperforms all the baseline algorithms on all three evaluated metrics. The overall detection for all types of misbehavior yield an accuracy of 97%.
5
Conclusion and Future Work
In this paper, we focus on global misbehavior detection in C–ITS. Specifically, we explore solutions for global misbehavior type classification. To achieve this, we extract features from the local ITS–Ss detector checks and engineer additional features from the raw beacon data. We capitalize on the time-dependent nature of the data and propose a LSTM-based detection system. We show through testing results that our proposed system outperforms the baseline classifiers on all the evaluation metrics.
Future work involves exploring other machine learning techniques, such as blending and stacking. Additionally, we plan on testing our proposed solutions on non-synthetic data (i.e. data originating from real deployment projects).
References
1. Breiman, L.: Random forests. Machine learning 45(1), 5–32 (2001)
2. Codeca, L., Frank, R., Engel, T.: Luxembourg sumo traffic (lust) scenario: 24 hours of mobility for vehicular networking research. In: IEEE Vehicular Networking Conference (VNC). pp. 1–8 (Dec 2015)
3. Framework For Misbehavior Detection (F2MD): F2MD website (2019), https://
www.irt-systemx.fr/f2md
4. Friedman, J.H.: Stochastic gradient boosting. Computational statistics & data analysis 38(4), 367–378 (2002)
5. Ghaleb, F.A., Zainal, A., Rassam, M.A., Mohammed, F.: An effective misbehav-ior detection model using artificial neural network for vehicular ad hoc network applications. In: 2017 IEEE Conference on Application, Information and Network Security (AINS). pp. 13–18. IEEE (2017)
6. Grover, J., Laxmi, V., Gaur, M.S.: Misbehavior detection based on ensemble learn-ing in vanet. In: International Conference on Advanced Computlearn-ing, Networklearn-ing and Security. pp. 602–611. Springer (2011)
7. Grover, J., Prajapati, N.K., Laxmi, V., Gaur, M.S.: Machine learning approach for multiple misbehavior detection in vanet. In: International Conference on Advances in Computing and Communications. pp. 644–653. Springer (2011)
8. Gyawali, S., Qian, Y.: Misbehavior detection using machine learning in vehicular communication networks. In: ICC 2019-2019 IEEE International Conference on Communications (ICC). pp. 1–6. IEEE (2019)
9. van der Heijden, R.W., Lukaseder, T., Kargl, F.: Veremi: a dataset for compara-ble evaluation of misbehavior detection in vanets. In: International Conference on Security and Privacy in Communication Systems. pp. 318–337. Springer (2018) 10. Ioffe, S., Szegedy, C.: Batch normalization: Accelerating deep network training by
reducing internal covariate shift. arXiv preprint arXiv:1502.03167 (2015)
11. Jaeger, A., Bißmeyer, N., St¨ubing, H., Huss, S.A.: A novel framework for efficient mobility data verification in vehicular ad-hoc networks. International Journal of Intelligent Transportation Systems Research 10(1), 11–21 (Jan 2012), https://doi. org/10.1007/s13177-011-0038-9
12. Kamel, J., Ben Jemaa, I., Kaiser, A., Urien, P.: Misbehavior reporting protocol for c-its. In: 2018 IEEE Vehicular Networking Conference (VNC). pp. 1–4 (Dec 2018) 13. Kamel, J.: Github repository: Framework for misbehavior detection (f2md) (2019),
https://github.com/josephkamel/f2md
14. Kamel, J., Kaiser, A., Ben Jemaa, I., Cincilla, P., Urien, P.: CaTch: a confidence range tolerant misbehavior detection approach. In: 2019 IEEE Wireless Commu-nications and Networking Conference (WCNC) (IEEE WCNC 2019). Marrakech, Morocco (Apr 2019)
15. Kingma, D.P., Ba, J.: Adam: A method for stochastic optimization. arXiv preprint arXiv:1412.6980 (2014)
16. Krajzewicz, D., Erdmann, J., Behrisch, M., Bieker, L.: Recent development and applications of SUMO - Simulation of Urban MObility. International Journal On Advances in Systems and Measurements 5(3&4), 128–138 (December 2012), http: //elib.dlr.de/80483/
17. Lin, T.Y., Goyal, P., Girshick, R., He, K., Doll´ar, P.: Focal loss for dense object detection. In: Proceedings of the IEEE international conference on computer vision. pp. 2980–2988 (2017)
18. Petit, J., Schaub, F., Feiri, M., Kargl, F.: Pseudonym schemes in vehicular networks: A survey. IEEE Communications Surveys Tutorials 17(1), 228–255 (Firstquarter 2015)
19. Petit, J., Ansari, R.: V2X Validation Tool. https://bitbucket.org/onboardsecurity/ dsrcvt (BlackHat 2018)
20. So, S., Petit, J., Starobinski, D.: Physical layer plausibility checks for misbehavior detection in v2x networks. In: Proceedings of the 12th Conference on Security and Privacy in Wireless and Mobile Networks. pp. 84–93. ACM (2019)
21. So, S., Sharma, P., Petit, J.: Integrating plausibility checks and machine learning for misbehavior detection in vanet. In: 2018 17th IEEE International Conference on Machine Learning and Applications (ICMLA). pp. 564–571. IEEE (2018) 22. Sommer, C., German, R., Dressler, F.: Bidirectionally coupled network and road
traffic simulation for improved ivc analysis. IEEE Transactions on Mobile Com-puting 10(1), 3–15 (Jan 2011)
23. Srivastava, N., Hinton, G., Krizhevsky, A., Sutskever, I., Salakhutdinov, R.: Dropout: a simple way to prevent neural networks from overfitting. The Journal of Machine Learning Research 15(1), 1929–1958 (2014)
24. van der Heijden, R.W., Dietzel, S., Leinm¨uller, T., Kargl, F.: Survey on misbehavior detection in cooperative intelligent transportation systems. IEEE Communications Surveys Tutorials 21(1), 779–811 (Firstquarter 2019)