HAL Id: hal-01009049
https://hal.archives-ouvertes.fr/hal-01009049
Submitted on 23 Jun 2018
HAL is a multi-disciplinary open access
archive for the deposit and dissemination of
sci-entific research documents, whether they are
pub-lished or not. The documents may come from
teaching and research institutions in France or
abroad, or from public or private research centers.
L’archive ouverte pluridisciplinaire HAL, est
destinée au dépôt et à la diffusion de documents
scientifiques de niveau recherche, publiés ou non,
émanant des établissements d’enseignement et de
recherche français ou étrangers, des laboratoires
publics ou privés.
Three-dimensional face stability analysis of circular
tunnels by numerical simulations
Daniel Dias, Jean-Pierre Janin, Abdul-Hamid Soubra, Richard Kastner
To cite this version:
Daniel Dias, Jean-Pierre Janin, Abdul-Hamid Soubra, Richard Kastner. Three-dimensional face
sta-bility analysis of circular tunnels by numerical simulations. ASCE Geocongress 2008, 2008, Nouvelle
Orléans, United States. �10.1061/40972(311)111�. �hal-01009049�
Three-dimensional face stability analysis of circular tunnels by numerical simulations
Daniel Dias1, M. ASCE, Jean-Pierre Janin2, Abdul-Hamid Soubra3, M. ASCE, and Richard Kastner4
1
Associate Professor, INSA Lyon, LGCIE Site Coulomb3, 69621 Villeurbanne Cedex, France. E-mail: [email protected],
2
Post Graduate, INSA Lyon, LGCIE Site Coulomb3, 69621 Villeurbanne Cedex, France. E-mail: [email protected],
3
Professor, University of Nantes, GeM, UMR CNRS 6183, Bd. de l’université, BP 152, 44603 Saint-Nazaire cedex, France. E-mail: [email protected]
4
Professor, INSA Lyon, LGCIE Site Coulomb3, 69621 Villeurbanne Cedex, France. E-mail: [email protected]
ABSTRACT: The face stability analysis of shallow circular tunnels driven by the pressurized shield is investigated by three-dimensional numerical simulations. Both the active and passive soil failures of the tunnel face are considered in the analysis. A comparison is performed between (i) the present numerical solutions of the ultimate pressure of the tunnel face, (ii) the results of the multiblock mechanism of the kinematical approach in limit analysis and (iii) the values of the ultimate tunnel pressure obtained from centrifuge model tests. The shortcomings of the multiblock failure mechanism are presented and discussed.
INTRODUCTION
The face stability analysis of shallow circular tunnels driven by the pressurized shield has been investigated in literature by several authors. Most approaches are based on a two-dimensional analysis (Dias et al. 2002, DeBorst et al. 1996) and are based on either the limit equilibrium (Anagnostou 1996) or the limit analysis methods (Leca and Dormieux 1990, Soubra 2000, 2002) which require a priori assumptions concerning the form of the failure mechanism. In the three-dimensional two-block failure mechanism investigated by Leca and Dormieux (1990), the assumed failure mechanism considers that only a part of the tunnel circular face (an ellipse inscribed in that circular area) is concerned by failure; the remaining part of the tunnel face surface being at rest. The aim of the present work is to determine the ultimate tunnel pressure and the corresponding soil mass at failure without any a priori hypotheses concerning the shape of the failure mechanism. The approach used in the present paper for the determination of the ultimate pressure of the tunnel face is based on numerical
simulations using the Lagrangian explicit finite difference code FLAC3D. Both the active and passive soil failures in front of the tunnel face are considered in the analysis. The ultimate tunnel pressures obtained in both the active and passive cases are presented and compared (i) to those given by the kinematical approach of limit analysis by Soubra (2002) using a multiblock failure mechanism and (ii) to the results of the centrifuge model tests by Al-Hallak (1999). In the following, one presents an overview of the recent literature. Then, the numerical FLAC3Dsimulations and the comparison between the present solutions and the existing ones follow.
OVERVIEW OF RECENT LITERATURE ON THE ULTIMATE PRESSURE OF THE TUNNEL FACE
Several theoretical models have been presented in literature for the computation of the ultimate tunnel pressure. The most recent approach is the one presented by Leca and Dormieux (1990) and improved later by Soubra (2000, 2002). The model by Soubra (2002) is based on the kinematical approach of the limit analysis theory and used a multiblock failure mechanism. The results given by this mechanism are the best upper-bound solutions for both the active and passive cases. On the other hand, centrifuge model tests have been performed by Al-Hallak (1999). The centrifuge model is composed of a steel container of dimensions 1200mm x 80mm x 720mm filled with Fontainebleau’s sand and a steel tube of 200mm diameter to represent the tunnel. The tunnel axis is located at 500mm below the surface of the soil mass. In these tests, the small-scale model is submitted to an acceleration of 50g where g is the gravitational acceleration. This model simulates a tunnel of 10m diameter.
Three phases are performed during the test for the determination of the ultimate active pressure: First, an air pressure equals to that corresponding to the earth pressure at rest at the tunnel center is applied to the tunnel face. Then, the acceleration is increased from 1g to 50g. Finally, the ultimate active tunnel pressure is obtained by reducing the supporting pressure until failure occurs. The experimental results have shown that in the active case, the soil mass at failure does not reach the ground surface and the failure mechanism is confined nearby the tunnel face. However, the soil mass in failure reaches the ground surface in the passive case.
THE NUMERICAL APPROACH
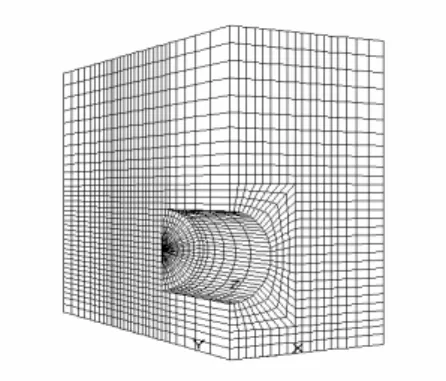
The centrifuge model tests performed by Al-Hallak on a small-scale model of tunnel were simulated using the explicit finite difference code FLAC3D. For symmetry reasons, only half of the geometry is modeled (figure 1). The size of the numerical model is 0.4 m in the X direction, 0.72 m in the Z direction and 0.90 m in the Y direction. These dimensions are chosen so as not to affect the value of the ultimate tunnel pressure. A three-dimensional non uniform mesh is used. The present model is composed of approximately 23 000 zones. A conventional elastic-perfectly plastic model based on the Mohr-Coulomb failure criterion is adopted to represent the soil. The parameters of the soil mass were deduced from laboratory tests (Gay 2000,
Gaudin 2002). The metallic tube simulating the tunnel is simulated by a “liner” structural element. The tunnel is assumed to be rigid and an interface is placed between the soil and the outer surface of the tunnel to allow the slip that may occur on this contact area.
FIG. 1. Numerical model
The characteristics adopted in the numerical simulations for the soil and the interface are given in Table 1.
Table 1. Characteristics of the soil and the interface
Soil characteristics Value Interface
characteristics
Value
Young Modulus 50 MPa Normal stiffness 3* 1011 kN/m
Poisson’s ratio 0.33 Shear stiffness 3* 1011 kN/m
Cohesion 0 kPa Cohesion 0 kPa
Friction angle 42° Friction angle 28°
Dilatancy angle 15.3°
Unit weigth 15.7kN/m3
As in the experimental centrifuge tests, a pressure equal to the soil pressure at rest is applied to maintain the stability of the tunnel face. This pressure is taken equals to the experimental value (i.e. 200 kPa). Then the model is subjected to an acceleration of 50g. Finally the ultimate active tunnel pressure is found by gradually decreasing the internal pressure until the failure of the soil mass nearby the tunnel face occurs. This means that a stress-controlled approach is used for the computation of the tunnel ultimate pressure.
As mentioned in the previous section, a stress-controlled approach is used to compute the active tunnel pressure. The computation is performed for the case C/D=0.5, where C and D are respectively the tunnel cover and the tunnel diameter. Several gradually decreasing pressures are successively applied to the tunnel face until failure or plastic flow occurs in the soil. At each pressure, several cycles are performed until a steady state of static equilibrium or plastic flow is developed in the soil. The plastic flow is achieved when both conditions are satisfied as the number of cycles increases:
(i) small values of the unbalanced forces for all nodes of the mesh;
(ii) a non-constant continuously increasing displacement of a specific point in the soil mass. In this paper, the horizontal displacement of the tunnel center is considered for this analysis.
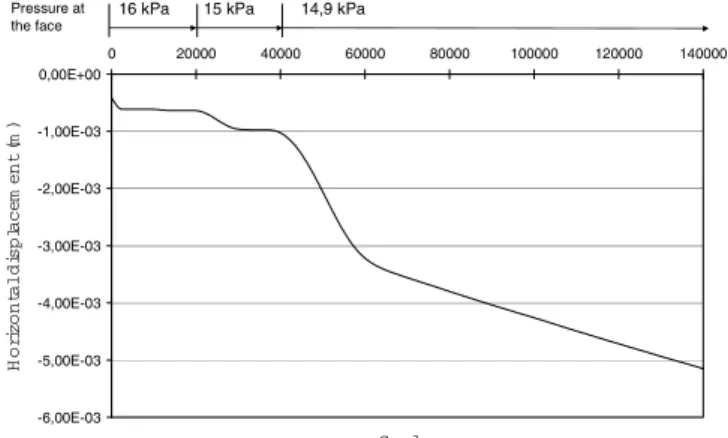
The highest pressure corresponding to this state of plastic flow is called the active tunnel pressure (failure pressure). Notice that for smaller values of the tunnel pressure, a constant displacement of the tunnel center is obtained as the number of cycles increases (figure 2). This indicates that a steady state of static equilibrium (i.e. no failure or plastic flow) is obtained in those cases. From this figure, one can see that the active tunnel pressure is obtained for t =15kPa for which a non-constant
continuously increasing displacement is obtained as the number of cycles increases.
-6,00E-03 -5,00E-03 -4,00E-03 -3,00E-03 -2,00E-03 -1,00E-03 0,00E+00 0 20000 40000 60000 80000 100000 120000 140000 C ycles H o ri z o n ta l d is p la c e m e n t (m )
16 kPa 15 kPa 14,9 kPa
Pressure at the face
FIG. 2 Horizontal displacement at the center of the tunnel face versus the number of cycles in FLAC3D
An alternative and equivalent approach to identify the state of failure or plastic flow considers (i) the velocity of the tunnel center (horizontal velocity in the present paper) as shown in figure 3 and (ii) the condition on the unbalanced forces. For the active tunnel pressure, the velocity of the tunnel center does not decrease to zero with the number of cycles indicating a non-constant displacement of the tunnel center with the number of cycles (i.e. there is no steady state in this case). However, this velocity decreases to zero (which corresponds to a constant displacement) when the steady state of static equilibrium is obtained indicating that the failure does not occur in those
cases. Notice however that the first approach is preferable since it gives information about the value of the tunnel center displacement for the different tunnel pressures.
-1,60E-07 -1,40E-07 -1,20E-07 -1,00E-07 -8,00E-08 -6,00E-08 -4,00E-08 -2,00E-08 0,00E+00 0 20000 40000 60000 80000 100000 120000 140000 C ycles H o ri z o n ta l v e lo c it y (m /c y c le )
16 kPa 15 kPa 14,9 kPa Pressure at
the face
FIG. 3. Horizontalvelocity at the center of the tunnel face versus the number of cycles in FLAC3D
COMPARISON WITH OTHER RESULTS
The results of the active and passive pressures obtained from the numerical simulations using FLAC3Dare compared in figures 4 and 6 with those given by Leca and Dormieux (1990) and Soubra (2002) using the multiblock mechanism in limit analysis. 14 14,5 15 15,5 16 16,5 17 17,5 18 18,5 19 0,5 1 1,5 2 2,5 3 3,5 4 4,5 5 C /D P re s s u re (k P a ) Flac3D
Leca & Dormieux (1990) Soubra (2002)
FIG. 4.Failure pressure versus C/D (collapse case) - comparison between the kinematical approach (Leca and Dormieux 1990 and Soubra 2002) and FLAC3D
Concerning the collapse case, the pressures calculated withFLAC3D are smaller than those given by the kinematical approach. A maximum difference of about 20% for
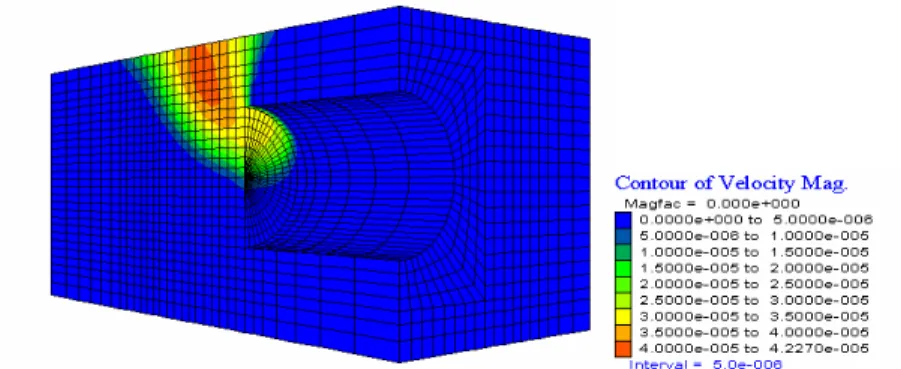
C/D=0.5 is obtained. This difference could be related to the a priori assumption concerning the form of the failure mechanism chosen by Soubra (2002). The intersection between the cone adjacent to the tunnel face in the multiblock mechanism and the tunnel face is an ellipse. This surface represents the zone of the face concerned by failure. In the numerical simulations, the entire tunnel face is concerned by failure (figure 5). This may explain the difference between the ultimate pressures computed by the two approaches in the active case.
FIG. 5. Velocity field, collapse case, C/D = 0,5
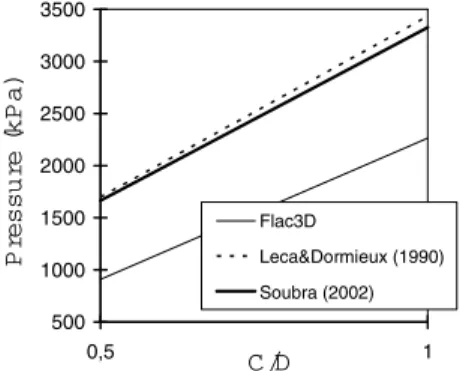
500 1000 1500 2000 2500 3000 3500 0,5 1 C /D P re s s u re (k P a ) Flac3D Leca&Dormieux (1990) Soubra (2002)
FIG. 6. – Failure pressure versus C/D (blow-out case) - comparison between the kinematical approach (Leca and Dormieux 1990 and Soubra 2002) and FLAC3D For the passive case, the ultimate passive pressures calculated byFLAC3Dare smaller (maximum difference of 40%) than those provided by the kinematical approach. This may be explained by the shape of the failure considered by the multiblock mechanism at the tunnel face. Figure 7 shows that in the blow-out case, only the upper-half of the tunnel face is concerned by failure. However, the multiblock mechanism in limit analysis considers an ellipse whose great axis is vertical and equal to the tunnel diameter.
FIG. 7. Displacement velocity field, blow out case, C/D = 0,5
Table 2 shows the comparison between the results of (i) the present numerical simulations, (ii) the kinematical approach and (iii) the centrifuge results for the following configuration: C/D = 2, = 42°, = 15.3°, = 15.7kN/m3where is the soil unit weight. The solutions by Leca and Dormieux (1990) are not presented since the present upper-bound solutions by Soubra (2002) are better (i.e. greater) than the ones of Leca and Dormieux (1990).
The results given by the kinematical approach are not in good agreement with those obtained by the centrifuge tests (difference of about 30 %). This confirms that the failure mechanism used in this approach is not adequate to calculate the limit pressure of the tunnel.
Table 2: Comparison between the present results and those of the centrifuge tests and the upper-bound solutions by Soubra (2002)
Authors Centrifuge tests - Al
Hallak (1999) Kinematical approach (Soubra 2002) Numerical simulations t [kPa] 8 5.8 6.8 CONCLUSIONS
It was shown in this paper that the kinematical approach does not take into account with accuracy the failure shape at the tunnel face. In the collapse case, the entire surface of the face is at failure. However, the kinematical approach considers only an elliptical surface. In the blow out, the numerical simulations have shown that only the upper-half of the tunnel face is concerned by failure. However, an ellipse with a great vertical axis equal to the tunnel diameter is taken into account in the kinematical approach. Thus, it seems necessary to develop new failure mechanisms in limit analysis in accordance with the experimental and numerical findings.
REFERENCES
Al Hallak R. (1999). “Etude expérimentale et numérique du renforcement du front de taille par boulonnage dans les tunnels en terrains meubles.“, PhD. thesis, Paris, Ecole Nationale des Ponts et Chaussées, 283 p.
Anagnostou, G. (1996). “Face stability in slurry and EPB shield tunnelling.”, Proc. of the Int. Symposium on geotechnical aspects of underground construction in soft ground, London, Rotterdam :Balkema, 453-458.
De Borst, R., Van den Broek, W., Groen, A. (1996). “Two and three dimensionnal numerical modelling of a guided pipe-jacking in soft soil.”, Geotechnical aspects of underground construction in soft ground, London, 8p.
Dias D., Kastner R., Maghazi M. (2002). “Slurry shield tunneling : simulation of the effect of slurry infiltration on the face stability.” ACUUS 2002 - Urban Underground space : a ressource for cities, International conference, Turin (Italy), 10p.
Gaudin, C. (2002). “Modélisation physique et numérique d’un écran de soutènement autostable, application a l’étude de l’interaction écran-fondation.”, PhD thesis, LGCIE, INSA Lyon, 2002, 401p.
Gay, O. (2000). “Modélisation physique et numérique de l’action d’un glissement lent sur des fondations d’ouvrages d’art.”, PhD. thesis, Laboratoire 3S, Grenoble 1, 291p.
Leca, E. and Dormieux, L. (1990). “Upper and lower bound solutions for the face stability of shallow circular tunnels in frictional material.” Géotechnique, 40(4), 581-606.
Soubra, A. H. (2000). “Three-dimensional face stability analysis of shallow circular tunnels.” International Conference on Geotechnical and Geological Engineering, Melbourne, Australia.
Soubra, A. H. (2002). “Kinematical approach to the face stability analysis of shallow circular tunnels.” 8th International Symposium on Plasticity, Canada, British Columbia, 443-445.