HAL Id: hal-02280844
https://hal-univ-rennes1.archives-ouvertes.fr/hal-02280844
Submitted on 27 Sep 2019HAL is a multi-disciplinary open access archive for the deposit and dissemination of sci-entific research documents, whether they are pub-lished or not. The documents may come from
L’archive ouverte pluridisciplinaire HAL, est destinée au dépôt et à la diffusion de documents scientifiques de niveau recherche, publiés ou non, émanant des établissements d’enseignement et de
Probing the Local Magnetic Structure of the
[FeIII(Tp)(CN)3]- Building Block Via Solid-State NMR
Spectroscopy, Polarized Neutron Diffraction, and
First-Principle Calculations
Siddhartha De, Alexandrine Flambard, Delphine Garnier, Patrick Herson,
Frank H Köhler, Abhishake Mondal, Karine Costuas, Béatrice Gillon,
Rodrigue Lescouëzec, Boris Le Guennic, et al.
To cite this version:
Siddhartha De, Alexandrine Flambard, Delphine Garnier, Patrick Herson, Frank H Köhler, et al.. Probing the Local Magnetic Structure of the [FeIII(Tp)(CN)3]- Building Block Via Solid-State NMR Spectroscopy, Polarized Neutron Diffraction, and First-Principle Calculations. Chemistry - A Euro-pean Journal, Wiley-VCH Verlag, 2019, 25 (52), pp.12120-12136. �10.1002/chem.201902239�. �hal-02280844�
Probing the Local Magnetic Structure of the
[Fe
III
(Tp)(CN)
3
]
-
Building Block via Solid-State
NMR, Polarized Neutron Diffraction and First
Principle Calculations
Siddhartha Dea, Alexandrine Flambarda, Delphine Garniera, Patrick Hersona, Frank H. Köhlerb, A. Mondala, Karine Costuasc, Béatrice Gillond*, Rodrigue Lescouëzeca*, Boris Le Guennicc*,
Frédéric Gendronc*
a
Sorbonne Université, Institut Parisien de Chimie Moléculaire, CNRS UMR 8232, 4 place Jussieu, 75252 Paris cedex 5, France
b
Technische Universität München, Lichtenbergstrasse 4, 85747 Garching, Germany
c Univ Rennes, CNRS, ISCR (Institut des Sciences Chimiques de Rennes) UMR 6226, F-35000
Rennes, France
d
Laboratoire Léon Brillouin, CEA and CNRS, UMR 12, Centre d’Etudes de Saclay, F-91191 Gif-sur-Yvette, France
KEYWORDS. Molecular magnetism, Paramagnetic NMR, Polarized Neutron Diffraction, Spin
ABSTRACT. We have investigated the local magnetic structure in the [FeIII(Tp)(CN)3]- building
block by combining paramagnetic Nuclear Magnetic Resonance (pNMR) spectroscopy and Polarized Neutron Diffraction (PND) with first principle calculations. The use of the pNMR and PND experimental techniques revealed the spin density extension from the metal to the ligands, and enlightened the different spin mechanisms that take place on the cyanido ligands: spin-polarization on the carbon atoms and spin-delocalization on the nitrogen ones. The results were confronted to theoretical calculations that allowed further analyses. Our combined density functional theory (DFT) and multi-reference calculations are in good agreement with the PND results and the experimental NMR chemical shifts, showing the validity of the theoretical approach. Moreover, the calculations allow us to connect the experimental spin-density map characterized by PND and the suggested repartition of the spin density on the ligands observed by NMR spectroscopy. Interestingly, significant differences are observed between the pseudo-contact contributions of the chemical shifts obtained by theoretical calculations and the values derived from NMR using a simple point-dipole model. These discrepancies allow underlying the limitation of the point-dipole model, and the need of using more elaborated approaches in order to break down the experimental pNMR chemical shifts into contact and pseudo-contact contributions.
INTRODUCTION
The design of magnetic materials based on the self-assembly of paramagnetic building blocks has allowed obtaining a great variety of magnetic systems with tunable architecture, topology and dimensionality.1 The main interest of molecule-based magnetic materials lays in the observation of original magnetic behaviors that are not usually observed in classical magnets. For example, the observation of magnetic bistability in discrete or one-dimensional complexes showing uniaxial magnetic anisotropy (so-called molecule magnets”, SMM or “single-chain magnets”, SCM) has attracted a lot of interests in the last two decades because of the potential use of SMM and SCM as molecular memories.2,3,4 The photomagnetism, which is the
successful. One of the reasons is the ability of the cyanido bridging ligand to efficiently promote electronic communication (or electron transfer) between different metal ions. The access to cyanido building blocks with adjustable electronic properties is also an asset in designing molecular magnetic systems.5,6 In the early 2000s, some of us synthesized various [Fe(L)(CN)x]
-building blocks (L = polydentate ligands, x = 3-4) allowing the preparation of low dimensional magnetic systems.7 In particular, we reported the preparation of the low-spin Fe(III) building block [FeIII(Tp)(CN)3]-, where Tp- is the hydrotris(pyrazolyl)borate scorpionate ligand (see
Figure 1).8 Here the versatility of the scorpionate ligands permits the adjustment of the steric and electronic properties of the precursor, and hence allows tuning the magnetic properties. The use of [FeIII(Tp)(CN)3]¯ has been fruitful, in particular for obtaining photomagnetic molecules, SMM
and multifunctional systems.9,10,11,12,13
Figure 1. Molecular representation of the building block [FeIII
(Tp)(CN)3]¯. (Color scheme: green
for Fe, blue for N, grey for C, pink for B, white for H.) The magnetization axis c* used in PND measurements is represented in red. THE FIGURE STILL NEED TO BE RE-DRAWN !
A few years ago, we have undertaken a fundamental study, which aims at getting a deeper understanding of the properties of the [FeIII(Tp)(CN)3]¯ building block by probing the magnetism
at the local scale.14 Indeed, magnetic properties of molecular materials are mostly obtained from bulk measurements that only give access to macroscopic behavior. The rationalization of these macroscopic magnetic properties is then commonly addressed by phenomenological approaches based on spin Hamiltonian models.15 For example, EPR spectroscopy can also lead to interesting
local information such as the magnetic anisotropy of the ground state. However, the analysis of the EPR data relies on effective Hamiltonian (g-tensors and /or zero-field splitting parameters.16,17 In contrast, in our previous study on the [FeIII(Tp)(CN)3]¯ complex, we managed
to access to a direct picture of the magnetic anisotropy at the local scale by using a new experimental approach, namely polarized neutron diffraction (PND). We have shown that PND analyses on a single crystal (at moderate fields and in three orthogonal directions) give access to the magnetic susceptibility tensor, and we obtained a direct picture of the magnetic anisotropy on the iron ion, revealing a strong axial anisotropy along the C3 pseudo-axis.14
In the present work, we continue exploring techniques that allow probing the magnetic properties at the local scale. More particularly, we focus on techniques that allow probing the spin density distribution in metal complexes. In cyanido building blocks, the spin density delocalization on the cyanido ligand into - and/or -type orbitals is of particular interest as it is related to the magnetic exchange interaction in the resulting self-assembled materials. Only few techniques give access to such local magnetic information. X-ray Magnetic Circular Dichroism (XMCD) is a unique tool to evaluate the respective contributions of the spin and orbit magnetic moment.18 However, it often fails in providing information for the light atoms, which bear very weak magnetic moments. When suitable crystals are available, PND becomes a powerful alternative to get information on the spin density distribution in paramagnetic complexes. A large panel of complexes with various cyanido building blocks have been already investigated by this technique, but very approximate information was obtained on the spin density extension on the ligands.19,20,21 In order to gain information on the ligand spin density distribution, experimental diffraction analysis techniques can be also combined with quantum chemistry.22 , 23 Another experimental alternative method is NMR spectroscopy. This technique is well known as a powerful local structural probe. In the study of paramagnetic systems, it often needs to be combined with ab-initio calculation to link structural environment to paramagnetic chemical shifts. Example can be found with numerous kind of paramagnetic systems including lanthanide-based systems,24, 25 ,26 or in solid-state systems27 like Li-ion batteries.28 ,29 , 30. However, NMR experiments can also be used to probe the spin-density distribution in molecular compounds as a fraction of the NMR chemical shift via the Fermi-contact contribution, which is directly linked to
paramagnetic chemical shift, to extract the Fermi-contact term from the paramagnetic chemical shift. Some of us previously used simple models based on the point-dipole approximation to carry out such studies on cyanide-based materials such as hexacyanometallate and Prussian blue analogues,31,32,33 but none of these previous works were confronted to ab-initio calculations. Here we propose to investigate the [FeIII(Tp)(CN)3]¯ complex and confront experimental NMR results
to ab-initio calculations and to PND studies.
To our knowledge, this is the first time that such study combining both NMR and PND techniques to quantum calculation is carried out for probing local magnetic data. The advantage of combining these three techniques was threefold. Firstly, it allowed us drawing a clear picture of the spin density distribution in a strongly paramagnetic system, and secondly, to highlight the different spin mechanisms that govern this distribution. Finally, the combination of these techniques allowed us to reveal the limits of using paramagnetic NMR shifts to access to local spin density (in particular the limits of the point-dipole model in the pseudo-contact/Fermi-contact separation of the paramagnetic NMR shifts) and to propose an approach that can lead to more satisfactory results.
Experimental Details.
Syntheses. All chemicals and solvents (analytical grade) were obtained from chemical providers
and used without further purification. The potassium salts of the hydrotris(pyrazolyl)borate and hydrotris(3,5-dimethyl-1-pyrazolyl)borate ligands (Tp and Tp*) 34 and the paramagnetic PPh4[Fe(Tp)(CN)3] complex were obtained as previously described in the literature.35 Large
single crystals suitable for the PND experiment were directly obtained by slow evaporation of concentrated solution. Elemental analyses were determined by the microanalytical laboratory of ISCN, Gif-sur-Yvette. FT-IR spectra were collected in, the 400-4000 cm-1 range with a tensor 27 Bruker FT-IR spectrometer working in the ATR mode.
PPh4[Co(Tp*)(CN)3] . 3H2O. A solution of KTp* (4 mmol) in 80 mL in THF was added
dropwise to a solution of CoCl2 . 6 H2O, (4 mmol, 952 mg) under inert atmosphere. After stirring
mixture (1/2) was added to lead to a yellow-orange solution. After stirring overnight, the solution was filtered and left in air. Slow evaporation of the filtrate afforded yellow cubic crystals that were recrystallized from MeCN. Yield 68%. Characteristic stretching vibrations are measured at max = 2531 cm-1 (BH stretching) and 2133 cm-1 (CN stretching). This last vibration is indicative
of the cobalt redox state +III (CN > 2115 cm-1 for non-bridging CoIII-CN moieties). Other strong
and medium peaks are observed at 1547, 1482, 1434, 1416, 1314, 1209, 1106, 1063 cm-1. Elemental analyses for C42H48BPCoN9O3: calcd (%) C, 60.95; H, 5.85; N, 15.23. Found: C,
61.22; H, 5.65, N, 15.04. The isotopically enriched cyanido complexes were synthesized at the 1 mmol scale by following the same procedures and by using K13CN and KC15N (each 98% enriched, from Cortecnet, Voisins-le-Bretonneux, France) as starting material.
NMR Spectroscopy Measurements. All the solution and solid-state NMR spectra were
measured with Bruker Avance spectrometers. The solid-state NMR spectra were acquired using the magic angle spinning (MAS) technique, by rotating the sample at 54.74° respective to the magnetic field. The acquired spectra showed isotropic chemical shift, , and a spinning
sideband pattern, regularly spaced by the spinning rate, r. The chemical shift anisotropy (CSA)
tensor parameters were determined using the module “Solids Line Shape Analysis” from Bruker’s software package Topspin.
In the present work, we used the Haeberlen-Mehring-Spiess convention to describe the principal components of the Chemical Shift anisotropy tensor. 36,37 The experimental isotropic shifts are
, where , and are the principal components of the
chemical shift tensor [ordered as ]. Further tensor describing parameters include the anisotropy and the asymmetry .
The exact measurement of the paramagnetic chemical shift requires measuring a diamagnetic reference, with ideally the same structure. As our attempt to prepare the unknown diamagnetic PPh4[CoIII(Tp)(CN)3] complex was not successful, we synthesized the related
similar as the organic ligand has a small influence on the signals: δ(13C) = 135.1 ppm and δ(15N) = -83 and -78 ppm in [CoIII(CN)6]3- and δ(13C) = 136 ppm and δ(15N) = -80.2 ppm in
[CoIII(Tp*)(CN)3]-. Moreover, these differences are small compared to the overall large signal
shift measured in this work.
Samples of 15N- and 13C-enriched PPh4[CoIII(Tp*)(CN)3] and of 15N-enriched
PPh4[FeIII(Tp)(CN)3]·H2O were prepared using about 100 mg of ground crystals packed in a 4
mm diameter ZrO2 rotor. Their MAS-NMR spectra were recorded at different magnetic fields:
7.1 and 11.7 T for 13C (Larmor frequencies 75.5 and 125.8 MHz respectively) and at 9.4 T for
15
N (Larmor frequency of 40.6 MHz). The 15N MAS-NMR spectra of PPh4[FeIII(Tp)(CN)3]·H2O
were acquired at r = 6 and 10 kHz. The rotor-synchronized Echo-MAS sequence 90°- τ2 -180°
was used in order to remove baseline distortion. The 90° pulse length was 5.8 s and the recycling time was 2 s.
An attempt at recording the 13C MAS-NMR spectra of PPh4[FeIII(Tp)(CN)3]·H2O at 7.1 T with 4
and 2.5 mm diameter rotors (r = 14 and 34 kHz, respectively) was made, but due to the large
chemical shift anisotropy (up to several thousand ppm), higher spinning rates were necessary. The 13C-enriched PPh4[FeIII(Tp)(CN)3]·H2O sample was thus prepared packing about 10 mg of
dried ground crystals in a 1.3 mm diameter ZrO2 rotor. The 13C MAS NMR spectra were
recorded at different spinning rates of 60 and 65,5 kHz at 16.4 T (Larmor frequency 176.1 MHz). The one-pulse sequence was used with a single pulse excitation of 2.5 s and a recycling delay of 200 ms. Despite the large spectral width of 1.8 MHz used, several measurements were done by changing the emission frequency in order to localize the extremely shifted 13C paramagnetic signals. The spectral width was then adjusted to limit baseline distortion. The Echo-MAS sequence could not be used because the magnetic relaxation is too fast in that case. The baseline distortions were manually corrected. Data handling included reverse linear prediction after clipping the first data points, exponential multiplication up to the matched filter, and baseline correction.
The 15N and 13C chemical shifts were measured relative to the external references: adamantane ((13CH2) = 29.5 ppm relative to TMS38,39) and ammonium nitrate ((15NH4+) = 358.5 relative
The spectra were recorded at different spinning rates in order to identify the isotropic signals inside the sideband patterns. For each rate, the temperature was controlled inside the rotor by using nickelocene as internal reference. For all samples, microcrystalline powders of the complexes were thus mixed in a glove box with 3-5 % weight of nickelocene whose 1H NMR signal shift served as internal temperature standard. The isotropic chemical shift of nickelocene protons in function of the temperature is tabulated in the literature:41, 42
(1)
A proton spectrum was acquired before and after each 13C and 15N measurement in order to check the stability of the inner temperature during the measurement.
As the chemical shifts of the paramagnetic species depend on the temperature, the experimental isotropic shifts at the sample temperature T, the isotropic , were converted to the isotropic paramagnetic shifts, , by subtracting the isotropic shifts of the diamagnetic reference PPh4[Co(Tp*)(CN)3], . Since the spectra of the paramagnetic compounds were obtained at
slightly different temperatures, was converted to the respective value at the standard temperature 298 K following the Curie law.
Computational Details. The 2017’s release of the Amsterdam Density Functional (ADF43,44,45) software package was used to perform Kohn-Sham density functional theory (KS-DFT) single-point energy calculations. These calculations utilized the scalar all-electron zeroth-order regular approximation (ZORA46) along with the spin-unrestricted formalism. Several functionals were employed: the PBE47 , 48 functional (Perdew-Burke-Ernzerhof) from the generalized gradient approximation, the hybrid functional B3LYP49 , 50 (Becke, 3-parameters Lee-Yang-Parr) with 20% of exact exchange, and the hybrid functional PBE051,52with 25% of exact exchange. The influence of the atomic basis set on the calculated properties was also investigated by using either (i) the triple- polarized Slater-type orbital (STO) all-electron basis set with two sets of polarization functions for all atoms (TZ2P53), (ii) the NMR optimized STO JCPL54 basis set for the ligand atoms in combination with the TZ2P basis set for the iron center, and (iii) the JCPL
should not generate an unbalanced basis set as the valence basis functions in JCPL are derived from TZ2P. The electronic structure of the ground state (GS) was additionally investigated by using the Natural Bond Order55 (NBO 6.0) analysis as implemented in the ADF software package. The natural atomic populations as well as the Natural Localized Molecular Orbitals (NLMOs) were obtained from this analysis.
The magnetic properties, namely the EPR g-factors and the hyperfine coupling constants (HyFCCs) for the 1H, 15N and 13C, were calculated using the ESR56 and NMR57,58modules as implemented in ADF. The EPR g-factors were calculated using a quasi-restricted approach developed by van Lenthe, Wormer and van der Avoid (LWA).56 In this case, the spin-orbit coupling is treated variationally within the two-component spin-orbit ZORA formalism. Despite the lack of spin-polarization, this approach has shown to be efficient to properly reproduce the g-factors of Kramers doublet complexes. Introduction of the spin-polarization in the g-g-factors calculations has been tested in a previous work14 and did not converged to the correct ground state (see Table S13). The HyFCCs were calculated using a linear response (LR) approach.59In that scenario, a spin-unrestricted scalar relativistic (SR) ZORA calculation is first realized to obtain the SR electronic structure and then, the spin-orbit coupling is added a posteriori by a perturbative treatment. If necessary, the following nuclear g-factors were employed to convert the HyFCCs from atomic units to MHz: g1H = 5.5857, g13C = 1.4048 and g15N = -0.2831. Finally,
the NMR chemical shieldings of tetramethylsilane and nitromethane compounds used as references in the paramagnetic NMR calculations were obtained with the NMR module of ADF.60
The wavefunction calculations were performed using the Molcas 8.2 software package.61 In these calculations, the complete active space self-consistent field62 (CASSCF) approach and the complete active space perturbation theory at the second order63 (CASPT2) were used to treat the static and dynamic correlation effects, respectively. The CASPT2 calculations were performed using the multi-state approach with an imaginary shift of 0.2 in order to avoid intruder states in the wavefunction. The second-order Douglas-Kroll-Hess64,65,66,67 scalar relativistic Hamiltonian was used to treat the scalar relativistic effects in combination with the all-electron atomic natural orbital relativistically contracted (ANO-RCC) basis set from the Molcas library.68,69,70 The basis
sets were contracted to the triple- plus polarization (TZP) quality (Fe = 21s15p10d6f4g2h/6s5p3d2f1g; B, N, C = 14s9p5d3f2g/4s3p2d1f; H = 8s4p3d1f/2s1p).
The choice of the active space, namely CAS(9,12), was driven by the previous ab-initio study performed on the compound of interest,71 and on the results of previous ab-initio studies performed on related complexes with various transition metals.72 , 73 , 74 This active space corresponds to the five electrons of the Fe3+ ion distributed into the five 3d orbitals, augmented by five unoccupied 3d' orbitals in order to properly take into account the double-shell effect. Additionally, two doubly occupied ligand-based orbitals, spanning formally the eg irreducible
representation (irrep) in the Oh symmetry point group, were added. It was shown that these
ligand orbitals interact with the metal-centered 3d orbitals of corresponding symmetry in order to form combinations of bonding and antibonding molecular orbitals of character.
The calculations employed the state-averaged formalism at the SR level by taking into account one sextet, six quartet and 10 doublet spin states. The spin-orbit coupling (SOC) was then introduced within a state interaction among the basis of calculated SR states using the restricted active space state interaction (RASSI) approach.75Herein the SOC matrix is diagonalized using either the calculated SR CASSCF or SR CASPT2 energies. Therefore, in the manuscript the scalar and spin-orbit coupling results will be denoted as SCF/PT2-SR and SCF/PT2-SO, respectively.
The EPR g-factors were calculated according to Reference 76 as implemented in the RASSI module of Molcas, whereas the magnetic susceptibility calculations were performed using the Single-Aniso module of Molcas as detailed in Reference 77. Finally, the magnetic properties of [FeIII(Tp)(CN)3]- were analyzed using natural orbitals (NOs), natural spin orbitals (NSOs) and
spin magnetizations (muS(r)) that were directly obtained from the multi-configurational
wavefunctions that include SOC effects. The procedure to obtain these orbitals and densities is explained in the References 78, 79 and 80. The orbitals were then visualized with the graphical interface of the ADF software package.
(2)
is the diamagnetic contribution to the chemical shift (usually independent of T) in the absence of any influence from paramagnetism,83 here obtained from PPh4[CoIII(Tp*)(CN)3] (see
Supplementary Information). is the paramagnetic contribution to the experimental chemical shift and is solely due to the presence of unpaired electron(s). More specifically, the
term is the sum of a Femi-contact term ( ) and a pseudo-contact (or dipolar) term, .
The pseudo-contact chemical shift is due to a dipolar through-space interaction between the spin and electronic magnetic moments, and as a first approximation, it can be obtained from the following equation:83,84,85
- (3)
where r is the vector connecting the paramagnetic metal center and the probed nucleus, Δχax and
Δχrh and are the polar angles defining
the position of the probed nucleus with respect to the frame of the magnetic susceptibility tensor. Alternatively, the magnetic susceptibility can be expressed by using the spin-only formula. In that case the anisotropy is reflected in the main value of the g-tensor. For example, for S = ½ (low spin Fe(III) ion) with an axial symmetry, the isotropic can be expressed as:
(4)
In this formula, is the Boltzmann constant, T, the temperature, and are the main values of the g tensor, S is the electron spin quantum number, is the vaccuum permeability, , the Bohr magneton, and all are given in SI units. The value obtained from Equation (3) and (4) can be converted to ppm by a factor of 106. It is important to remember that the validity of these equations only holds if the spin density is localized at the metal center, i. e. no delocalization to other nuclei yielding contact shifts occurs. For instance, Benda et al. have shown that the point-dipole approximation could be safely used in the CoMMP-12 protein for atoms located beyond 8 Å of the paramagnetic center.86 For closer atoms, the point-dipole approximation breaks down and the estimation of the pseudo-contact term requires quantum calculations of the spin-dipole hyperfine coupling constant.
On the other hand, is the through-bond interaction called the Fermi-contact term. It is due to the interaction between the spin-density delocalized onto the probed atom and the nuclear
magnetic moment. In other words, it is correlated with the probability of finding the unpaired electron onto the nuclei, and it thus arises from the presence of spin density in the (mostly) valence s orbital of the nucleus.83,84 The isotropic Fermi-Contact hyperfine coupling constant,
, due to the through-bond interaction with the probed nucleus is linked to the isotropic contact
shift, by the equation (assuming an axial anisotropy):
(5)
where X is the gyromagnetic constant of the probed nucleus, F( ,D) is a function of the
components , of the g tensor and the zero-field splitting D. In the case of S = ½, one gets F( , D) = 1. This formula is valid when only one spin state is populated, and when the ground state
can be described by a spin quantum number, S. From there, the can be easily connected to spin-density located in the s orbitals ( ).27,32
It is worth underlying that, according to Equation 5, the sign of the NMR Fermi-contact term provides a straightforward access to the sign of the spin density at the probed nuclei. This allows probing the spin extension mechanisms from the metal ion to the ligands in paramagnetic species.83 Typically, two mechanisms can be considered.28 For the delocalization mechanism, the unpaired electron lies in a hybrid metal-ligand orbital and the spin density sign is conserved over all the atoms involved in the molecular orbital. For the spin polarization mechanism, the spin density sign alternates from one neighboring atom to the other and decreases exponentially.
Ab-Initio Paramagnetic NMR Calculations. The calculated 1H and 13C isotropic chemical shifts in this work are given with respect to tetramethylsilane (TMS), whereas the 15N isotropic chemical shifts are given with respect to nitromethane. The NMR shielding constants for the references were obtained at the Kohn-Sham density functional theory (KS-DFT) level using the same functional and basis set as used for the probe. The results of these calculations are given in Table S11 of the Supporting Information. Therefore, the calculated isotropic chemical shift ( ) in units of ppm for a given nuclei (i) with respect to the reference is obtained as:
where the NMR shielding constant of the probe (i) can be defined as a sum of two contributions and
, with the former corresponding to the ‘orbital shielding’ and being independent of the paramagnetism of the complex, and the latter corresponding to the paramagnetic chemical shielding constant. Depending on the nature of the compound of interest, the theory to properly calculate the paramagnetic NMR (pNMR) shielding tensor may take different forms. For more details, the reader is oriented to References 28, 87, 88, 89 and 90. In the case of a complex with a Kramers doublet GS, or a GS with a pseudo-spin = 1/2, which is well separated in energy from the excited states (ESs), i.e. the ESs are not thermally populated, the pNMR shielding tensor can be calculated as:87
(7)
with e, gN, N and kB associated to the Bohr magneton, the nuclear g-factor, the nuclear
magneton and the Boltzmann constant, respectively. In Equation (7), corresponds to the Zeeman coupling matrix and is calculated either using wavefunction theory or using KS-DFT, whereas is the hyperfine coupling matrix and is obtained from KS-DFT calculations (see the computational details). Such computational strategy has been already applied successfully on a large panel of transition metal complexes.91,92,93,94,95,96,97,98,99,100,101 In order to assemble the Zeeman g-tensors, the hyperfine coupling matrices and the orbital shielding, we have used the pNMRShift program developed by the Autschbach group.95,96 In addition to obtain the pNMR shielding tensor, the pNMRShift program allows its decomposition into the Fermi-contact (FC) and pseudo-contact (PC) contributions. The reader is reminded that in a non-relativistic framework the FC contribution is related to the amount of spin-density located at the nucleus of interest and is proportional to the scalar product gisoAiso in Equation (7). On the other hand, the
PC contribution corresponds to a dipolar coupling between the magnetic moments of the metal center and the nuclei (“spin-dipole” mechanism) that is proportional to the anisotropic part of the Zeeman and hyperfine interactions. In the case of a paramagnetic complex that exhibits no spin density delocalization on the ligand atoms, one can assume that the FC contribution tends to zero and only the PC term contributes to the pNMR shift. In that specific scenario, the origin of the paramagnetic NMR shift is purely dipolar and the PC term can be calculated considering a point-dipole approximation (as explained above). However, the extraction of the FC and PC
contributions from the pNMR chemical shifts is usually not straightforward as metal-spin density often leaks on the surrounding ligands. Additionally, relativistic effects, such as spin-orbit coupling (SOC), render more complex this separation of the chemical shifts by introducing anisotropic contributions into the FC term and isotropic contribution into the PC term via contribution into the calculated g-factors and hyperfine coupling constants.90
RESULTS
Solid-State 13C and 15N NMR Spectroscopy of PPh4[FeIII(Tp)(CN)3]·H2O
As the 13C and 15N spectra obtained with PPh4[FeIII(Tp)(CN)3]·H2O sample at natural abundance
did not yield to satisfactory signal-to-noise ratio and resolution, the compound was prepared by using KC15N and K13CN starting materials (see Supporting Information). We will focus in this section to solid-state spectra as the resolution obtained by MAS technique is much improved in comparison to that observed in solution. For comparison reason, a 13C NMR solution measurement is given in FigureS8.
The 13C MAS NMR spectra were acquired at 60 and 65.5 kHz and are shown in Figures 2 and S6. Superposition of the spectra allowed the determination of the isotropic shift ( = -3726 ppm).
Figure 2. Simulated (top) and experimental (bottom) 13C NMR spectra (16.4 T) of PPh4[FeIII(Tp)(CN)3]·H2O acquired at 60 kHz and T = 327.9 K.
The broad sideband features do not allow distinguishing non-equivalent cyanido ligands likely because the coupling with the 14N quadrupolar nuclei and the dipolar interaction with paramagnetic neighbor ions lead to a significant line broadening, as observed previously for other reported cyanido complexes.102,103 The line broadening may also arise from anisotropic bulk magnetic susceptibily and the existence of small gradient temperature in the rotor. However, a significantly better agreement between experimental and simulated spectra was obtained when assuming two different 13CN ligand in the ratio 2/1 (Figure 3). Note that the crystal structure and the 15N NMR studies (see below) show two similar cyanido ligand and a third different one.8
As already observed for hexacyanidometallates,4,5,103,104,105 the isotropic chemical shifts of the cyanido carbons are strongly shifted to lower frequency compared to their diamagnetic reference. The experimental isotropic shifts deduced from the simulated spectra exhibit high negative values, -3726 and -3755 ppm at 327.9 K, which unambiguously account for negative values of spin density on the carbon cyanido. These values, which are somewhat higher than those measured in Cs2K[FeIII(CN)6], prove that the FeC spin polarization is more important than the
direct delocalization mechanism, as it has been observed in previous studies of
Simulated 60 kHz
Experimental 60 kHz
hexacyanometallates.102, 106 This result is also fully consistent with the PND results and theoretical calculations (see below), which both indicate a negative spin density on the carbon atoms.
The parameters of the 13C chemical shift tensors are reported in Table 1. The presence of spin density does not affect the tensor symmetry, which remains strongly axial, as for the diamagnetic PPh4[CoIII(Tp*)(CN)3] model complex. In contrast the extension of the chemical shift anisotropy
(CSA) determined at 60 kHz is about 3000 ppm, which is tenfold larger than that of the diamagnetic PPh4[CoIII(Tp*)(CN)3] reference. The extension is also larger than that measured in
the octahedral Cs2K[FeIII(CN)6] (ca. 1400 ppm), which reflects a greater dissymmetry around the 13
C atoms.
As expected because of the higher distances from the paramagnetic source, the 15N NMR spectra exhibit a better spectral resolution. It has to be mentioned that the lower gyromagnetic ratio of
15
N is also improving the spectral resolution. The superposition of the 6 and 10 kHz spectra allows the determination of three clearly defined isotropic 15N signal at = 522, 502 and 474 ppm (Figures 3 and S7). These peaks can be ascribed to three different cyanido groups (determined by X-Ray diffraction analysis8) of the Fe(III) complex, although no specific attribution can be done. The positive paramagnetic contribution corresponds to a positive spin density perceived by the nitrogen nuclei. The result is consistent with previous paramagnetic NMR studies on hexacyanometallates and it is expected when both direct delocalization and spin polarization place positive spin density at the N atom.4,107,108
Figure 3. Simulated (top) and experimental (bottom) 15N MAS-NMR spectrum (9.4 T) of PPh4[FeIII(Tp)(CN)3]·H2O, δ(NiCp2) = -245.9 ppm (T = 307.1 K) and 6 kHz.
The 6 kHz simulated spectrum is shown in Figure 3. Interestingly, 15N spectra of this compound do not exhibit the same symmetry as that of the diamagnetic reference. Indeed, while the Co(III) complex exhibits strongly axial chemical shift anisotropy (CSA, see experimental section) tensors (mean asymmetry parameter = 0.087), the Fe(III) species clearly exhibits non-axial contributions, with ranging from 0.785 to 0.912.
The extension of the CSA amounts to ca.2000 ppm, which is slightly higher than that measured in the K3[Fe(CN)6] (ca. 1900 ppm) and Cs2K[FeIII(CN)6] (ca. 1600 ppm), indicating as for the 13
C atoms a greater anisotropy around the 15N atoms.
It is worth noticing that the CSA tensors of the 15N cyanido atoms in [FeIII(Tp)(CN)3]- have a low
symmetry (see Table 1). If the shift anisotropies are visualized by spheroids, they would be clearly prolate at C atoms and scalene (with three different axes) at N atoms. This contrasts with the axial symmetry of the 15N CSA tensor observed in both the diamagnetic [CoIII(Tp*)(CN)3]
-reference, and in the paramagnetic [FeIII(CN)6]3- parent complex. The lower symmetry observed
as compare to the [FeIII(CN)6]3- complex and to the strong magnetic anisotropy of that complex
as shown in our previous PND study.14
Table 1. Measured isotropic Chemical shifts ( , in ppm) and its tensor parameters ( in
ppm) of PPh4[FeIII(Tp)(CN)3]·H2O. The isotropic pNMR chemical shifts converted at 298K
( , in ppm) are also given for comparison.
[FeIII(Tp)(CN)3]- 13C 15N -3726 -3755 522 502 474 -5159 -5110 -356 -345 -380 -3016 -3081 401 579 512 -3003 -3074 1518 1273 1292 0.009 0.005 0.785 0.819 0.912 -4249 -4281 621 600 571
Experimental chemical shifts are given at 327.9 K (13C) and 307.1 K (15N) while the paramagnetic one is converted to 298 K (see Equation 1).
Figure 4. 1H NMR spectrum (9.4 T) of PPh4[FeIII(Tp)(CN)3]·H2O at 300 K (signals in the
diamagnetic region are due to the PPh4 counter ions, the solvent peak, and residual solvents).
While the 13C solution NMR spectrum of the enriched PPh4[FeIII(Tp)(CN)3]·H2O leads to broad
features in comparison to solid-state spectra (Figure S8), the opposite situation occurs with the proton NMR (Figure S9) because of the proton-proton dipolar coupling. In contrast, in solution molecular tumbling yields well resolved isotropic signals (Figure 4). The proton signal assignment reported in Figure 4 is based on the intensity of the signal and their half widths. The protons that are close to the paramagnetic source are expected to be broader because of the dipolar contribution to the relaxation. The paramagnetic chemical shifts were obtained by taking as a reference the diamagnetic complex [Zn(Tp)2].
Spin Density from NMR Measurements.
In order to extract the spin density values, the pseudo-contact contribution ( ) to the paramagnetic chemical shift was first calculated using Equation (4). The distances between the paramagnetic metal ion and the probed nuclei (rj) were directly extracted from the crystal
structure data.8 As the 13C and 15N signal cannot be assigned to specific cyanido ligand, we used the extrema values of rj to estimate the dipolar contribution range: rj values range from ca. 1.91
Å to 1.93 Å for FeIII-C and from 3.04 Å to 3.07 Å for FeIII-N. For the proton signals, as a complete assignment of the 1H spectrum was obtained, specific rj values were extracted for each
proton and used for the calculation. The gi values, which are also required to estimate the
pseudo-contact contribution, were already reported in a previous EPR measurement:14 = 1.1, = 0.57 and = 3.7. It is worth mentioning that the g tensor values were obtained at 5 K and thus reflect the magnetic anisotropy at low temperature. In contrast, NMR experiments are performed near room temperature, where anisotropy should be weaker (for example the g tensor anisotropy is much smaller at 100 K than at 20 K in K3[Fe(CN)6]).109 In order to have a better
approximation of the magnetic anisotropy at 298 K, we thus estimated the pseudo-contact contribution by using the calculated magnetic susceptibility, which led to = 2.05, = 1.98 and = 4.17 at 300 K (see Supporting Information). A comparison of calculations using either low-temperature EPR data or the simulated gii value at 298 K is given in Table 2.
Here we benefit from our previous PND study on single crystals of PPh4[Fe(Tp)(CN)3] H2O,
Fe-B axis.14 Thus the angles θj (the angle between magnetic axis and rj) are also known in the
present study. The angles range from 124.5° to 127.3° for 13C and from 122.6° to 127.1° for
15N. There is a significant influence of and
on the Fe-13C and Fe-15N dipolar contribution of PPh4[FeIII(Tp)(CN)3]·H2O. In principle, an unpaired electron located on the Fe(III) ion can
induce a dipolar contribution up to ca. +640 ppm ( = 90°) or -320 ppm ( = 0°) at the cyanido carbons, ca. 1.92 Å away. Since nitrogen lies farther from the Fe(III) ion, the pseudo-contact contributions to the paramagnetic chemical shift is smaller, but it can still range from +158 ppm to -79 ppm (using low temperature EPR data). However, in the case of the [FeIII(Tp)(CN)3]
-complex, the geometry is fortuitously favorable with angles close to 124° resulting in weak value of (3cos2θ-1), and weak value of the pseudo-contact chemical shifts. Using the experimental data mentioned above, the pseudo-contact contributions (within the point dipole approximation) of the 13C cyanido atom are in the range ca. -11.6 to +32.8 ppm, while those of the 15N cyanido atom range from -9.9 to +7.3 ppm. The use of the simulated gii values, derived
from the calculated magnetic susceptibility at 298K, slightly affects these ranges (see Table 2). Overall these values remain moderate in comparison to the experimental chemical shifts and have no impact on the spin density estimates (see Table 2 and details below). In contrast, the pseudo-contact contributions of the protons (calculated using the exact location of the nuclei with respect to the magnetic axis and the metal ion) are very dependent from one proton to the other, and can be very important in comparison to the experimental chemical shift (Table 2). The use of either the low-temperature EPR data or the simulated gii values at 298 K leads to
significantly different values of the dipolar contribution.
For all the nuclei, the contact term is further deduced by subtracting the pseudo-contact contribution from the paramagnetic chemical shift (see Equation 2). Since chemical shifts of paramagnetic species are strongly dependent upon temperature and since the spectra were acquired at a different temperature, direct comparison of raw data cannot be performed. The chemical shifts have to be rescaled to match to a common temperature for all the data. As the Curie law is valid near room temperature for the [FeIII(Tp)(CN)3]- complex, one can calculate the
corresponding isotropic Fermi-contact contribution to the chemical shift at 298 K:108,110
Here is 136 ppm for the 13C and -80.3 ppm for the 15N. As the 13C and 15N NMR signal cannot be specifically assigned to a given atom, the spin density calculation were carried out by taking into account two extreme values of the experimental chemical shift. The two extreme values of the pseudo-contact contribution were then subtracted to the paramagnetic chemical shift values to obtain the largest spin density range. The spin density (in a.u.-3) and the unpaired electron fraction are reported in Table 2. Here, for the 13C and 15N nuclei, we assumed that the spin is in the valence 2s orbital. The involvement of 1s orbitals through cross terms with 2s orbitals is not excluded, but that should not affect the general conclusions.
Table 2. Isotropic Pseudo-Contact ( ), Fermi-Contact ( ) chemical shifts, s orbital spin density value (s) of the 13C and 15N atoms (2s orbital), 1H atoms (1s orbital) and fraction of
electron in s orbital (fs) of compound PPh4[Fe(Tp)(CN)3]·H2O.(a)
13 C 15N H3 H4 H5 BH (b) (c) -11.6 / +36.5 -9.9 / +7.3 -60.70 -4.60 13.90 64.80 -8.6 / + 27.0 -7.4 / +5.4 -44.90 -3.40 10.30 47.80 (b) (c) -4317 / -4237 563 / 630 1.27 -7.73 -24.20 -35.20 -4308/ -4240 570 / 620 -14.60 -8.93 -20.60 -18.20 s (b) -0.0197 / -0.0200 0.0026 / 0.0029 5.7 10 -6 -36.2 10-6 -112 10-6 -162 10-6 s (c) -0.0197 / -0.0200 0.0026 / 0.0029 -72.0 10-6 -41.7 10-6 -94.4 10-6 -80.0 10-6 fs (b) fs (c) -0.0044 / -0.0045 0.00033 / 0.00037 +1.3 10-6 -8.03 10-6 -25.1 10-6 -35.2 10-6 -0.0044 / -0.0044 0.00033 / 0.00037 -15.2 10-6 -9.28 10-6 -21.4 10-6 -20.4 10-6 (a) Chemical shifts are given in ppm for T = 298K, and spin density values in (a.u.)−3; (b) estimates obtained by using gii values from EPR at 5K; (c) estimates obtained by using the simulated gii value at
298 K and Equation S9.
As the pseudo-contact contribution is very weak for both 13C and 15N cyanido atoms, the use of low-temperature EPR data or simulated gii values has no actual impact on the results. It is
observed by NMR that the [FeIII(Tp)(CN)3]- complex exhibits negative spin density in the
cyanido carbon 2s orbitals, and a positive one at the cyanido nitrogen atoms. This observation is in agreement with the PND study on PPh4[FeIII(Tp)(CN)3]·H2O and the theoretical calculations
(vide infra). This points to a dominant spin-polarization mechanism from the paramagnetic ion to the cyanido carbon atoms (negative spin density) and on the contrary a spin-delocalization mechanism to the cyanido nitrogen atoms (positive spin density) as observed in the hexacyanometallates.31,102 On one hand, the polarization mechanism of the M-C link (z axis) is consistent with the retained axial symmetry of the 13C MAS-NMR spectra. On the other hand,
the low symmetry (rhombic) of the 15N CSA tensors in the [FeIII(Tp)(CN)3]- complex suggests
that the two orthogonal t2g-px t2g-py delocalization pathways are not equivalent (in contrast with
the [FeIII(CN)6]3- complex). The axial symmetry of the 15N tensor observed in the diamagnetic
model also confirms that the lower symmetry of the tensor arises from the presence of the paramagnetic contribution to the CSA.
The mean electron spin density located on the 2s orbital of cyanido carbon atoms of [FeIII(Tp)(CN)
3]-, ca. -0.020 a.u.-3 is close to that previously measured on the [FeIII(CN)6]3- (ca.
-0.025 a.u.-3), suggesting that the polarization of the Fe-C bond is not significantly affected by the replacement of the cyanido groups by the Tp ligand. These values are also in good agreement with those obtained from PND and DFT analysis (see below).
In absolute values, the electron spin density located in the 2s orbitals of the cyanido nitrogen atoms, ca. 0.0028 a.u-3, is smaller than that found by 15N MAS-NMR in the 2s orbitals of the nitrogen atoms of the hexacyanometallates (ca. +0.0064 a.u-3). This suggests a less favorable orbital overlap between the * orbitals of the cyanido fragments and the iron orbitals of the [FeIII(Tp)(CN)3]-. The spin density values are also qualitatively coherent with the present PND
results and theoretical calculations (see below).
The spin density on the C and N atoms of the Tp ligand could not be extracted as no 13C or 15N NMR signals were detected because of their low abundances (non enriched Tp ligand). However, spin densities values measured on the proton nuclei have been estimated. These values are much weaker than those measured on the cyanido ligand. This is as expected, because the protons are localized at remote position on the organic ligand and because the spin density is transmitted from the C pyrazolyl atoms to the protons through a polarization mechanism. One could also expect weaker spin density on the Tp ligand in comparison to the cyanido ones, because of the weaker covalency of the Fe-N(Tp) bonds (CN is a strong -donor -acceptor ligand while Tp is a donor ligand). Finally, it is worth underlying than the calculated spin density values obtained by NMR on the protons depend on the calculation of the dipolar contribution. As shown in Table 2, the spin density values obtained by using the g// and g obtained from EPR at 5 K, and those
that are obtained from theoretical simulation (see Tables S12 and S19 of the supplementary materials) are quite different, revealing the importance of the magnetic anisotropy in this model.
First Principle Calculations
Electronic Structure Calculations. The electronic structure of [FeIII(Tp)(CN)3]- was previously
described by Ridier et al.14 and is therefore only briefly discussed here.Considering at first sight an octahedral environment around the Fe(III) ion, the scalar relativistic (SR) GS corresponds to a spin-doublet state 2T2g with formally an t2g5eg0 electronic configuration (see Figure 5). However,
the trigonal distortion in [FeIII(Tp)(CN)3]- lifts the degeneracy of the 2T2g state into two orbitally
degenerate spin-doublet states 2E and into one non-degenerate 2A state. As seen in Table S10, the two 2E states are found to be the lowest in energy at the PT2-SR level and are separated from the excited state 2A by a large energy gap of ca. 2300 cm-1. It is worth mentioning that the lowest spin-quartet and spin-sextet states are found at 9356 and 13747 cm-1 above the GS, respectively. Introduction of the spin-orbit coupling (SOC) does not drastically change the electronic structure. By symmetry, the SR 2E states are allowed to mix with each other and give rise to two Kramers doublets separated from each other by 628 cm-1. The SOC barely affects the energies of the quartet and sextet states, which remain both extremely disfavored energetically.
Figure 5. Schematic representation of the electronic configuration of the GS of [FeIII(Tp)(CN)3]-
in the case of a perfectly octahedral complex (left, Oh) and for a distorted structure spanning the
C3 symmetry point group (right). The set of e(2) orbitals correspond to the * orbitals in Figure
7.
The natural orbitals (NOs) of the SO GS of [FeIII(Tp)(CN)3]- are shown in Figure S12 along with
their occupation numbers. The largest occupation numbers (1.96 electron (e)) correspond to the NOs labeled . As already noted for transition metal complexes with cyanido ligands,111,112,113 the 3d metal-centered orbitals spanning the e irreducible representation (eg in the parent Oh
symmetry point group) can form a covalent bond of character with the 2p orbitals of the surrounding ligands. The bonding combination is formally doubly occupied whereas the
antibonding one (*) is vacant. The non-integer occupation numbers of the and * NOs reveal here the correlation effects that take place between these orbitals. As expected from Figure S12, the NO belonging to the a symmetry is found almost doubly occupied and corresponds to a 3dz2 orbital. Finally, the unpaired electron is distributed into the two non-bonding e orbitals. It is worth mentioning that in a strictly trigonal environment, the occupation of these two NOs would be equivalent and equal to 1.5 e. However, due to a slight symmetry breaking the occupation numbers are 1.66 and 1.30 e, respectively. This distribution corresponds to the mixing of the two SR electronic configurations 2E into the SO wavefunction as seen in Table S10.
Paramagnetic NMR Calculations. The isotropic ligand chemical shifts (calc) for the 13C and
15
N atoms of the cyanido ligands were calculated using Equation (7) and the principal results are shown in Figure 6. Additional data are given in Tables S17 and S18, while the calculated proton chemical shifts are given in Figure S16 of the SI. Considering the complexity of calculating properly ligand chemical shifts in paramagnetic complexes, the calculated data are overall found in satisfactory agreement with the experimental data. Indeed, the calculations were able to reproduce the sign of the experimental chemical shifts and the relative large magnitude between the 13C and 15N shifts. As shown in Figure 6, the calculated chemical shifts strongly depend on the values of the g-factors and HyFCCs used in Equation (7). The use of g-factors from the PT2-SO calculations leads to larger chemical shifts compared to the ones obtained at the DFT level. These results are consistent with the increase of the anisotropy factor (g) and isotropic values
(giso) when using the PT2-SO results (see Table S13). Additionally, the use of the hybrid
functionals B3LYP and PBE0 instead of the GGA functional PBE leads to an increase of the 13C HyFCC and a decrease of the 15N HyFCCs (see Table S14). Overall, at our best level of calculations, i.e. the use of the g-factors from the PT2-SO calculations in combination with the HyFCCs obtained at the PBE0/JCPL level, the averaged calculated chemical shifts for the 13C and 15N atoms are of -3836 and +875 ppm, respectively. These theoretical chemical shifts are in relatively good agreement with the experimental ones and tend to confirm the spin-density distribution observed experimentally.
hyperfine coupling constant ASD, in opposition to the point-dipole approximation. This difference is expected to strongly impact the calculation of the pseudo-contact chemical shifts.114 For the 13C atoms, the large paramagnetic shifts arise largely from a contact contribution with calculated larger than 4500 ppm (for T = 298K). These contact contributions are only slightly counterbalanced by a small pseudo-contact contribution with opposite sign ( -240 ppm). The large FC term, in combination with the large isotropic HyFCCs calculated for the 13C, suggests the presence of an important negative spin density at the carbon nuclei. On the other hand, the contributions of the pNMR shift of the 15N atoms strongly decrease in magnitude and are of opposite sign than those calculated for 13C. This behavior is in good agreement with a positive spin density of smaller magnitude at the nitrogen nuclei, as observed experimentally. Interestingly, the pseudo-contact contributions are calculated larger for 15N than for 13C (see Table 3), despite the fact that the carbon atoms are closer to the paramagnetic center. Indeed, if one assumes a purely dipolar mechanism within a point-dipole approximation, the pseudo-contact term should decrease with a factor of (1/r3), as the C and N atoms exhibit similar polar angles with respect to the magnetic axis (see Equation (3)).
The difference in the FC / PC separation of the pNMR shifts between the ab-initio results and the point-dipole approximation results from the different definitions of the term. In the ab-initio calculations, the magnitude of is proportional to the anisotropic part of the Zeeman and hyperfine coupling matrices, and not only to the metal-ligand distance. Therefore, if the calculated isotropic HyFCCs for 13C are much larger than those for 15N, giving larger contributions for the carbon atoms, on the other hand, the HyFCCs for 15N are more anisotropic than those obtained for 13C, leading to stronger contributions for the nitrogen centers. This result could suggest that the spin density distribution at the nitrogen nuclei is less spherical than the spin density at the carbon nuclei.
Figure 6. Calculated isotropic chemical shifts (calc in ppm) for the 13C and 15N atoms of the cyanido ligands in [FeIII(Tp)(CN)3]- using Equation (10). The chemical shifts are given as a
function of (i) the g-factors (CAS or KS-DFT results of Table S13), (ii) the functional used to calculate the HyFCCs (PBE, B3LYP and PBE0 results of Table S14), (iii) the basis set used to calculate the HyFCCs (TZ2P and JCPL results of Table S14). The averaged experimental chemical shifts (cxp) are also given for comparison (T = 310 K for nitrogen atoms and T = 334 K for carbon atoms).
Table 3. Calculated isotropic paramagnetic chemical shifts (pNMR) for the 13C and 15N atoms of the cyanido ligands obtained using the PBE0/JCPL KS-DFT results for the HyFCCs and the PT2-SO results for the g-factors. A breakdown of pNMR is given in term of Fermi-Contact ( ) and Pseudo-Contact ( ) contributions. For comparison, the calculated pseudo-contact shifts (PC) using Equation (3) are given. (a)
PC (b) PC (c) C1 -4863 -5110 247 -10 -17 N1 1102 75 1027 -10 -10 C2 -4337 -4557 220 55 27 N2 702 47 654 6 1 C3 -4303 -4565 262 76 85 N3 1082 151 930 10 15 a
Spin Density from First Principle Calculations. The spin magnetization (mzS(r)) along the z
magnetic axis for the SO GS of [FeIII(Tp)(CN)3]- is shown in Figure 7. The reader is reminded
that in the absence of the SOC, mzS(r) corresponds to the usual spin density, and that the z
magnetic axis in [FeIII(Tp)(CN)3]- is oriented along the Fe-B direction. The spin magnetization is
principally localized on the iron center with a large blue density arising from the occupation of the partially filled 3d orbitals. The corresponding spin expectation value < Sz > = 0.48 is close to
the one expected for a SR spin-doublet with MS = 1/2, confirming the small mixing with other
spin states via SOC. Additionally, important negative magnetizations (i.e. the -type orange lobes in mzS(r)) are calculated on the carbon atoms of the CN ligands, whereas small positive
spin magnetizations (i.e. the -type blue lobes) are found on the nitrogen atoms. This pattern in mzS(r) is characteristic of transition metal complexes with cyanido ligands,102 and can be
rationalized by studying the natural spin orbitals (NSOs) and their spin populations. As seen in Figure 7, the non-bonding 3d NSOs of e symmetry have the largest positive spin populations, leading to the large positive magnetization on the metal center. Furthermore, these two NSOs exhibit little metal -back donation (spin-delocalization) into the * orbitals of the CN ligands,113,115 which gives rise to the small positive magnetization on the nitrogen atoms. On the other hand, the small positive spin populations of the NSO and the equivalent negative spin populations in the *, reveal the spin-polarization effect that takes place along the covalent Fe-C bonds and leads to a sizable -type negative spin magnetization on the carbon atoms. This distribution pattern of the spin-density is consistent with the 13C and 15N NMR measurements and confirmed by the PND analysis as detailed below.
Figure 7. Selected natural spin orbitals (isosurface values = ± 0.03 au.; blue = positive and
orange = negative) and their spin populations for the SO GS of [FeIII(Tp)(CN)3]- using the
doublet component. The associated spin magnetization mzS(r) is also given with isosurface
values of ± 0.005 au. CAS(9,12)PT2-SO results.
The SR-ZORA spin density obtained with the PBE0 functional (PBE0(r)) is also shown in Figure 8, and the associated atomic spin densities are given in Table S11 for the different functionals used. The comparison with the SO spin magnetization reveals that KS-DFT calculations are able to reproduce properly the nature of the GS with a similar shape of the spin density at the iron center. Moreover, a similar pattern is also found on the cyanido ligands, but the magnitude of the delocalization on the nitrogen atom, and the magnitude of the spin-polarization on the carbon atoms are much larger at the KS-DFT level than with CAS calculations. As shown in Figure S13 and in Table S11 of the SI, the use of different functionals does not strongly alter the distribution of the spin density. A slight decrease of the spin-delocalization on the nitrogen atoms is calculated when going from PBE to PBE0. This behavior is expected as the delocalization error inherent to KS-DFT calculations should decrease with the increase of percentage of exact exchange in the functional. On the other hand, the negative atomic spin density on the carbon atoms increases in magnitude when using hybrid functionals
by the increase of the ligand-to-metal donation from the CN- ligands toward the Fe(III) ion. Indeed, the natural localized molecular orbitals (NLMOs) for each of the Fe-C bonds are depopulated in the spin-NLMOs compared to the spin-NLMOs (0.71 vs. 0.95 e with PBE0 in Figure S14), leaving an excess of spin and hence, a large negative spin density.
Finally, a breakdown of the atomic spin density on the cyanido ligands in term of orbital contributions is given in Table S12 of the SI. Interestingly, the calculations give an averaged 2s spin density of 0.017 e on the carbon atoms, which is very close to the experimental value of -0.020 e (see Table 2) deduced from NMR measurements. On the other hand, the 2s spin density at the nitrogen nuclei is of +0.0006 e, much smaller than the +0.0030 e deduced from the NMR measurements, explaining the large differences in the Fermi-contact contributions. Interestingly, the spin density in the 2s orbital represent ca. 45 % of the total atomic spin density for the carbon atoms, whereas for the nitrogen ones it only represents 3 to 4 % of the atomic spin density. As visible in Figure 7, the spin density at the nitrogen atoms is mostly located in the 2p orbitals. This generates a large anisotropy in the HyFCCs of the 15N, which could be responsible of the large deviations in the FC / PC separations compared to the deductions made from the experimental measurements.
Polarized Neutron Diffraction. Polarized neutron diffraction on a paramagnetic single crystal
gives a direct access to the value of the induced magnetization density at each point of the crystal cell, a magnetic field being applied in order to align all the magnetic moments in the crystal. Therefore, this technique permits to access to the magnetization density distribution over the whole molecule in the case of a molecular crystal.
The experimental quantity measured by PND is the flipping ratio of each Bragg reflection, which is the ratio between the diffracted intensities and for an incident beam with vertical polarization, up and down respectively. It is related to the nuclear and magnetic structure factors. The flipping ratio measurement permits to determine the experimental magnetic structure factor for the Bragg peaks with scattering vector , providing that the nuclear structure is known. Therefore PND gives an access to the magnetization density by Fourier summation of the FM’s:
The magnetization density is the sum of the pure spin contribution and an orbital contribution mainly due to the 3d transition metal center, which has to be estimated in order to reach the pure spin density. However, as the Fourier summation is limited in the experiment to a finite number of Bragg peaks, the analysis of the experimental data is performed using a model for the spin density, the parameters of which are refined on the basis of the experimental data. In this model the spin density is written as the sum of independent atomic spin densities. For the atomic spin density located on the Fe atom, a 3d orbital model developed on dz2, dx2-y2, dxz, dyz and dxy basis
functions was used. For the atoms of the ligands, spherical atomic densities were assumed.116
Spin Density from PND. In order to validate the spin density map drawn from the combination
of the NMR measurements and of the theoretical calculations, polarized neutron diffraction measurements were performed at 2 K under a magnetic field of 5 Tesla on a single crystal of PPh4[Fe(Tp)(CN)3]-H2O in order to have an experimental picture of the spin density in this
complex. The results of the final PND data refinement are reported in Table S8 and the experimental spin populations, after normalization to 1, are compared to the one obtained from the SR KS-DFT calculations. The Fe spin population was refined together with four of the five ai
orbital coefficients of Equation (S8) (one coefficient must be fixed because of their relationship trough the normalization condition) in addition to the C and N spin populations up to Fe second neighbors. A goodness of fit of 1.95 was obtained for the refinement of 20 parameters on the basis of 297 flipping ratios with | Robs-1 | > 3(Robs). The agreement factor on | R-1 |, i.e. on the
difference of the flipping ratio to 1, is equal to 22.3 %. The experimental spin populations for Fe and for the C and N atoms, expressed in Bohr magnetons, are reported in first column of Table S8. For the Fe atom, the local induced magnetic moment is given by the sum of the orbit (0.42 B) and spin (0.83B) populations. For all other atoms, the induced magnetic moments are equal
to the experimental spin populations. The sum of the induced magnetic moments over the molecule is equal to 1.13 B, and compares extremely well with the calculated magnetic moment
of 1.125 B (see Figure S14) obtained at the PT2-SO level. This value is, however, slightly
smaller than the magnetization equal to 1.38 B, in the experimental conditions of the PND
experiment, i.e. at 2K under an applied field of 6T parallel to the c* axis (see Figure S11). The normalized pure spin populations reported in Figure 8 caption and in second column of Table S8
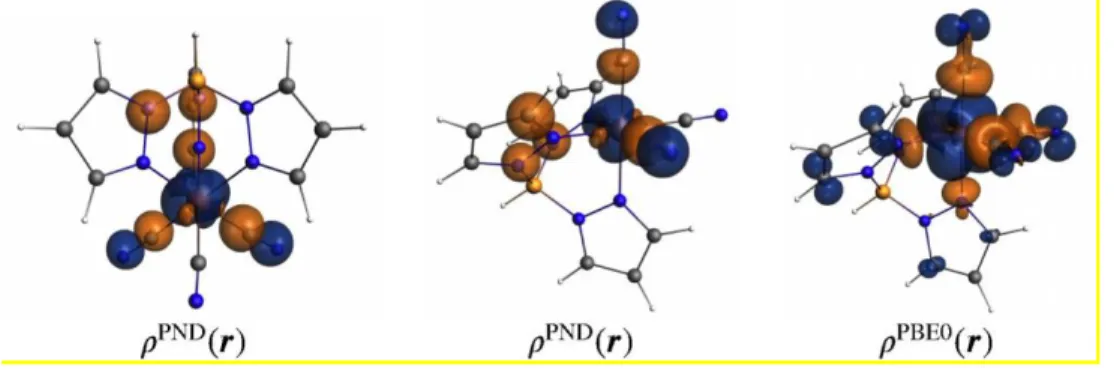
populations compare extremely well with the spin populations obtained at the KS-DFT level. Additionally, a plot of the experimental spin density is shown in Figure 8 and can be directly compared with the theoretical plots. In both cases, one can observe a strong spin-polarization mechanism on the carbon atoms of the cyanido ligands and a less intense spin-delocalization mechanism on the nitrogen atoms.
Figure 8. (left and middle) Plots of isosurface of the spin density determined by PND (PND(r))
and obtained by integration along the x direction of the local coordinate system. Isosurface values = ± 0.01 au. Only the experimental spin densities with magnitudes larger than the error bar are depicted. Normalized spin population (e): Fe = 1.251(38); C1 = 0.089(58); C2 = -0.063(72); C3 = -0.117(69); N1 = 0.075(54); N2 = 0.020(58); N3 = 0.110(52). (right) Additionally, the KS-DFT spin density (PBE0(r)) obtained with the functional PBE0 is shown for
comparison. isosurface values of ± 0.005 au.
DISCUSSION
In this paper, we report the first combined experimental and theoretical study that uses NMR spectroscopy, PND analysis and ab-initio calculations to firmly probe the spatial distribution of the spin density in a paramagnetic compound, namely the [FeIII(Tp)(CN)3]- building block. Each
experimental technique has its own specificities and shows pros and cons. While PND is a direct technique that gives access to a map of the magnetization density in the crystal cell, and therefore to the magnetic moment on the paramagnetic metal center, NMR provides an indirect access to the spin density delocalized on the coordinating ligands. Additionally, the sensitivities of the two techniques are quite different. NMR spectroscopy is extremely sensitive to small amounts of spin density localized on remote position of the ligands, in particular on protons. For example, a contact term of 10 ppm in the proton spectra of an Fe(III) low-spin species such as
![Figure 1. Molecular representation of the building block [Fe III (Tp)(CN) 3 ] ¯ . (Color scheme: green for Fe, blue for N, grey for C, pink for B, white for H.) The magnetization axis c* used in PND measurements is represented in red](https://thumb-eu.123doks.com/thumbv2/123doknet/7769470.256608/4.918.303.612.478.743/figure-molecular-representation-building-color-magnetization-measurements-represented.webp)
![Figure 2. Simulated (top) and experimental (bottom) 13 C NMR spectra (16.4 T) of PPh 4 [Fe III (Tp)(CN) 3 ]·H 2 O acquired at 60 kHz and T = 327.9 K](https://thumb-eu.123doks.com/thumbv2/123doknet/7769470.256608/16.918.229.694.108.492/figure-simulated-experimental-nmr-spectra-pph-iii-acquired.webp)
![Figure 3. Simulated (top) and experimental (bottom) 15 N MAS-NMR spectrum (9.4 T) of PPh 4 [Fe III (Tp)(CN) 3 ]·H 2 O, δ(NiCp 2 ) = -245.9 ppm (T = 307.1 K) and 6 kHz](https://thumb-eu.123doks.com/thumbv2/123doknet/7769470.256608/18.918.203.722.102.481/figure-simulated-experimental-mas-nmr-spectrum-pph-nicp.webp)
![Table 1. Measured isotropic Chemical shifts ( , in ppm) and its tensor parameters ( in ppm) of PPh 4 [Fe III (Tp)(CN) 3 ]·H 2 O](https://thumb-eu.123doks.com/thumbv2/123doknet/7769470.256608/19.918.127.788.272.504/table-measured-isotropic-chemical-shifts-tensor-parameters-pph.webp)
![Figure 5. Schematic representation of the electronic configuration of the GS of [Fe III (Tp)(CN) 3 ] - in the case of a perfectly octahedral complex (left, O h ) and for a distorted structure spanning the C 3 symmetry point group (right)](https://thumb-eu.123doks.com/thumbv2/123doknet/7769470.256608/24.918.106.811.605.764/schematic-representation-electronic-configuration-perfectly-octahedral-distorted-structure.webp)
![Figure 6. Calculated isotropic chemical shifts ( calc in ppm) for the 13 C and 15 N atoms of the cyanido ligands in [Fe III (Tp)(CN) 3 ] - using Equation (10)](https://thumb-eu.123doks.com/thumbv2/123doknet/7769470.256608/27.918.200.712.111.483/figure-calculated-isotropic-chemical-shifts-cyanido-ligands-equation.webp)
![Figure 7. Selected natural spin orbitals (isosurface values = ± 0.03 au.; blue = positive and orange = negative) and their spin populations for the SO GS of [Fe III (Tp)(CN) 3 ] - using the doublet component](https://thumb-eu.123doks.com/thumbv2/123doknet/7769470.256608/29.918.110.820.107.505/figure-selected-orbitals-isosurface-positive-negative-populations-component.webp)