HAL Id: hal-00863281
https://hal.sorbonne-universite.fr/hal-00863281
Submitted on 18 Feb 2015HAL is a multi-disciplinary open access archive for the deposit and dissemination of sci-entific research documents, whether they are pub-lished or not. The documents may come from teaching and research institutions in France or abroad, or from public or private research centers.
L’archive ouverte pluridisciplinaire HAL, est destinée au dépôt et à la diffusion de documents scientifiques de niveau recherche, publiés ou non, émanant des établissements d’enseignement et de recherche français ou étrangers, des laboratoires publics ou privés.
Control of the visible and UV light water splitting and
photocatalysis of nitrogen doped TiO2 thin films
deposited by reactive magnetron sputtering
Houssam Fakhouri, Jérôme Pulpytel, Wilson Smith, Alireza Zolfaghari,
Hamid Reza Mortaheb, Fateme Meshkini, Reza Jafari, Eliane Sutter,
Farzaneh Arefi-Khonsari
To cite this version:
Houssam Fakhouri, Jérôme Pulpytel, Wilson Smith, Alireza Zolfaghari, Hamid Reza Mortaheb, et al.. Control of the visible and UV light water splitting and photocatalysis of nitrogen doped TiO2 thin films deposited by reactive magnetron sputtering. Applied Catalysis B: Environmental, Elsevier, 2014, 144, pp.12-21. �10.1016/j.apcatb.2013.06.028�. �hal-00863281�
Control of the Visible and UV Light Water Splitting and
Photocatalysis of Nitrogen Doped TiO
2Thin Films Deposited
by Reactive Magnetron Sputtering
Houssam Fakhouri1,3*, Jerome Pulpytel1,3*, Wilson Smith1, Alireza Zolfaghari2, Hamid Reza Mortaheb2, Fateme Meshkini2, Reza Jafari2
, Eliane Sutter
3and Farzaneh Arefi-Khonsari
1,31 Laboratoire de Génie des Procédés Plasma et Traitement de Surface, 11 Rue Pierre et Marie Curie, 75231 Paris-France
2 Chemistry and Chemical Engineering Research Center of Iran, Tehran- Iran
3 CNRS, UPR15, Laboratoire Interfaces et Systèmes Electrochimiques, 75005 Paris- France
* Corresponding author.
E-mail addresses: jerome.pulpytel@upmc.fr (J Pulpytel), houssam-fakhouri@enscp.fr (H Fakhouri)
Phone: +33 147276823
Abstract
N-doped TiO2 thin films have been prepared by reactive RF magnetron sputtering at different pressures and
with different compositions using a dual reactive gas mixture of nitrogen and oxygen. The morphological, optical, photo-electrochemical and photocatalytic properties have been studied in order to investigate the white light and visible light photoactivities of the films. Significant control over the band gap energy in the films was achieved by varying the deposition parameters. Photoelectrochemical characterization revealed improved white light photocurrent generation in nitrogen doped films prepared at low pressures. However, the visible light photocurrent generation showed improvement for all deposition pressures, and changed accordingly with the nitrogen incorporation. Photocatalytic measurements of a common chemical pollutant NMP (N-Methyl-2-pyrrolidone) under different irradiation conditions provided evidence of improved photoactivity for samples prepared at high pressure, due to the increased active surface area and optimal nitrogen doping levels. Overall, this study showed a simple method to produce highly controllable nitrogen doping in different sites within TiO2
showing improved visible light photoactivity and photo induced pollutant degradation. More interestingly, by investigating the effect of different nitrogen sites in nitrogen doped TiO2, we have shown that the optimized
conditions for photocatalysis do not correspond to those for water splitting.
1. Introduction
TiO2 has shown extensive utilization in photocatalysts, dye-sensitized solar cells and smart-surface technologies. However, its use is limited to UV activation, due to its large band gap energy and relatively short electron-hole pair lifetime. Many attempts have been made to address these two issues with varying success [1]. The primary efforts in extending the absorption range in TiO2 from the UV range to the visible spectrum have focused on doping with non-metals. It has been reported that the band gap energy of TiO2 could be narrowed by anion doping due to the mixing of the p states of the doped anion (N, S, C) with the O2p states of TiO2, that could shift the resulted valence band edge upwards [2-3]. Asahi et al. established that nitrogen doping in TiO2 should be the most effective method to improve visible light photoactivity, due to nitrogen’s relatively small ionic radius (6% higher than that of oxygen) and optimal electronic band positions [2].
Early studies on N-doping within TiO2 suggested that the nitrogen atoms hybridize with the valence band of the semiconductor, and this consequently results in a delocalization of the nitrogen valence electrons and resulted in an upward shift of the valence band maximum [4]. More recent density functional calculations have disputed this claim and suggested the formation of localized N2p states above the valence band of TiO2. Density of state calculations has shown that substitutional N doping could exhibit one isolated impurity level just 0.14 eV above the valence band energy [5]. However, interstitial N doping can also exhibit a localized impurity level at 0.73 eV higher than the valence band top [5]. In addition, interstitial NO and NO2 doping have exhibited one or two isolated impurity levels in the middle of the band gap between the valence and conduction bands of TiO2 [5-6] and these impurity levels could be hybridized with N2p and O2p states [7].
Experimentally, most nitrogen-doped TiO2 exhibits visible light absorption as a shoulder in the visible wavelength (> 400 nm) due to the formation of isolated N2p orbitals above the valence band at lower nitrogen doping concentration (Nat<2%) into the TiO2 lattice [8-10]. A smooth absorption shift towards visible light regions could be achieved in the case of higher concentration of nitrogen doping (up to 17%) [9][11]. The efficiency of doped TiO2 under visible light strongly depends on the preparation method used. In some cases, such doped photocatalysts showed no activity under visible light [10] and/or lower activity in the UV spectral range compared to the non-doped TiO2 [10-11]. This may be because of the increase in the carrier recombination rates due to the formation of defect states upon doping [10]. In non-metal doped TiO2 photocatalysts, the main problem present is that the photocatalytic activity under visible light is much lower than that under ultraviolet light [10][12]. Therefore, the development of new and optimized photocatalysts exhibiting visible light activity and improved charge carrier dynamics are necessary. In this study, nitrogen doped TiO2 films are prepared at different deposition pressures, and with different concentrations of nitrogen. Interestingly, the resulting films show a large variance in their optical, morphological, and photoactive properties with significant improvements of the photoactivity observed under visible light irradiation. We investigated
the complex synergy between interstitial and substitutional doping, with the competitive effects on the overall photoactive (absorption, photocatalytic, and photoelectorchemical) performance of the films.
2. Experimental
Pure and N-doped TiO2 thin films were prepared by a RF reactive magnetron sputtering system (SPT 120, Plasmionique). A metallic Ti target (50 mm diameter) having a purity of 99.95%, was sputtered in a reactive gas atmosphere containing Ar, O2 and N2 for the deposition of N-doped TiO2 films, and just Ar and O2 for the pure TiO2 films. The deposition pressure was controlled by the Ar flow rate in the deposition chamber, fabricating films at p = 3, 7, and 14 mTorr with corresponding Ar flow rates of 30, 70, and 140 sccm respectively. Different nitrogen to oxygen ratios were used depending on the working pressure. The RF power was 200 W for all the coatings. The fixed experimental conditions chosen were situated in the intermediate region between two stable sputtering modes, reactive and metallic [13-14]. In order to achieve these optimal deposition conditions, the total reactive gas flow rate was fixed at 2.0, 2.3, 2.5 sccm for the samples deposited at 3 mTorr, 7 mTorr, and 14 mTorr, respectively.
The substrate holder was maintained at 300°C and the distance between the substrate holder and the target was fixed at 10 cm. The films were deposited on several substrates including electro-polished stainless steel (304) for photoelectrochemical and photocatlytic measurements, on Si (100) wafers for structural and analytical measurements (XRD, SEM, XPS), and ordinary microscope glass slides for optical measurements, we have used the same type of substrate for each type of measurement. Prior to deposition, the substrates were ultrasonically cleaned with acetone, ethyl alcohol and then de-ionized water for 20 minutes each. After deposition, some of the films were post annealed for 1 hour at 450°C in ambient air.
Optical measurements were carried out by a UV-vis spectrophotometer (Varian 6000). XPS analyses were carried out using Microlab 350 spectroscope (Thermo Fisher Scientific, East Grinstead, UK). Each sample was analysed using Al KX-rays with a non-monochromated radiation at a power of 300 W and a take off angle of 0º. Quantitative analyses were performed using XPSPeak software from peak areas, using the appropriate sensitivity factors. The crystal structure of thin films was characterized by X-ray diffraction (XRD) (X’Pert Pro PW3040-Pro, Panalytical Inc.) using a Cu Kα1 (λ = 1.5418 Å) X-ray radiation source in Bragg-Brentano (θ-2θ) configuration. X’Pert High Score pattern processing was used to collect and process the data
Photo-electrochemical (PEC) measurements were studied with a voltage controlled potentiostat (Solatron). Reference and counter electrodes used during the PEC measurements were an Ag/AgCl electrode (CHI Instruments/saturated KCl) and a Pt mesh electrode, respectively. The electrochemical cell was filled with an electrolyte of Na2SO4, 1 M, (Merk). A 125 W (Philips) white lamp was used to
irradiate the samples during the photocurrent measurements, and a UV filter was used to cut off all the UV irradiation below 400 nm in order to obtain visible light irradiations at the same light intensity (see Fig. S1 in the Supporting Information).
Table 1. Samples used in this study with deposition condition, atomic percentage of total nitrogen doping Nat as
well as of different nitrogen sites (substitutional NI, chemisorbed NII and interstitial NIII) using XPS spectra of N
1s core level. Calculated optical band gaps for as deposited films and annealed films (in bold) are also mentioned. *= Low light transmission.
Sputtering parameters XPS analysis Optical
N2 . N2+O2 Deposition pressure (mTorr) N2 flow rate (sccm) O2 flow rate (sccm) Nat. (%) NI (%) NII (%) NIII (%) Eg (eV) TiO2 3 0 2.0 0.3 __ 0.3 __ 3.5/3.45 15% 3 0.3 1.7 0.7 __ 0.5 0.2 3.3/3.28 25% 3 0.5 1.5 1.0 0.2 0.6 0.2 3.18/3.12 30% 3 0.6 1.4 3.3 2.8 0.2 0.3 2.8/2.71 35% 3 0.7 1.3 5.9 5.2 0.4 0.3 * / * TiO2 7 0 2.3 0.3 __ 0.3 __ 3.3/3.26 26% 7 0.6 1.7 1.1 0.3 0.5 0.3 3.25/3.21 30% 7 0.7 1.6 3.8 3.2 0.4 0.2 2.69/2.78 35% 7 0.8 1.5 4.9 4.1 0.3 0.5 * /2.38 48% 7 1.1 1.2 6.0 4.9 0.7 0.4 * / * TiO2 14 0 2.5 0.2 __ 0.2 __ 3.25/3.23 40% 14 1.0 1.5 0.7 __ 0.4 0.3 3.25/3.23 48% 14 1.2 1.3 1.8 0.3 1 0.5 3.2/3.2 60% 14 1.5 1.0 3.3 1.6 0.7 1 2.55/3.1
The photocatalytic activity was evaluated using an aqueous solution of NMP (99%, Merck) with an initial concentration of 10 mg/L at room temperature. The treated solution had a pH adjusted to 3.0 using HClO4 (Sigma-Aldrich, ACS reagent, ≥69% (T)). The solution was circulated by a peristaltic pump (MasterFlux, model 7553-75) through the reactor with a flow rate of 5.2 mL/s. The TiO2 thin film samples were placed in the reactor behind the solution and faced to the light irradiation. The applied UV source was 11W Philips TUV low pressure Hg lamp close to monochromatic output at 254 nm and the visible light source was the same as that used for the PEC measurements. The concentration of NMP was analyzed using HPLC (Shimadzu, Lab solutions) with isocratic elution
(3-10% acetonitrile, 97-90% water, flow rate: 1 ml.min-1) on a reversed–phase Nucleosil C18 column. The detection wavelength was set to 214 nm.
3. Results and Discussions
The deposition parameters of the various films used for this study are listed in Table 1. The optical band gap calculated by the Tauc model are also presented for the as-deposited and annealed films (at 450°C). For convenience, we defined the nitrogen ratio for each sample as the ratio of the nitrogen flow rate to the total reactive gas input (oxygen and nitrogen). For example, when the nitrogen flow rate is 0.6 sccm, and the oxygen flow rate is 1.4 sccm, a nitrogen ratio of 30% is used, since nitrogen is 30% of the total reactive gas flow rate (2.0 sccm).
3.1. Film Structure and Morphology
Fig. 1 presents the SEM images of the TiO2 samples prepared at deposition pressures of 3 mTorr, 7 mTorr and 14 mTorr. The thickness of the films was estimated by the SEM images to be 465 nm, 435 nm, and 460 nm for the films deposited at 3 mTorr, 7 mTorr, and 14 mTorr, respectively. It was observed that the surface roughness drastically increased as the deposition pressure increased. For example, the film deposited at 3 mTorr revealed a relatively smooth surface, with only a few irregularities observed. For the film deposited at 7 mTorr, the surface roughness increased significantly, and the cracks seen in the cross-sectional SEM images appear to converge at the surface, creating small but substantial holes. When the deposition pressure is increased to 14 mTorr, the film revealed a semi-columnar structure, with the surface porosity continuing from the film surface throughout the bulk to the substrate. In addition to the increased porosity, the formation of clusters on the film surface was seen beginning from 7 mTorr, and also at the higher deposition pressure. The clusters were a result of the increased deposition pressure, which can create semi-large clusters within the deposition plasma, and were then subsequently deposited on the film surface. These clusters should contribute to the formation of higher specific area of the developed surface. The increase of the porosity of the films by increasing the deposition pressure can be explained by the fact that the kinetic energy of the sputtered particles decreases at higher pressure, and therefore the particles reaching the surface should have less energy, less mobility and therefore will give rise to more porous films.
(a)
200 nm 200 nm(b)
200 nm(c)
3.2. Film Composition and Nitrogen Doping by XPS
A diverse arrangement in the concentration and nature of nitrogen doping was found throughout the different films. In particular two types of doping could be found; substitutional doping, where nitrogen replaced oxygen in the TiO2 lattice, and interstitial doping, where nitrogen was bonded to one or more oxygen atom as presented in Table 2. The N 1s core level spectra were measured by XPS, and deconvoluted into three regions: (NI) between 396 eV to 398 eV, (NII) centred around 400 eV, and (NIII) localized at 402 eV. NI is assigned to substitutional sites of nitrogen detected at binding energy of about 396 eV (O—Ti—N) [15-17], 397 eV (N—Ti—N) [18] and 398 eV (Ti—N—O) [19-21]. NII and NIII have many possible assignments but they are widely accepted to correspond to N which is not bonded to Ti. NII is reported to correspond to chemisorbed N2 [2][21], however other reports assigned this peak to interstitial nitrogen within TiO2 [22-24] and substitutional nitrogen [25-26]. Finally, NIII at 402 eV has been attributed to interstitial nitrogen [17][21][27] in the form of (Ti—O—N, NO, or NO2) and other adsorbed species like N2 [2][28] or NO dimers [29]. Fig. 2 shows the deconvoluted XPS spectra of the N 1s core level from samples deposited at 14 mTorr for different nitrogen ratio. The calculated atomic concentrations of the main nitrogen sites (NI), (NII) and (NIII) are presented in Table 1, for all the samples
Table 2. Probable nitrogen oxidation states in N doped TiO2 and the corresponding binding energies. Binding
Energy Type of bonding
Nitrogen oxidation
state References
396 (eV) N—Ti—O N3-, N2- [15-17][30]
397 (eV) Ti—N triple bonding in TiN N3- [5][18][23][30-33][35]
398 (eV)
N—Ti—O (with electron shift from Ti to N) and/or Ti—N— O
N- [19-21]
400 (eV) Chemisorbed N2 and/or NOx N0, N+ [21][23][30][34]
394 396 398 400 402 404 406
N
III 48 % 14 mTorr Inte nsi ty (a .u.)Binding energy (eV)
N
II394 396 398 400 402 404 406
N
IIN
IN
III
Binding energy (eV)
In ten sity ( a.u .) 30 % 3 mTorr
Fig. 2. Deconvolution of N 1s core level spectra for samples showing (a) the best photocatalytic activity and (b)
the best photoelectrochemical activity under visible light. Interstitial, chemisorbed and substitutional nitrogen are presented in green, blue and red colors, respectively.
3.3. Optical Properties
The transmission and reflection spectra were measured for each sample before and after annealing at 450oC in air. The transmission spectra for the annealed films deposited at 7 mTorr are shown in Fig. 3a. The trend for the respective spectra for all of the as-deposited and annealed samples was similar, showing a distinct shift of the transmission to longer wavelengths as the nitrogen incorporation increased, and the sample with the highest nitrogen ratio had an absorption edge begin at wavelengths higher than = 500 nm.The absorption spectra were calculated using the following equation, [36-37]
(Eq-1) 2 / 1 2 4 2 4 ) 1 ( 2 ) 1 ( ln T R T R d A
where A is the absorbance, is the absorption coefficient, d is the thickness of the sample, R and T are the reflection and transmission spectra, respectively. Then, the effective optical band gaps were also estimated for each sample using the Tauc plots. In order to obtain the estimated optical band gap for the thin films, we plotted (h)1/2 vs. h and the band gap energy was obtained by extrapolating the linear portion of this plot to the intersection with the x-axis (h), at which point we determine the band gap. The calculated values of the effective band gaps for the pure and nitrogen doped TiO2 films are shown in Table 1 as well as in Fig. 3b for comparison. The as-deposited and annealed pure TiO2 films showed an estimated band gap energy of Eg = 3.35 0.15 eV, indicative of the anatase phase of TiO2 [38]. As the nitrogen ratio is increased, the band gap is found to decrease from 3.5 eV to 2.55 eV in two slopes depending on the deposition pressure. This is an expected result, as the introduction of nitrogen, whether substitutional or interstitial, can add stable energy levels within the anatase band gap of TiO2. Therefore, as more nitrogen was added, the density of nitrogen states within the anatase band gap should increase, and thus more electrons-hole pairs can be excited from within the band gap energy of TiO2. The decrease of the optical band gap energy was observed to depend on the deposition pressure, the change in the slope occurred for nitrogen ratio of 25% and 48% as the films were deposited at lower pressure (3~7 mtorr) and higher pressure (14 mtorr), respectively.
N—Ti—O Ti—O—N
300 400 500 600 700 800 0 10 20 30 40 50 60 70 80 90 100 TiO2 26 % 30 % 35 % 7 mtorr 450oC Tr ansm iss ion (% T) Wavelength (nm)
(a)
0 10 20 30 40 50 60 2,4 2,6 2,8 3,0 3,2 3,4 3,6 Calculated Band G ap ( eV ) Nitrogen Ratio (N2/(N2+O2)) 14 mtorr 7 mtorr 3 mtorr(b)
Fig. 3. (a) UV-vis transmission spectra for nitrogen doped samples prepared at 7 mTorr and annealed at 450°C
for 2 hours, (b) calculated band gap using Tauc plot for all samples vs N2 % in the reactive gas {N2/(N2+O2)},
before (dotted line) and after annealing (solid line).
After annealing at 450°C, the band gap values decreased slightly in general, which could be explained by the enhancement of crystallinity (increase of the crystal size) and electronic transfer, especially for the dense films prepared at lower pressures. However, this is less pronounced with the films deposited at 14 mTorr which could be probably induced by a partial loss of nitrogen doping due to the oxidation of nitrogen sites in such films [52].
3.4 Valence Band Observation and Analysis by XPS
The difference between the valence band maximum and Fermi level energy can help to describe the electronic structure of pure and N-doped TiO2 films by examining the XPS of O 2p spectra at very low binding energies (near the Fermi level). The valence band spectra of pure and doped thin films are presented in Fig. 4a, 4b and 4c, respectively. The estimated valence band border from the Fermi level has been extrapolated, at the intersection between the 5.4 eV peak (O 2p -bonding) and the base line [22][45][48]. No signal associated to Ti3+ defect states has been observed near the Fermi level (i.e., there were no oxygen vacancy states that could be detected using the present XPS data) [42][49-50] so the Ti was in its full oxidation state Ti4+ within all the thin films. More details on the behaviour of Ti 2p and O 1s are discussed in the Supporting Information.
0 1 2 3 4 5 6 7 8 9 10 TiO2 15% 25% 30% 35% In te ns it y ( a.u .)
Binding Energy (eV)
(a)
0 1 2 3 4 5 6 7 8 9 10
(b)
TiO2 26% 30% 35% 48%Binding Energy (eV)
Inte nsi ty (a.u.) 0 1 2 3 4 5 6 7 8 9 10 TiO2 40% 48% 60% Inten sity (a.u.)
Binding Energy (eV)
(c)
Fig. 4. Valence band using O 2p spectra for different nitrogen flow rate percentage at three different pressures
(a) 3 mTorr, (b) 7 mTorr and (c) 14 mTorr.
It was observed that the valance band edge of the non-doped samples was at the same position from the Fermi level (2.25 eV) regardless of the deposition pressure. At lower deposition pressures (3 mTorr to 7 mtorr), the overall trend showed that as more nitrogen was incorporated into the films, the valence band border shifted closer toward the Fermi level with a change in the decay slope for nitrogen concentrations higher than 3.3%. This resulted in a decrease of the energy gap between the valence band and the conduction band, with a maximum apparent broadening in the valence band up to 0.5 eV as compared to that of the undoped films. The shift in the valence band edge/Fermi level distance could be due to the domination of substitutional nitrogen doping [17] as mentioned in Table I. However, the decrease of the distance between the valence band and Fermi level in the 14 mTorr samples was considerably less than the films prepared at lower pressures, as there was significant reduction in the amount of nitrogen at substitutional sites [17].
The decrease in the valence band-Fermi level energy is directly correlated to the decrease of the observed optical band gap energy. The XPS and UV-vis observations (see Fig. 3 and Table 1) suggest that at low nitrogen doping (Nat<<3.3%) the most significant change in the optical properties is due to
the broadening of the valence band energy, which results from the overlap of the O 2p and N 2p orbitals (nitrogen energy states) [51]. However, when the atomic nitrogen doping increases above this critical value, the band gap energies decrease significantly, which is indicative of a higher density of intermediary energy levels within the band gap of TiO2 [5], which could not be detected clearly by the examination of the XPS data because a Fermi level shifting (toward vacuum level) could take place at higher nitrogen concentration within the doped thin film (Nat>> 3.3%).
3.5. Film Structure versus deposition pressure
3.5.1 Case of non-doped TiO2
Fig. 5a presents the XRD scans for the non-doped TiO2 thin films deposited at three different pressures, 3 mTorr, 7 mTorr and 14 mTorr. An interesting conclusion can be deduced from this Fig., taking into account the ratio between the intensities of the peaks corresponding to the two different anatase orientations of titania i.e. (101) and (004). It is evident that at lower deposition pressure (3 mTorr), the TiO2 is more crystallized in the preferential (101) orientation rather than the anatase (004), but the latter becomes the preferential orientation as the deposition pressure increases to 7 and 14 mTorr. On the other hand, there is a clear decrease in the anatase XRD intensity at the highest pressure studied (14 mTorr). This can be explained by two facts, (1) a decrease in the TiO2 crystallinity at higher working pressures which is consistent with the conclusion of Zeman et al. [39], and/or (2) to the reduction in the crystal size (shrinking) when sputtering at higher pressures. The average crystallite size was determined using the Scherrer Formula and presented in the insert of Fig. 5a. The anatase crystal size increases as the deposition pressure increases from 3 mTorr to 7 mTorr, and a further increase in the deposition pressure induces a decrease in the crystal size.
Crystal size calculations also confirmed the preferential presence of anatase (101) at low pressure (3mTorr) and anatase (004) at high pressure (14 mTorr). However, at an intermediate deposition pressure (7mTorr) there is a competition between both phases accompanied with a general increase in the crystal size.
25 30 35 40 45 50 55 60 14 mtorr 7 mtorr 3 mtorr A(105) A(200) A(004 )
Diffraction Angle 2 (Degree)
XRD In te ns it y (e V) A(101) 2 4 6 8 10 12 14 30 40 50 60 70 80 90 (101) (004) Crystal si ze ( nm)
Deposition pressure (mtorr)
25 30 35 40 45 50 55 60 3 m T or r 60% 48% 40% TiN(111) A(101) A(004) 15% 30% 35% 14 m T or r XRD I nt en si ty ( eV)
Diffraction Angle 2 (Degree)
Fig. 5. (a) XRD scan of the pure TiO2 thin films deposited at 3 mTorr (black), 7 mTorr (red), and 14 mTorr
(blue). The insert shows the crystal size of anatase phase (101) and (004) vs deposition pressure, as calculated using Scherrer formula. Samples were post- annealed at 450°C for 1 hour after the deposition. (b) XRD scan of N doped TiO2 thin films deposited at high and low pressures.
3.5.2 Case of N-doped TiO2
The XRD scans for the N-doped films are shown in Fig. 5 b. Doped films prepared at 3 mTorr and 7 mTorr have similar trends, the low nitrogen ratio decreases the crystallinity of the anatase phase of TiO2, but the high nitrogen ratio makes it easier for TiN to form, and the intermediary nitrogen ratios have a competition between the two phases.
At 3 mTorr, films prepared with nitrogen ratios of 15%, 25%, and 30% all showed diffraction peaks at 2 = 25.4o, and 2 = 38o, corresponding to the (101) and (004) orientations of the anatase phase of TiO2, respectively. The coatings obtained at a lower nitrogen ratio (15%) showed a preferred growth in the (101) direction of anatase, while the films deposited at 25% and 30% showed stronger preferred orientation in the (004) direction. The (004) peak may be partially attributed to an increase in nitrogen incorporation within the TiO2 lattice. When the nitrogen ratio increases above 35% in the reactive gas, a significant destruction of the anatase phase took place, with a predominance of the TiN crystals in the deposited films. For the films deposited at 7 mTorr, the clear reduction of the anatase phase could be detected when nitrogen ratio reached 35% in the reactive gas but with no predominance of any TiN phases. However, the film deposited at a nitrogen ratio of 48% showed a clear peak corresponding to TiN (111) at 2 = 43.6o with no anatase diffraction peaks, reflecting a predominance of the TiN crystals rather than titania or titanium oxynitrides in the structure of the coatings.
A different behavior has been observed with the films deposited at 14 mtorr. The introduction of nitrogen did not quench the growth of the anatase crystals of TiO2 (up to 60% N). As the nitrogen ratio increased up to 48%, the coating still showed strong anatase characteristics, with dominant peaks found at 2 = 38°, corresponding to the (004) orientations of the anatase phase. Then, when the nitrogen ratio was further increased (60%), we found a surprising increase in the diffraction peak intensity at 2 = 25.4o corresponding to a preferential growth in the (101) orientations of the anatase phase rather than the (004) one. This result implies that there is a change in the nitrogen incorporation sites when the nitrogen ratio increased from 48% to 60%.
We note also that, in all films deposited at 14 mtorr, there are no diffraction peaks corresponding to any TiN structures, which is not the case in samples prepared at lower pressures. The average crystal size was also investigated by using the Scherrer formula, not presented here. The overall trend for the samples was similar, showing larger crystal sizes at lower nitrogen ratios, which then decreased as the nitrogen ratio increased for all deposition pressures.
3.6. Photoactive Properties
Two methods were used to test the photoactivity of pure and N-doped TiO2; the current generation during photoelectrochemical water splitting reactions, and the photocatalytic degradation of NMP. 3.6.1. Photoelectrochemical Performance for water splitting
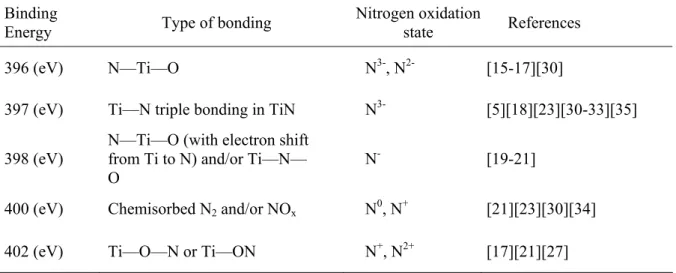
Fig. 6 presents the electrochemical potentiodynamic sweep for N-doped TiO2 samples deposited at 7 mTorr and irradiated by white light. Films prepared at other pressures have the same overall shape and trends (not shown) as in Fig. 6, the only significant difference is the maximum photocurrent density that was generated, which is discussed later.
The dark current density was approximately 0.3 to 0.6 μA/cm2 for the positive sweeping bias up to 1.0 V. Upon white light irradiation, the open circuit voltage (VOC) was about -0.5 V for all samples regardless of the deposition conditions. This indicated that the electronic structure has not been significantly affected by the surface morphology or the nitrogen incorporation into the TiO2 films. The photocurrent deviates from the dark current under both white and visible light excitation, although the difference is much greater for white light. This disparity was understandable, because the absorption spectrum for this film showed significantly larger absorbance at UV wavelengths compared to the visible range. -0.8 -0.6 -0.4 -0.2 0.0 0.2 0.4 0.6 0.8 1.0 0 50 100 150 200 250 300 350 400 450 500 TiO2 26% 30% 35% 48%
Photoc
urrent Density (µA/cm
2
)
Bias Voltage (V vs. Ag/AgCl)
Fig. 6. Electrochemical potentiodynamic sweep under white light irradiation using Ag/AgCl as reference
electrode in Na2SO4 1M, pH 7 for N doped samples deposited at 7mTorr.
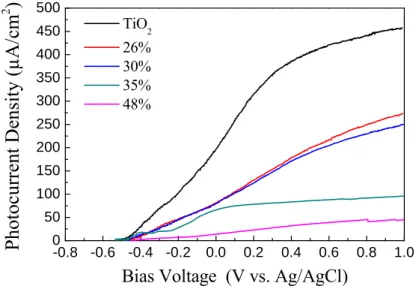
Fig. 7 shows the intermittent photocurrent measured at 0.5 V/(Ag/AgCl) under white light and visible light irradiations. The samples were alternately irradiated by white light every 30 seconds, then by visible light using a UV filter. For simplicity, the intermittent photocurrent densities versus irradiation time are presented only for the samples deposited at 7 mTorr (Fig. 7 a). In Fig. 7b, the photocurrent density under visible light are presented for samples deposited at 14 mTorr and we used the data of
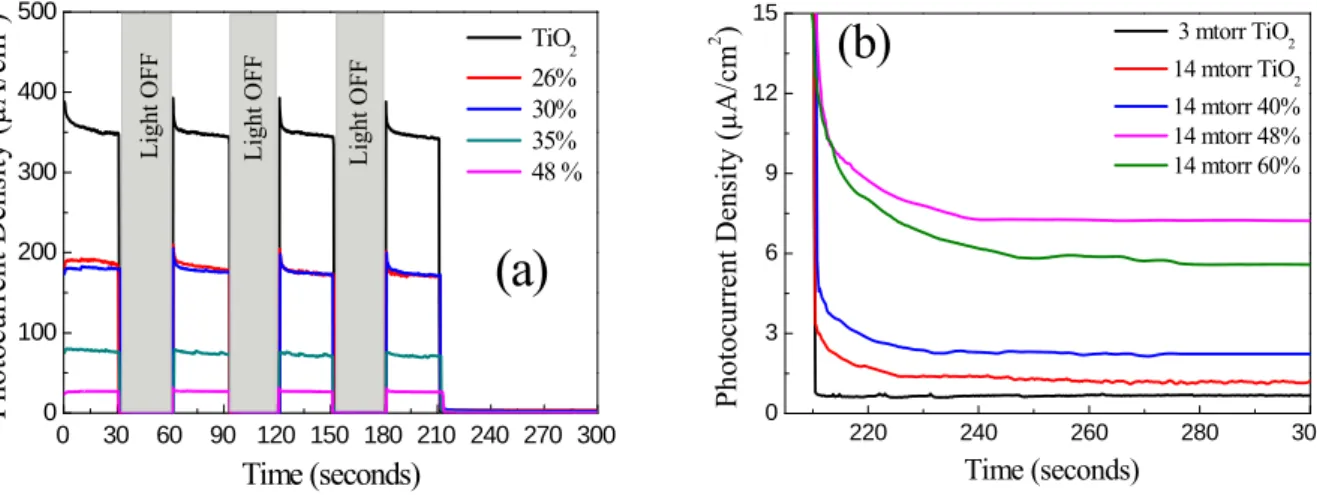
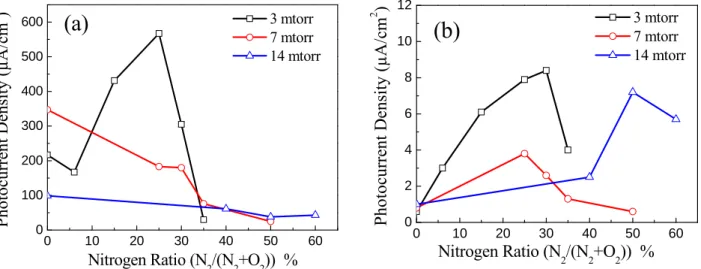
pure TiO2 deposited at 3 mTorr as reference. The maximum photocurrent generated, at constant voltage of 0.5 V, under white and visible light was plotted in Fig. 8a and 8b, respectively. When nitrogen was incorporated in the depositions it seemed to degrade the photocurrent generated in the samples prepared at 7 mTorr and 14 mTorr under white light irradiation. However, when these samples were irradiated under visible light, the addition of nitrogen was not always destructive to the photoactive performance of these films. In particular, a maximum photocurrent was observed at nitrogen ratios of 30% (8.5 µA/cm2), 25% (3.8 µA/cm2) and 48% (7.5 µA/cm2) for films deposited at 3 mTorr, 7 mTorr, and 14 mTorr, respectively. However, for the samples prepared at 3 mTorr, the incorporation of nitrogen produced more photocurrent under white light and visible light illumination. This may result from the combination of the increased nitrogen percentage and the decreased porosity of this film. This trend indicates that the incorporation of nitrogen into the films prepared at pressures above 3 mTorr is destructive to the UV induced photoelectrochemical performance, but enhances the visible light reactivity.
The maximum photocurrent density was found to depend on the deposition pressure as well as the doping level. In general, the samples prepared at 3 mTorr showed the highest photocurrent density, with a peak photocurrent achieved when the nitrogen ratio was 25% (Nat=1%) under white light irradiation, and at 30% (Nat=3.3%) under visible light irradiation. The difference in photoactivity between these two films could be explained by the recombination between the photogenerated electron-holes under the UV irradiation if the nitrogen ratio was increased to 30%. A maximum white light photocurrent density of 567 µA/cm2, 347 µA/cm2 and 99 µA/cm2 was measured at nitrogen ratios of 25% (3 mTorr), 0% (7 mTorr), and 0% (14 mTorr), respectively.
0 30 60 90 120 150 180 210 240 270 300 0 100 200 300 400 500 TiO2 26% 30% 35% 48 % Photocur rent Density ( µ A/cm 2 ) Time (seconds) Li gh t OF F Light OFF Light OFF
(a)
220 240 260 280 300 0 3 6 9 12 15 3 mtorr TiO2 14 mtorr TiO2 14 mtorr 40% 14 mtorr 48% 14 mtorr 60% Time (seconds) Photocurr ent Dens ity (µA /cm 2 )
(b)
Fig. 7. (a) Example of electrochemical intermittent photocurrent under white light irradiation at a bias voltage of
0.5V/(Ag/AgCl ) in Na2SO4 1M, pH 7 for N doped samples deposited at 7 mTorr (b) Visible light photocurrent
density for samples deposited at 14 mtorr as compared to TiO2 deposited at 3 mtorr.
When interstitial and substitutional nitrogen sites were both observed in the same sample, it seemed to have a synergic effect on the electrochemical properties, especially at lower nitrogen concentrations
(N at. % < 3.3) where the maximum photocurrent density under UV and visible light irradiation was observed. At higher nitrogen concentrations (N % at. > 3.3), the concentration of substitutional nitrogen sites increased, which decreased both visible and UV light photocurrent density regardless of the deposition pressure.
0 10 20 30 40 50 60 0 100 200 300 400 500 600 3 mtorr 7 mtorr 14 mtorr Ph ot ocu rren t Densit y (µA/cm 2 ) Nitrogen Ratio (N2/(N2+O2)) %
(a)
0 10 20 30 40 50 60 0 2 4 6 8 10 12(b)
3 mtorr 7 mtorr 14 mtorr Nitrogen Ratio (N 2/(N2+O2)) % Ph otoc ur re nt D en sity ( µ A /c m 2 )Fig. 8. Photocurrent density under (a) white light and (b) visible light irradiations at a bias voltage of
0.5V/(Ag/AgCl) in Na2SO4 1M, pH 7 for all N doped samples deposited at different pressures vs N2% in the
reactive gas.
Under visible light irradiation, the decrease of the photocurrent density was observed when substitutional nitrogen was dominant, as well as with the formation of the TiN structure. The introduction of TiN into the films was found to have two dramatic effects: first, TiN is not inherently photoactive and it reduces the photo-generation efficiency of the charge carriers due to the destruction of the anatase TiO2 crystal lattice, and second, they act as recombination centers for the photo-generated electrons and holes.
3.6.2. Photocatalytic activity
N-methyl-2-pyrrolidone (NMP), a cyclic nitrogen-containing organic chemical, is a versatile solvent and reaction medium. It has found wide use in petrochemical, plastic, coating, agricultural, and electronic industries because of its low volatility, thermal stability, high polarity and aprotic, noncorrosive properties [40-43]. Therefore, it has been found in the wastewater of many industries. Conventional wastewater treatment methods such as chemical precipitation, activated carbon adsorption, and ion-exchange processes can effectively remove organic compounds from wastewater [40-41]. However, the contaminants are transferred from one medium to another by these methods, and hence further treatment or disposal is required. In addition, the biodegradation of NMP is not only slow but also the product of the degradation is a carbonyl compound, which has a significant COD and cannot be broken down further under normal conditions of sewage treatment [42-43]. Here, we
decompose NMP via photocatalysis over N-doped TiO2 thin films under UV light and also under visible light alone, demonstrating interesting use of this technique. This process irreversibly breaks down the NMP molecules, and provides a safe method to effectively remove this pollutant from wastewater. 0 20 40 60 80 100 120 0 2 4 6 8 10 3 mtorr TiO2 14 mtorr TiO2 14 mtorr 60% 14 mtorr 48% 14 mtorr 40% Substrate
NMP Concentration (
ppm)
Irradiation Time (minutes)
Fig. 9. Kinetic of NMP degradation under UV light using some selected N doped samples deposited at 14 mTorr
and 3 mTorr.
Fig. 9 shows the concentrations of NMP as a function of time during the UV photodegradation with different doped samples deposited at 14 mTorr and pure TiO2 deposited at 3 mTorr. From this Fig., it is clear that even with the blank substrate, the concentration of NMP decreased due to UV photo-bleaching. However, when TiO2 and N-doped TiO2 samples were inserted, the degradation kinetics increased significantly. Fig. 10 presents the percentage of degraded NMP in the aqeuous solution, with the presence of the different studied samples, after 6 hours of visible light irradiation. When looking at Fig. 9 and 10, it is clear that the most efficient photocatalytic activity was found for the samples prepared at 14 mTorr as compared to the films prepared at other pressures which is consistent with our previous work [44]. In particular the sample prepared with a nitrogen ratio of 48% gave the best photocatalytic activity under UV irradiation, but the films prepared with 48 % and 60 % nitrogen ratios gave the best photocatalytic activity under visible irradiation. The two major parameters which affected the photocatalytic performance were the film morphology and nitrogen doping sites. As was discussed in section 3.1, the deposition pressure had a significant effect on the films morphology. In particular as the deposition pressure increased, the developed surface of the films also increased giving more active catalytic sites for photocatalysis to take place.
0 10 20 30 40 50 60 70 80 90 100 35% 30% 25% 15% 0%
N
M
P
degradation (
1-C
/C
0)x100
Nitrogen Ratio (N
2/(N
2+O
2))
3 mTorr 7 mTorr 14 mTorr 0% 26%30%35%48% 0% 40%48% 60%Fig. 10. Efficiency of NMP degradation under visible light using pure TiO2 (0%) and N doped samples deposited
at 3 mTorr, 7 mTorr and 14 mTorr. C and C0 being the initial concentration (10 ppm) and the final concentration,
respectively, of NMP
The other factor which played a role in the photocatalytic functionality of the films was the nitrogen doping sites. It was observed that as the interstitial nitrogen sites increased, the photocatalytic activity became higher. Then as the substitutional nitrogen started to become dominant, the UV activity decreased again but not the visible one, as shown by the film prepared at a nitrogen ratio of 60% (see table 1). This could be a direct result of the change in the photogenerated charge separation, with the porous films having more interstitial nitrogen doping than substitutional nitrogen sites. However, when substitutional nitrogen became dominant there was a probable recombination between the UV generated electron-holes which explains the reduction of the UV photocatalytic activity with the sample prepared at 14 mTorr with nitrogen ratio of 60%. This is in partial agreement with the work of Yates et al. [30] and other works [19][45-47] who found that nitrogen in chemisorbed and interstitial states doping were more efficient for photocatalytic efficiency rather than substitutional nitrogen doping.
3.6.3. Correlation between the photo responses and the different nitrogen sites
In the Supporting Information, we presented the correlation between three different photo responses (optical band gap Eg, visible photocatalytic activity PCA and the visible photo-electrochemical current PEC) and the atomic concentration of the different nitrogen sites (NI, NII and NIII) for the different deposition pressures. Clearly, PCA, PEC and Eg changes independently from the concentration of NII. That means, nitrogen present in chemisorbed sites (NII) doesn’t affect any photoresponses. The PCA and PEC efficiencies increase as N % increases up to reaching to an optimal concentration of atomic N in the structure. This optimal concentration of nitrogen is almost independent from the deposition pressure and it is found to be less than 3% at. Then, if the concentration of nitrogen increases more,
the PCA and PEC photo efficiencies are found to decrease. More interestingly, the photoactivity of N doped TiO2 decreases dramatically when the substitutional nitrogen sites exceed largely the concentrations of the interstitial nitrogen’s sites. This is a direct and important conclusion from this correlation of our study.
As seen before in the section of optical properties, the band gap decreases as the concentration of nitrogen increases, especially when the substitutional nitrogen sites dominate the other nitrogen species in the thin film.
3.5.4. Comparison between photocatalysis and water splitting
It is interesting to note that the optimal properties of the films are not the same for the water splitting and photocatalysis as shown in table 3. These results imply that the deposition conditions and doping parameters have different functionalities for the resulting films, and thus can be tuned dependent on the type of desired application. For the electrochemical and optoelectronic applications, the films deposited at 3 mTorr with low nitrogen doping (1% at. and 3.3% at. under UV light and visible light respectively) are more photoactive than those deposited at higher pressure because the films produced at lower pressure have a higher density. The photocatalytic degradation of NMP was found to be the highest for the films prepared at 14 mTorr with a nitrogen doping of 1.8 at. % under UV irradiation. However, for visible irradiations, the optimal photoactive performance was found in the samples with 3.3% of atomic nitrogen doping. The difference between the optimized TiO2:N films, under UV and visible light, could be explained by recombination between the UV generated electron/hole at higher nitrogen doping ratio.
Table 3. Optimal deposition pressure and atomic percentage of nitrogen within doped TiO2 for photocurrent
generation and photocatalyse, using UV and/or visible light excitation.
Photocurrent density photocatalytic activity
Visible light 3 mtorr / Nat. 3.3 % 14 mtorr / Nat. >1.8 %
UV light 3 mtorr / Nat. 1 % 14 mtorr / Nat. 1.8 %
4. CONCLUSIONS
This study has shown the ability to tailor nitrogen doped TiO2 films with controllable morphology, optical properties, and photoactive performance. Interestingly, the optimal deposition and doping conditions depend closely on the type of application of the desired film and on the photo-excitation source. The desired impurity energy level(s) introduced in the electronic band gap of TiO2 by nitrogen doping do not necessarily improve the photocatalytic activity, despite the desired optical
properties observed, due to the active recombination sites produced, depending on the complexity of the nanoscale surface. Interstitial nitrogen doping sites seem to improve the photocatalytic activity of TiO2, rather than substitutional sites, due to the better charge separation especially with porous films having an active surface area much higher than the projected surface. The synergic effect of substitutional and interstitial nitrogen sites are more efficient to improve the electrochemical photoactivity of TiO2 due to the good light absorption, charge transfer in substitutional doping, and the good charge separation induced by the interstitial nitrogen doping. Furthermore the contradictions found reported in the literature concerning nitrogen doping sites and the different photo-activities of N doped TiO2 was discussed. This work showed that the doping parameters must be tuned depending strongly on the type of the desired application.
Acknowledgements
The authors would like to thank the French Ministry of Research and High Education for funding the mobility of the researchers in the framework of the Gundishapur program of the Hubert Curien Partnership (EGIDE). Partial support for this project was received from the European project NATIOMEM. The authors would also like to thank Diane Gumuchian from the University of Pierre et Marie Curie for continued and valuable discussions, Dr. Mark Baker and Dr. Rossana Grilli from the University of Surrey for their assistance with the XPS measurement.
References
[1] F. Han, V.S.R. Kambala, M. Srinivasan, D. Rajarathnam, R. Naidu, Appl. Catal. A 359 (2009) 25– 40.
[2] R. Asahi, T. Morikawa, T. Ohwaki, K. Aoki, Y. Taga, Science 293 (2001) 269–271. [3] S.U.M. Khan, M. Al-Shahry,W.B. Ingler, Science 297 (2002) 2243–2245.
[4] R. Beranek, B. Neumann, S. Sakthivel, M. Janczarek, T. Dittrich, H. Tributsch, H. Kisch, J. Chem. Phys. 339 (2007) 11–19.
[5] C. Di Valentin, E. Finazzi, G. Pacchioni, A. Selloni, S. Livraghi, M.C. Paganini, E. Giamello, J. Chem. Phys. 339 (2007) 44–56.
[6] S. Lee, E. Yamasue, K. Ishihara, H. Okumura, Appl. Catal. B 93 (2010) 217–226. [7] A. Zaleska, Rec. Pat. Eng. 2 (3) (2008) 158–164.
[8] Y. Nakano, T. Morikawa, T. Ohwaki, Y. Taga, J. Chem. Phys. 339 (2007) 20–26. [9] M. Kitano, M. Matsuoka, M. Ueshima, M. Anpo, Appl. Catal. A 325 (2007) 1–14. [10] H. Irie, Y. Watanabe, K. Hashimoto, J. Phys. Chem. B 107 (2003) 5483–5486. [11] B. Liua, L. Wena, X. Zhao, Sol. Energ. Mat. Sol. Cells 92 (2008) 1–10.
[12] H. Yu, X. Zheng, Z. Yin, F. Tag, B. Fang, K. Hou, Chin. J. Chem. Eng. 15 (6) (2007) 802–807. [13] W.D. Sproul, D.J. Christie , D.C. Carter, Thin Solid Films 491 (2005) 1–17.
[14] A. Brudnik, M. Bucko, M. Radecka, A. Trenczek-Zajac, K. Zakrzewska, Vacuum 82 (2008) 936– 941.
[15] N. Raut, T. Mathews, S. Rajagopalan, R. Subba Rao, S. Dash, A. Tyagi, Solid State Comm. 151 (2011) 245–249.
[16] Z. Zhang, J.B.M. Goodall, D.J. Morgan, S. Brown, R.J.H. Clark, J.C. Knowles, N.J. Mordan, J.R.G. Evans, A.F. Carley, M. Bowker, J.A. Darr, J. Eur. Ceram. Soc. 29 (2009) 2343–2353. [17] S. Hamad, J.C. Gonza, A. Barranco, J.P. Espino, J. Cotrino, J. Phys. Chem. C 114 (2010) 22546–
22557.
[18] A. Trenczek-Zajac, M. Radecka, K. Zakrzewska, A. Brudnik, E. Kusior, J. Power Sources 194 (2009) 93–103.
[19] F. Peng, Y. Liu, H. Wang, H. Yu, J. Yang, Chinese J. Chem. Phys. 23 (4) (2010) 437–441. [20] J. Sun, L. Qiao, S. Sun, G. Wang, J. Hazard. Mater. 155 (2008) 312–319.
[21] S. Lee, I. Cho, D.K. Lee, D.W. Kim, T.H. Noh, C.H. Kwak, S. Park, K.S. Honga, J.K. Lee, H.S. Jung, J. Photochem. Photobiol. A 213 (2010) 129–135.
[22] J. Wang, D.N. Tafen, J.P. Lewis, Z. Hong, A. Manivannan, M. Zhi, M. Li, N. Wu, J. Am. Chem. Soc. 131 (2009) 12290–12297.
[23] G. He, L. Zhang, G. Li, M. Liu, X. Wang, J. Phys. D: Appl. Phys. 41 (2008) 045304 1–9. [24] O. Diwald, T. L. Thompson, E. G. Goralski, S. D. Walck, J. T. Yates, J. Phys. Chem. B 108
(1)(2004) 52–57.
[25] X. Chen, C. Burda, J. Phys. Chem. B 108 (2004) 15446-15449.
[26] X. Chen, Y. B. Lou, A.C.S. Samia, C. Burda, J.L. Gole, Adv. Funct. Mater. 15 (2005) 41-44.
[27] N.T. Nolan, D.W. Synnott, M.K. Seery, S.J. Hinder, A.V. Wassenhoven, S.C. Pillai , J. Hazard. Mater. 211 (2012) 88-94.
[28] R. Andrievski, Z. Dashevsky, G. Kalinnikov, Tech. Phys. Lett. 30 (2004) 930-932. [29] T. Herranz, X. Deng, A. Cabot, Z. Liu, M. Salmeron, J. Catal. 283 (2011) 119-123.
[30] H.M. Yates, M.G. Nolan, D.W. Sheel, M.E. Pemble, J. Photochem. Photobiol. A 179 (2006) 213– 223.
[31] R. Parra, A. Arango, J. Palacio, Dyna 77 (163) (2010) 64–74.
[32] H. Kawasaki, T. Ohshima, Y. Yagyu, Y. Suda, S.I. Khartsev, A.M. Grishin, J. Phys. Conference Series 100 (2008) 012038 1–4.
[33] B. Avasarala, P. Haldar, Electrochim. Acta 55 (28) (2010) 9024–9034.
[34] A. Emeline, V. Kuznetsov, V. Rybchuk, N. Serpone, Int. J. Photoenergy (2008) 258394 1–19. [35] M. Wong, H. Chou, T. Yang, Thin Solid Films 494 (2006) 244 –249.
[36] A. Salem, Y. El-Gendy, G. Sakr, W. Soliman, J. Phys. D: Appl. Phys. 41 (2008) 025311. [37] Y. El-Gendy, J. Phys. D: Appl. Phys. 42 (2009) 115408.
[39] P. Zeman, S. Takabayashi, Surf. Coat. Technol. 153 (2002) 93-99.
[40] M. Chong, B. Jin, C. Chow, C. Saint, Water Res. 44 (10) (2010) 2997–3027. [41] S. Pardeshi, A. Patil, J. Hazard. Mater. 163 (2009) 403–409.
[42] M. Batzill, E.H. Morales, U. Diebold, J. Chem. Phys. 339 (2007) 36–43. [43] S. Chow, Water Res. 17 (1983) 117–118.
[44] H. Fakhouri, W. Smith, J. Pulpytel, A. Zolfaghari, H. Mortaheb, F. Meshkini, R. Jafari, F. Arefi-Khonsari, J. Nano- Electron. Phys. 3 (1) (2011) 26–40.
[45] F. Dong, W. Zhao, Z. Wu, S. Guo, J. Hazard. Mater. 162 (2009) 763–770.
[46] H. Shen, L. Mi, P. Xu, W. Shen, P. Wang, Appl. Surf. Sci. 253 (2007) 7024–7028. [47] S.H. Lee, E. Yamasue, H. Okumura, K.N. Ishihara, Appl. Catal. A 371 (2009) 179-190. [48] A. Fujishima, X. Zhang, D.A. Tryk, Surf. Sci. Rep. 63 (2008) 515–582.
[49] C. Chusuei, W. Goodman, Langmuir 26 (2010) 921-938.
[50] S. Wendt, P. Sprunger, E. Lira, G. Madsen, Z. Li, J. Hansen, J. Matthiesen, A. Blekinge-Rasmussen, E. Lægsgaard, B. Hammer, F. Besenbacher, Science 320 (2008) 1755–1759. [51] Z. Zhao, Q. Liu, J. Phys. D: Appl. Phys. 41 (2008) 085417 1–10.
[52] W. Smith, H. Fakhouri, J. Pulpytel, S. Mori, R. Grilli, M.A. Baker, F. Arefi-Khonsari, J. Phys. Chem. C 116 (30) (2012) 15855-15866.
[53] Y. Nosaka, M. Matsushita, J. Nishino, A.Y. Nosaka, Sci. Technol. Adv. Mater. 6 (2005) 143-148.
Supporting information
Control of the Visible and UV Light Water Splitting and
Photocatalysis of Nitrogen Doped TiO
2Thin Films Deposited
by Reactive Magnetron Sputtering
Houssam Fakhouri1,3*, Jerome Pulpytel1,3*, Wilson Smith1, Alireza Zolfaghari2, Hamid Reza Mortaheb2, Fateme Meshkini2, Reza Jafari2
, Eliane Sutter
3and Farzaneh Arefi-Khonsari
1,31 Laboratoire de Génie des Procédés Plasma et Traitement de Surface, 11 Rue Pierre et Marie Curie, 75231 Paris-France
2 Chemistry and Chemical Engineering Research Center of Iran, Tehran- Iran
3 CNRS, UPR15, Laboratoire Interfaces et Systèmes Electrochimiques, 75005 Paris- France
* Corresponding author.
E-mail addresses: jerome.pulpytel@upmc.fr (J Pulpytel), houssam-fakhouri@enscp.fr (H Fakhouri)
Phone: +33 147276823
A. Photo-excitation source
Fig. S1 presents the optical emission spectrum of the white lamp used as excitation source (125 W Philips). UV filter was used to cut off all the UV irradiation below 400 nm in order to obtain visible light irradiations at the same light intensity
400
500
600
700
800
Without filterEmission intensity (
a.u)
Wavelength (nm)
With filter UVFig. S1. Optical emission spectrum of the white light lamp used as photo excitation source, before and after the
introduction of the UV filter.
The light power delivered by each photo excitation sources are presented in Table S1. The UV lamp (TAU 11W Philips) has a unique emission wavelength at 254 nm, however the white lamp (125 W Philips) has multi emission wavelengths in the visible range as well as 365 nm in the UV range.
Table. S1. Light power in the UV and visible ranges of the twoecitation sources at a distance of 20 cm. 11W (Philips) TUV 125 W (Philips) white lamp
Wavelength (nm) 254 > 400 365 > 400
Power (mW/cm2) 3 -- 2 21
B) XPS O 1s Peak Observation and Analysis
O 1s core level spectra are presented in Fig; S2 for the three different pressures. In the pure TiO2 films, the peak observed between 530.5 to 531 eV is typically assigned to O—Ti—O bonds. As the working pressure decreased from 14 to 3 mtorr, this peak gradually shifted from 530.6 eV to 531.0 eV. The presence of –OH groups on the surface of the dense samples prepared at lower pressure could have an effect on this shift (in the undoped TiO2). The higher binding energy shoulder, above 531.0 eV, could suggest the presence of surface hydroxyl groups but it could be screened by the C—O contributions. On the other hand, the same observation of peak shift was detected with the Ti 2p spectra in the case of non-doped TiO2 samples (see next section), i.e: the distance between Ti 2p3/2 and the main peak of O 1s (71.5 eV) was not changed when working at different pressures. Therefore one can conclude that there is no reduction in the stoichiometry of TiO2 when we change the deposition pressure, these BE shifts in the O1s spectra have been attributed to the change in the electronic structure within pure TiO2 when changing the deposition pressure.
527 528 529 530 531 532 533 534 535 O1s 3 mtorr 35 % 30 % 25 % 15 % TiO2
Binding Energy (eV)
In tensit y ( a.u.) 527 528 529 530 531 532 533 534 535 35 % 30 % 26 % TiO2 In tens it y ( a.u.)
Binding Energy (eV)
O1s 7 mtorr 527 528 529 530 531 532 533 534 535 60 % 48 % 40 % TiO2 O1s 14 mtorr
Binding Energy (eV)
In
te
ns
ity
(a.u.)
Fig. S2. O1s core level spectra for different nitrogen flow rate percentage at three different pressures.
Upon deposition under low (3 mtorr) and medium (7 mtorr) pressures, the incorporation of nitrogen into the TiO2 anatase lattice induced another shift in the O1s peaks towards lower binding energies due to the Ti—N—O and Ti—O—N—O contributions rather than the O—Ti—O of TiO2, which is consistent with many reports about N doped TiO2. At higher pressure (14 mtorr), no shift in the O 1s core level has been detected. This could be due to the dominance of the interstitial nitrogen
sites at higher deposition pressure (Table 1) in the form of –NO or –NO2 which could be enhanced by oxygen diffusion within these coatings. The oxygen diffusion could decrease the density of defects in the more porous doped samples (deposited at higher pressure) resulting in an increase in the interstitial sites of N rather than the substitutional sites.
C) XPS Ti 2p Peak Observation and Analysis
From Fig. S3, the spectra of Ti 2p of the undoped TiO2 films exhibited a Ti 2p3/2 binding energy between 459 to 459.5 eV, depending on the deposition pressure, which is in excellent agreement with the values reported for anatase TiO2. This indicated that the titanium was in a fully oxidized state of Ti4+ (O–Ti–O bonds of anatase). The broadening towards lower binding energies, after nitrogen doping, could indicate a partial reduction of the titanium cations as Ti—N species appeared at lower oxygen ratio i.e. higher nitrogen percentage, this supports that the incorporation of this nitrogen species became favoured in partially reduced TiO2 networks (to substitute the oxygen vacancies). 458 460 462 464 466 Ti 2p 3 mtorr 35 % 30 % 25 % 15 % TiO2 In te ns it y ( a.u .)
Binding Energy (eV)
458 460 462 464 466 35 % 30 % 26 % TiO2 Coun ts ( a. u) Ti 2p 7 mtorr
Binding Energy (eV)
458 460 462 464 466 60 % 48 % 40 % TiO2 Ti 2p 14 mtorr
Binding Energy (eV)
In
tens
ity (a.u.)
Fig. S3. Ti 2P spectra including 1/2 and 3/2 spins for different nitrogen flow rate percentages at three different
pressures 3, 7 and 14 mtorr, from left to right respectively.
When depositing at low pressure (3 and 7 mtorr), the shift of the Ti 2p3/2 binding energies from 459.4 to 458.7 eV is related directly to nitrogen incorporation. However, no shift or shoulders (as compared to pure TiO2) were observed in the samples prepared at 14 mtorr, as nitrogen was mostly incorporated in interstitial sites which are not directly linked to Titanium.
In summary, the broadening of Ti 2p peaks (towards lower binding energies) is mostly combined with an increase in the N 1s core level intensity, indicating the presence of oxy-nitride bondings. Substitutional nitrogen in the N-doped TiO2 is generally accompanied with a shift in the O 1s and Ti 2p energies toward lower binding energies, while interstitial nitrogen doping leads to negligible shifts in the Ti 2p and O 1s BE.
D) Correlation between the photo responses and the different nitrogen sites 0 5 10 15 20 25 30 35 40 0 2 4 6 8 10 N ratio (%)
(a)
2,0 2,2 2,4 2,6 2,8 3,0 3,2 3,4 PEC Eg PCA Eg (e V ) 0 10 20 30 40 50 60 70 PC A % PE C ( µ A)0 5 10 15 20 25 30 35 40 N C onc en tration ( at. % ) N ratio (%)
(d)
N I N III 0,0 0,5 1,0 1,5 2,0 2,5 3,0 3,5 4,0 4,5 5,00 5 10 15 20 25 30 35 40 45 50 0 2 4 6 8 10 PEC Eg PCA Eg (e V ) N ratio (%) 2,0 2,2 2,4 2,6 2,8 3,0 3,2 3,4
(b)
0 10 20 30 40 50 60 70 PC A ( % ) PEC ( µ A )0 5 10 15 20 25 30 35 40 45 50 N I N III N C on ce ntr at io n ( at. % ) N ratio (%)
(e)
0,0 0,5 1,0 1,5 2,0 2,5 3,0 3,5 4,0 4,5 5,0 0 10 20 30 40 50 60 0 2 4 6 8 10 Eg (e V ) N ratio (%) 2,0 2,2 2,4 2,6 2,8 3,0 3,2 3,4 0 10 20 30 40 50 60 70 PEC Eg PCA(c)
PEC (µ A) PCA ( % ) 0 10 20 30 40 50 60 N C on cen tr at ion ( at. % ) N ratio (%) 0,0 0,5 1,0 1,5 2,0 N I N III(f)
Fig. S4. Correlation between the concentration of different nitrogen sites (NI and NIII) and the 3 different
responses of optical band gap Eg, visible photocatalytic activity PCA and the visible photo-electrochemical
current PEC, for the different N doped TiO2 thin films deposited at (a)(d) 3 mTorr, (b)(e) 7 mTorr and (c)(f) 14