HAL Id: hal-03091388
https://hal.archives-ouvertes.fr/hal-03091388
Submitted on 31 Dec 2020
HAL is a multi-disciplinary open access
archive for the deposit and dissemination of
sci-entific research documents, whether they are
pub-lished or not. The documents may come from
teaching and research institutions in France or
abroad, or from public or private research centers.
L’archive ouverte pluridisciplinaire HAL, est
destinée au dépôt et à la diffusion de documents
scientifiques de niveau recherche, publiés ou non,
émanant des établissements d’enseignement et de
recherche français ou étrangers, des laboratoires
publics ou privés.
Distributed under a Creative Commons Attribution| 4.0 International License
Hydrogen Evolution Reaction on Iron Impurities
Dimitri Mercier, Jolanta Światowska, Elie Protopopoff, Sandrine Zanna,
Antoine Seyeux, Philippe Marcus
To cite this version:
Dimitri Mercier, Jolanta Światowska, Elie Protopopoff, Sandrine Zanna, Antoine Seyeux, et al..
In-hibition of Mg Corrosion by Sulfur Blocking of the Hydrogen Evolution Reaction on Iron
Impuri-ties. Journal of The Electrochemical Society, Electrochemical Society, 2020, 167 (12), pp.121504.
�10.1149/1945-7111/abaf79�. �hal-03091388�
Society
OPEN ACCESS
Inhibition of Mg Corrosion by Sulfur Blocking of the Hydrogen Evolution
Reaction on Iron Impurities
To cite this article: Dimitri Mercier et al 2020 J. Electrochem. Soc. 167 121504
View the article online for updates and enhancements.
Inhibition of Mg Corrosion by Sulfur Blocking of the Hydrogen
Evolution Reaction on Iron Impurities
Dimitri Mercier,
zJolanta
Światowska, Elie Protopopoff, Sandrine Zanna, Antoine Seyeux,
and Philippe Marcus
*
,zChimie ParisTech-CNRS, PSL Research University, Institut de Recherche de Chimie Paris (IRCP), Physical Chemistry of Surfaces Group, 75005 Paris, France
A combination of electrochemical measurements, H2volume measurements and surface analysis using Time-of-Flight Secondary
Ion Mass Spectrometry (ToF-SIMS) and X-ray Photoelectron Spectroscopy (XPS) was used to investigate the role of the metallic Fe impurities (60 ppm) in high purity (99.9 wt%) magnesium and the effect of sulfur on the hydrogen evolution. The Mg corrosion was studied in NaCl solutions containing dissolved hydrogen sulfide. At OCP and under anodic polarization the hydrogen evolution reaction and the growth of dark corroded areas were significantly inhibited in the presence of H2Saq. ToF-SIMS and XPS analyses
showed the presence of sulfur adsorbed on Mg and on Fe segregated at grain boundaries. The observed inhibition of hydrogen evolution at OCP and above is assigned to a poisoning effect by adsorbed S of the H adsorption sites on segregated iron which, in the absence of sulfur, provides catalytic sites for excess HER. The equilibrium Pourbaix diagram for the Mg–Fe–S system including the adsorbed species predicts that S is adsorbed on Mg and Fe in the E-pH conditions of this work, which confirms the role assigned to adsorbed sulfur in the inhibition of excess hydrogen evolution at OCP and under anodic polarization in the presence of H2Saq.
© 2020 The Author(s). Published on behalf of The Electrochemical Society by IOP Publishing Limited. This is an open access article distributed under the terms of the Creative Commons Attribution 4.0 License (CC BY,http://creativecommons.org/licenses/ by/4.0/), which permits unrestricted reuse of the work in any medium, provided the original work is properly cited. [DOI:10.1149/ 1945-7111/abaf79]
Manuscript submitted May 1, 2020; revised manuscript received August 11, 2020. Published August 25, 2020.
Despite very interesting physicochemical properties of magne-sium and magnemagne-sium alloys1 (e.g. low density, good mechanical properties, biocompatibility and recyclability), their applications in transportation,2batteries3and biomedical4sectors are limited due to poor corrosion resistance.1,5
It is well established that Mg corrosion in aqueous media occurs by Mg dissolution coupled to the Hydrogen Evolution Reaction (HER). Under anodic polarization, high rates of Mg dissolution, associated to a high rate of the HER are commonly observed. This effect, called“anomalous” Hydrogen Evolution or negative differ-ence effect (NDE), is in apparent contradiction with the Butler-Volmer kinetic equation of charge transfer predicting a decrease of the HER rate under anodic polarization.6,7
Several mechanisms of Mg corrosion and anomalous HER have been proposed in the past1,5,8 such as the stabilization of Mg(I) monovalent species,9–11 the formation and breakdown of a partial protectivefilm12–15or the formation of hydride intermediates.16–18 One more recent explanation is that the anomalous hydrogen evolution is induced by the catalytic effect of metallic impurities.19–24Different papers demonstrated the presence of iron in the oxide layer (by TEM19), at the oxide(or/and hydroxide)/metal interface (by RBS22) or redeposited at the surface of the Mg substrate (ToF-SIMS24). Other works suggested that Fefilm from Fe redeposition during Mg corrosion is the active cathode for the hydrogen evolution.23However, this conclusion is discussed in the literature and in another recent study it was reported that there is no evidence that transition metal electrodeposition is responsible for the cathodic activity on the corrosion front following the filiform corrosion propagation.25 The authors suggest that Mg or metallic impurities contained in the substrate initially covered by an oxide layer become active when this oxide is removed during anodic magnesium dissolution. In this sense, several studies attempted to determine the influence of the amount of metallic impurities on the Mg corrosion.26–28It was shown that there is a critical concentration (180 ppm for Fe) above which the Mg corrosion rate is drastically accelerated (by a factor of 10–100).27
However, there is no general agreement on the metallic impu-rities involvement in the HER and this hypothesis remains discussed in the literature. An alternative explanation to anomalous HER is that the catalytic activity is the result of high anodic activity at the dissolving Mg interface.29,30 Thus, under anodic polarization, SVET29 or side-view imaging coupled to gravimetric hydrogen measurements30 show that the cathodic activity associated to the dark corroded propagation does not contribute to the overall increase of the HER rate. This explanation is also supported by the fact that no Fe is observed (as for example by EDX31). A kinetic model has been proposed for this hypothesis.32
Our recent study,24using a combination offine chemical surface characterization of Mg substrate, demonstrated that segregated Fe particles cause the anomalous HER and formation of dark corroded areas. Before anodic polarization, 3D ToF-SIMS imaging revealed the segregation of iron at the grain boundaries of so-called “pure” magnesium. Under anodic polarization, the H2 evolution and the
initiation and propagation of dark corroded areas occur mainly at the grain boundary terminations. Fe is also observed on the corrosion front near the dark corroded areas but there is no evidence of redeposited Fe effect on the HER. A mechanism of Mg corrosion including the role of the anodic segregation of iron impurities at the termination of grain boundaries was proposed. From this study, the so-called anomalous HER usually observed under anodic polarization can be attributed to the contribution of segregated Fe or other metallic impurities contained in the Mg substrate. At OCP, the HER is the addition of the“normal” HER occurring on the Mg substrate (governed by the cathodic Butler-Volmer relation), and of what can be defined as excess HER occuring on the segregated metallic impurities.
Although the mechanisms of anomalous hydrogen evolution associated to Mg corrosion are not completely established, many studies are now focused on Mg corrosion inhibition. Assuming the major influence of metal impurities more noble than Mg (mostly Fe) on HER and Mg corrosion, it can be expected that the addition of species lowering the reactivity of these impurities can be a way to decrease the corrosion rate of Mg.
Different inhibitors have been already proposed to hinder he HER and the Mg corrosion. For example, different studies demon-strated a significant influence of arsenate anions on the decrease of corrosion of Mg containing 280 ppm Fe.33The inhibition strongly depends on pH. For a neutral solution, it was assumed that the Mg
zE-mail:dimitri.mercier@chimieparistech.psl.eu;philippe.marcus@chimieparistech.
psl.eu
corrosion was delayed by the precipitation of an insoluble Mg3(AsO4)2layer which covered the active cathodic sites. In acidic
media, the inhibition of Mg corrosion over duration >36 h was evidenced and explained by the electrodeposition of elemental arsenic on the active cathodic sites, that inhibited the HER.33
Assuming that anomalous hydrogen evolution is induced by the re-deposition of Fe on the Mg surface,23a research group developed a new inhibition method using complexing agents (Fe2+and Fe3+ ions) that suppressed the iron electrodeposition.28,34Using specific organic molecules, these researchers proposed three distinct me-chanisms depending on the molecules:28firstly, a cathodic inhibition based on the preferential adsorption of molecules on metallic Fe-rich particles, secondly an anodic inhibition based on the adsorption of molecules on the Mg surface and thirdly a precipitation of released free Fe2+and/or Fe3+ions with complexing inhibitors limiting the electrodeposition of metallic iron.
Along this line, a study reported a screening of more than 150 chemical compounds and identified the most effective for decreasing Mg dissolution and anomalous HER.35However the inhibition effect remains unclear and depends on the nature of the inhibitor. No spectroscopic characterization allows concluding on the effect of inhibitors on the blocking of cathodic sites or on the improvement of the protective layer (for example by precipitation of insoluble species). Only a more detailed knowledge of the Mg corrosion mechanism would allow to determine the most effective action mode and thusfind the inhibitor providing the best protection for Mg substrates.
The inhibition of the HER on pure Fe depends on the experi-mental conditions (e.g. pH and concentrations of inhibitors). A possible inhibitor is dissolved hydrogen sulfide (H2Saq), although it
has been shown that it can either accelerate or inhibit corrosion of Fe.36The inhibition of corrosion of iron was demonstrated in the pH range 3–5 and for H2S concentration lower than 0.04 mmol.dm−3,
37
and for alkaline medium containing H2Saq, our group showed
evidence of the adsorption of sulfur at the oxide/metal interface inhibiting the HER and promoting subsequent anodic oxidation.38
The effect of Sads on a non oxidized metal surface was widely
analyzed in the past. On Pt, H electroadsorption occurs alone on the bare metal surface at underpotential, i.e. positive to the H+/H2
equilibrium potential, by a pseudocapacitive reaction which gives rise to a current wave in voltammetry. It was shown that a monolayer of adsorbed sulfur blocks the H underpotential adsorption sites39,40 and hinders the HER.41,42
The purpose of this work is to demonstrate the role of Fe present in high purity (HP) magnesium (99.9 wt%, 60 ppm of Fe) on the excess hydrogen evolution at open circuit potential or under anodic polarization, and the poisoning by sulfur of the catalytic activity of the Fe particles for the HER. The surface chemical composition of Mg electrodes after OCP and chronoamperometric measurements in chloride solution without and with H2Saq was characterized by
Time-of-Flight Secondary Ion Mass Spectrometry (ToF-SIMS) and X-ray Photoelectron Spectroscopy (XPS). The S surface concentra-tion was measured and the nature of the S surface species discussed. The Pourbaix diagram for the Mg–Fe–S system including adsorbed species was drawn. This allows us to relate the decrease of the HER rate and Mg dissolution in the presence of H2Saqto sulfur adsorbed
on Mg and Fe.
Experimental
Sample preparation.—A Mg foil (rolled, purity 99.9%wt, 60 ppm Fe, Goodfellow, England) with composition reported in TableI
was used in this work. The microstructure obtained after chemical etching is presented in TableI. Samples (disks of 15 mm diameter and 1 mm thickness) were mechanically ground on SiC paper from 2400 grit (about 10μm) to 4000 grit (about 5 μm) then polished on a rotating pad impregnated with alumina suspension (2–3, 1 and 0.3μm). Between each step, the samples were rinsed with pure ethanol. Then samples were sonicated for 10 min in pure ethanol and finally dried with filtered compressed air.
All the glassware used during this study was cleaned with a Piranha solution (H2SO4/H2O2).
Electrochemical measurements.—Electrochemical measure-ments were performed using a conventional three-electrode cell with a magnesium sample as a working electrode, a platinum wire as a counter electrode and a saturated calomel reference electrode (SCE). Measurements were carried out at room temperature in 0.1 mol.l−1 NaCl (AnalaR Normapur, analytical reagent, VWR) without or with 0.01 mol.l−1Na2S·9H2O (Sigma Aldrich). The pH
was adjusted to 6.0 (±0.1) (corresponding to the measured pH of a NaCl solution without H2Saq) by addition of concentrated HCl
(1 mol.l−1) to make sure that dissolved hydrogen sulfide (H2Saq) is
the predominant species (pKa (H2S/HS−)= 7). 43
Potentiodynamic polarization curves were recorded at a scan rate of 1 mV·s−1using an EC-Lab SP200 potentiostat (Bio-Logic Science Instruments SAS, France). Anodic and cathodic domains have been scanned sepa-rately, starting from the OCP. In parallel, dihydrogen has been collected using a classical setup described in the literature.44
Surface chemical analysis and imaging.—The entire surface of Mg samples, before and after electrochemical measurements, was observed by optical microscopy using a digital VHX-5000 Keyence microscope with a magnification from 100 to 1000 (Lens ZR1000). XPS analysis was performed using a Thermo ESCALAB 250 X-ray photoelectron spectrometer with a monochromatic Al-Kα X-ray source (hυ = 1486.6 eV) operating at a pressure of 2.10−9 mbar. Survey and high-resolution spectra were recorded with a pass energy of 50 and 20 eV, respectively, using Thermo Avantage software version 5.966. The spectrometer was calibrated using Au4f7/2 at
84.1 eV. During analysis, charging effects were not compensated. ToF-SIMS analysis was performed using a ToF-SIMS V spectro-meter (ION TOF GmbH, Munster, Germany) operating at 10−9mbar pressure. Negative ions depth profiles were performed by sequen-tially analyzing (Bi+, 1.2 pA, 100× 100 μm2) and sputtering (Cs+, 500 eV, 20 nA, 500× 500 μm2) the sample surface. Data acquisition and post-processing analyses were performed using Ion-Spec soft-ware (version 4.1). MgO− (39.980 amu), MgOH− (40.988 amu), MgS− (55,957 amu) FeO− (71,930 amu) and FeS− (87,907 amu) negative fragments, corresponding to Mg oxide, Mg hydroxide, Mg sulfide, Fe oxide and/or metal and Fe sulfide, respectively, have been analyzed during the depth profiling.
The combination of these two techniques allows us to obtain a quantitative surface chemical composition with a good sensitivity (<0.50 at%) by XPS (500 scans were used to reduce the signal-to-noise ratio) and obtain qualitative chemical information with a very high sensitivity (a few ppm) and a very good in-depth resolution by ToF-SIMS. XPS and ToF-SIMS are highly complementary techni-ques.
Results
Influence of H2S at OCP.—Figure1a shows the evolution of the
open circuit potential measured for a magnesium electrode immersed in 0.1 mol.l−1NaCl electrolyte (a, black line) and 0.1 mol.l−1NaCl electrolyte containing 0.01 mol.l−1 H2S (b, red line) for short
immersion time (30 min). First, a rapid (in thefirst 5 s) drop of the potential, to−1.75 VSCEis observed in both electrolytes. Without
H2S, a plateau is reached after 10 min followed by a weak decrease.
After the plateau, electrochemical noise is observed and can be correlated to the initiation of the dark corroded area and the formation of H2. With H2S, the potential increases slowly and no
plateau is observed. After 30 min no H2 bubble or dark corroded
areas are observed. Optical micrographies obtained after 30 min in NaCl electrolyte (Fig.1C a) show the presence of the well-known darkfiliform corrosion areas characteristic of magnesium corrosion in chloride media. These dark corroded areas are accompanied by strong H2 evolution. In NaCl electrolyte containing H2S, no dark
at the surface of the magnesium electrode. The magnesium sample previously exposed to H2S containing solution during 30 min was
subsequently immersed (without rinsing) in 0.1 mol.l−1NaCl solu-tion without H2S (Fig. 1A c). The evolution of the potential
presented in Fig. 1A c shows a similar behavior to that of the OCP curve observed for sample immediately immersed in NaCl electrolyte (Fig. 1A a). Optical microscopy images show a strong limitation of the growth of the dark corroded areas and a limited evolution of hydrogen was observed during the immersion (Fig.1C c). These results show that hydrogen sulfide inhibits the HER and the growth of the dark corroded areas both for Mg sample immersed in chloride solution with H2S and for Mg sample “conditioned” in
chloride containing H2S and further exposure to chloride solution
without H2S. H2has been collected (every 5 min) during immersion
at OCP for long time (>3 h) in NaCl electrolyte (Fig.1B a)) and in
NaCl electrolyte containing H2S (Fig. 1B b)) and H2 volume
measurements are presented in Fig.1b.
After 30 min immersion in NaCl, OCP continues to increase slowly. This increase is not linear and can be split into two domains (30–120 min and 120 min–240 min). This evolution can be corre-lated to the increase of the collected H2 evolution which presents
also two distinct steps. In the presence of H2S, OCP goes through a
maximum (20 min,−1.53 V SCE−1) before reaching a steady state (−1.56 V SCE−1). In each electrolyte, a final pH of about 11 is measured indicating an alkalization of electrolytes. For each curve, the signal presents a strong noise which appears when H2evolution
begins as already observed.45Evolution of collected H
2volume is
similar for both electrolytes and it could be split into two domains. In the presence of H2S, H2 evolution is always lower (red curve in
Fig.1b). In thefirst domain (0–100 min), hydrogen evolution is not Table I. Chemical composition in parts per million (weight ppm) of the Mg sample (99.99 wt%, purchased from Goodfellow) and microstructure obtained after chemical etching.
Element Al Cu Fe Mn Ni Si Zn Mg
ppm 50 10 60 180 20 180 30 balance
Figure 1. (A): Open circuit potential (OCP) measured for short immersion time (30 min) of a Mg sample in: (a) 0.1 mol.l−1NaCl (black curve), (b) 0.1 mol.l−1 NaCl+ 0.01 mol.l−1Na2S (red curve) and (c)) 0.1 mol.l−1NaCl (mauve curve) after immersion for 30 min in 0.1 mol.l−1NaCl+ 0.01 mol.l−1Na2S. (B):
Variation of open circuit potential (OCP) and evolved dihydrogen volume measured for long immersion time (>3 h) of a Mg sample in (a) 0.1 mol.l−1NaCl (black curve), (b) 0.1 mol.l−1NaCl+ 0.01 mol.l−1Na2S (red curve). (C): Micrographies of Mg samples obtained after short immersion time (<30 min) in (a)
0.1 mol.l−1 NaCl, (b) 0.1 mol.l−1 NaCl + 0.01 mol.l−1 Na2S and (c) 0.1 mol.l−1 NaCl after 0.1 mol.l−1 NaCl + 0.01 mol.l−1 Na2S (mauve curve).
Micrographies of Mg samples obtained after long immersion time (>3 h) in (a) 0.1 mol.l−1NaCl, (b) 0.1 mol.l−1NaCl + 0.01 mol.l−1Na2S. The optical
detectable. Afirst volume of 0.1 ml (which is the first quantitative value that could be measured with our experimental setup) is collected after an immersion of 40 min in NaCl and 90 min in NaCl + H2S, showing the mitigating action of H2S on the H2
evolution In the second domain (>220 min), the H2 volume
follows an almost linear rise which is smaller in the presence of H2S (0.114 ± 0.004 ml.cm−2.min−1 in NaCl solution and 0.034 ±
0.002 ml.cm−2.min−1in NaCl with H2S). In the presence of H2S, H2
evolution is reduced by about 70%, showing a significant effect of H2S on the hydrogen evolution at OCP.
It is to be noted that, for our Mg sample with 60 ppm Fe, in NaCl solution before addition of H2S the amount of H2is high compared
to values of the litterature. For example, some papers have reported a small volume of H2(1.5 ml.cm−2for UHP Mg (Fe: 0.1 ppm)
46
and 3 ml.cm−2 for a HP Mg (Fe: 40 ppm)44) after 80 h immersion in 0.1 mol.l−1NaCl solution while other papers reported a volume of 30 ml.cm−2 in 3.5% NaCl after 10 h immersion (Fe: 45 ppm).27 These different measured H2flows are attributed to the difference of
purity of samples. Other impurities could modify the rate of H2
evolution.
After the immersion tests at OCP for short time (30 min), the Mg samples were analyzed by XPS and compared to a freshly polished Mg substrate (Mg 2p in Fig. 2 and O 1s in Fig. 3). The freshly polished Mg sample spectrum (Fig. 2a, blue line) shows two components at 49.8 and 51.6 eV in the Mg 2p core level region, which can be attributed to metallic and oxide/hydroxide layer, respectively, while the third component at the highest energy (60.3 eV) corresponds to the plasmon loss characteristic of metallic magnesium. After immersion in a 0.1 mol.l−1NaCl solution with or without H2S, the Mg 2p photopeak (Fig.2b, black line and 2c, red
line) shows only one component at a high binding energy of 52.9 eV. It is assigned to magnesium oxide/hydroxide. The binding energy shift, +1.3 eV with respect to the native oxide, is assigned to a charging effect and indicates a thickening of the insulating Mg oxide/ hydroxide layer induced by exposure to the solutions. The thickening of the oxide is also confirmed by the absence of the metallic component at 49.8 eV for samples exposed to NaCl or NaCl+ H2S
and indicates an oxide thickness higher than 11 nm (using a dense and continuous magnesium hydroxide layer model; mean free path:
4.2 nm Mg p Mg OH 2 2 ( )
l = ). The spectra corresponding to the second step
in the OCP measurements in 0.1 mol.l−1NaCl for sample precondi-tioned 30 min in NaCl+ H2S solution are shown in Fig.2d (dark
green line) and 2e (light green line) for “uncorroded” and dark corroded areas, respectively. The absence of the metallic component at 49.8 eV and the larger energy shift (+3 eV and +5.2 eV for uncorroded and dark corroded areas, respectively) also indicates that the Mg oxide layer thickens both in the “uncorroded” and dark corroded regions. However, the most significant energy shift on dark corroded areas indicates the formation of an oxide or hydroxide thicker than on the so called“uncorroded” areas. These observations have already been reported in our previous paper.24In addition, the Mg2p spectrum recorded for the dark corroded areas presents a main component characteristic of the Mg oxide/hydroxide and a weak component at low energy (54.5 eV, Fig.2e, marked by a green arrow). This binding energy already observed for the “uncorroded” areas (Fig.2d) also corresponds to the binding energy of the MgO/Mg(OH)2
components. These results, combined with the optical microscopy observations, clearly show that the dark corroded areas are rough and not homogeneous and comprise some“uncorroded” spots.
The O 1s core level spectra were also analyzed (Fig. 3a) and similarly to the Mg 2p spectra, no charge correction was done. Typically, the O 1s spectrum for the freshly polished Mg sample shows three components47(Fig.3b) corresponding to the oxide Mg–O (531.4 eV), hydroxide Mg–OH (533.3 eV) and oxygen-containing contamination species CxOy(535.0 eV) such as carbonate species. It
was previously proposed by Marcus and coworkers,47that the native layer observed on the polished Mg surface had a duplex structure composed of an inner MgO and an outer Mg(OH)2 layer. After
immersion in 0.1 mol.l−1 NaCl with (Fig. 3A b) or without H2S
(Fig. 3A c), only one component assigned to hydroxylated species (Mg–OH) and shifted towards higher binding energies is observed. The energy shift is similar to the one previously described48on Mg exposed to pure water and assigned to the thickening of the outer Mg(OH)2layer. The thickness of the Mg(OH)2layer does not allow
us to observe the MgO and Mg peaks by XPS and it is not possible to confirm the constant MgO thickness already observed during growing of hydroxide/oxide layer.48Based on inelastic mean free path values classically used49,50 and corrected with specific references of our
group ( O s 2.4 nmand 4.2 nm Mg OH Mg p Mg OH 1( )2 2( )2 l = l = ), a minimum
Mg(OH)2 thickness of 12.6 nm was estimated. As MgO is never
observed after immersion in NaCl and NaCl+ H2S (component at
531.4 eV after charge effect correction), considering a homogeneous hydroxide layer, it is possible to determine the stoichiometry of the hydroxide layer using the O 1s/Mg 2p area ratio. From measured intensities, the at% of each species can be determined using the Eq.1, where I is the intensity measured for each species, λ the inelastic mean free path (nm), σ the relative sensitivity factor and T the transmission factor of the spectrometer.
X at% 100 1 I X T I i T X X X i i i ( ) [ ] ( ) ( )
å
= l s l sThe obtained ratios are close to 2 (1.99 in NaCl solution and NaCl and 1.96 in NaCl+ H2S solution). This confirms the presence
of Mg(OH)2 in the outer part of the oxide film. Thus, it can be
concluded that H2S has no influence on the composition of the outer
layer. After“conditioning” in NaCl + H2S solution and subsequent
immersion in NaCl solution, the values of the O1s/Mg2p ratio are similar (1.87 for the uncorroded area and 1.82 for the dark corroded areas) and indicate that H2Saqdoes not modify the outer Mg(OH)2
layer. The analysis of the Cl 2p core level (Fig.4a)) reveals that after restarting the OCP measurements in 0.1 mol.l−1 NaCl, a slight chloride enrichment can be observed in the dark corroded areas (∼0.4 at% compared to ∼0.2 at% in the uncorroded areas or on the surface after immersion in NaCl solution containing H2S). This
enrichment of chloride species on dark corroded areas was already Figure 2. XPS spectra of Mg 2p core level obtained for Mg sample: (a) after polishing (blue line, triangle), and after immersion at OCP (b) in 0.1 mol.l−1 NaCl (black line, square), (c) 0.1 mol.l−1NaCl+ 0.01 mol.l−1H2S (red line,
circle). XPS spectra of Mg2p core level of the Mg sample immersed in 0.1 mol.l−1 NaCl after immersion for 30 min in 0.1 mol.l−1 NaCl + 0.01 mol.l−1Na2S for the (d) uncorroded area (dark green line, diamond)
and (e) dark corroded area (light green line, star). The green arrow indicates a shoulder.
observed during anodic polarization in NaCl in our previous work24
but it was stronger (about 5 at%) and it could be explained by a higher surface fraction covered by dark corroded areas and a higher surface area due to the surface roughness. While the exact influence of chlorides on the Mg corrosion mechanisms has not been investigated in detail in the literature so far, the presence of chlorides mainly on the dark corroded areas shows an influence of chlorides on the (dendritic) growth of dark corroded areas.
Figure 4b shows the evolution of the S2p spectra obtained for polished Mg (a), and after immersion in 0.1 mol.l−1NaCl electrolyte for 3 min (b) and in 0.1 mol.l−1 NaCl electrolyte containing 0.01 mol.l−1 H2S for 30 min (c). On the polished Mg surface
(Fig. 4B-a), a main spin–orbit doublet at 168.6 eV (S2p3/2) and
169.8 eV(S2p1/2) (after binding energy correction from charging
effect) indicates the presence of sulfate species. A very small amount
of sulfites with components at 167.4 eV (S2p3/2) and 168.5 eV
(S2p1/2) is also observed. The small amount of sulfates, in the order
of 0.20%, results probably from the contamination during glassware cleaning in Piranha solution (H2SO4/H2O2mixture). After
immer-sion in NaCl for 3 min (Fig.4B-b) a strong decrease of the intensity of the peaks corresponding to sulfate and sulfite species is observed indicating that these species are either removed during the sample immersion (and thus do not influence the magnesium corrosion mechanism) or covered by the corrosion products layer. After immersion in NaCl containing H2S (Fig. 4B c), similar peaks,
assigned to sulfates (168.7 and 169.9 eV) and sulfites (167.4 and 168.5 eV) are also observed. The presence of sulfate and sulfite anions may originate from the chemicals used for electrolyte preparation (Na2S·9H2O, SO3
2−contamination <0.5%). However,
the presence of Mg sulfites in the corrosion products cannot be Figure 3. (A): XPS spectra of O1s core level obtained for Mg sample: (a) after polishing (blue line, triangle), after immersion at OCP (b) in 0.1 mol.l−1NaCl (black line, square), (c) in 0.1 mol.l−1NaCl+ 0.01 mol.l−1H2S(red line, circle). XPS spectra of O1s core level obtained for Mg sample after subsequent
immersion in 0.1 mol.l−1NaCl for the(d) uncorroded area (dark green line, diamond) and (e) dark corroded area (light green line, star). The green arrow indicates the shoulder. (B): O1s peak decomposition for a freshly polished Mg sample.
Figure 4. (A): XPS spectra of Cl 2p core level obtained for Mg sample after immersion at OCP in (a) 0.1 mol.l−1NaCl (black line, square) and (b) 0.1 mol.l−1 NaCl+ 0.01 mol.l−1H2S (red line, circle). XPS spectra of Cl2p core level obtained for Mg sample immersed in 0.1 mol.l−1NaCl after immersion for 30 min in
0.1 mol.l−1NaCl+ 0.01 mol.l−1Na2S for the (c) uncorroded area (dark green line, diamond) and (d) dark corroded area (light green line, star). (B): XPS spectra
of S 2p core level obtained for Mg sample: (a) after polishing (blue line), (b) after immersion at OCP in 0.1 mol.l−1NaCl (black line), (c) in 0.1 mol.l−1NaCl+ 0.01 mol.l−1H2S (red line) and associated decomposition.
excluded. The formation of MgSO3 species has been already
observed as corrosion products in presence of SO2traces. 51
In Fig.4B-c, another peak is found at 162.6 eV, characteristic of a sulfur-metal bond. This small S-Met peak observed only when H2S
is added to the electrolyte can be assigned to Sadson metal surfaces.
At these low levels, and due to the detection limit of XPS, it is difficult to discriminate between a Sads–Mg or a Sads–Fe bond.
Indeed the binding energies for S0-Met bonds (Fe,52Ni,53Ni based alloys54,55) vary between 162 and 163 eV. The binding energy measured for the S–Au56 in the case of SAM formation from alkanethiol is similar. At the same energies are also observed FeSx57 and MgSx58 species. The amount of S adsorbed is about 0.08 at% (calculated following Eq.1). The number of scans of the S2p peak has been drastically increased (500 scans) to reduce the signal-to-noise ratio. This value corresponds to the percentage of S (at%) with respect to all species detected by XPS (except carbonaceous species) averaged over the thickness from which XPS signals are measured This low value can be compared with the expected theoretical value for a complete monolayer on segregated Fe (see calculation in the discussion).
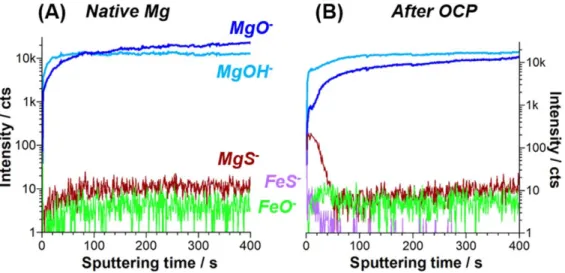
In order to get additional information on the nature of the S species bonded to the metal surface, ToF-SIMS ion depth profiles were performed for a polished Mg sample (Fig. 5a) and for the sample immersed in NaCl electrolyte containing H2S (Fig.5b). The
ions characteristics of the Mg oxide (MgO− at 39.980 amu), Mg
hydroxide (MgOH− at 40.988 amu), Mg sulfide (MgS− at
55.957 amu), Fe (metal or oxide) (FeO− at 71.930 amu) and Fe sulfide (FeS− at 87.907 amu) were used. ToF-SIMS ion depth profiles obtained for the freshly polished Mg sample show high intensity MgO− and MgOH− signals in the whole range of sputtering time (600 s) indicating that the Mg metallic substrate was not reached and only the Mg oxide/hydroxidefilm covering the Mg substrate was analyzed (in agreement with XPS data).
Looking closely at the MgO−and MgOH−signals (Fig. 5a), it can be observed that MgOH−intensity is higher in the outer part of the profile and MgO− is higher in the inner part of the profile suggesting a bilayer structure with an inner Mg rich oxide and an outer Mg rich hydroxide as already observed and discussed above. However, there is no sharp interface. The increase of the MgO− signal and the stability of the MgOH−signal when probing deeper suggest a weak enrichment of MgO oxide in the inner part.
The weak MgS− signal, which does not vary much during sputtering, may originate partly from a low concentration of sulfur initially present in the Mg bulk, although it was not mentioned in the impurities content by the manufacturer. ToF-SIMS has a very high sensitivity and low levels of impurities can be detected. The affinity between sulfur and Mg is well known and Mg is often used in the
desulfuration processes. A closer look at the other fragments shows that the intensity of FeO− is very low through the whole depth profile and FeS−is not detected. According to our previous work describing the presence of metallic Fe particles at the grain boundaries,24it is possible to consider the FeO−signal as a marker of metallic Fe. Indeed, for these very low amounts (not detectable by XPS), the Fe metal signal is too low in the negative polarity and FeO2− at 85.929 amu, which is the marker of oxidized Fe, is not
observed. Thus using the FeO−signal as a marker of metallic Fe in contact with oxidized magnesium is consistent with the fact that the Fe particles segregated at the grain boundaries terminations are electrically connected to the Mg matrix hence at the OCP of magnesium (∼−1.5 V SCE−1), Fe is not oxidized.24
After immersion in H2S containing NaCl solution, the ToF-SIMS
ion depth profiles (Fig. 5b) show again clearly the signals char-acteristic of MgO and Mg(OH)2. The MgOH−signal remains high
(higher than MgO−) through the entire depth profile. This confirms the formation of a thicker hydroxide layer compared to the freshly polished Mg sample, as already observed by XPS.
The FeS−and MgS−signals shown in Fig.5b reach a maximum intensity after about 20 s of sputtering. The MgS−signal intensity decreases after 20 s of sputtering and is similar to that measured on the freshly polished sample (Fig.5a). The FeS−signal also decreases and disappears while the FeO− signal, characteristic of the Fe particles, increases and stabilizes at a level similar to the one observed on the freshly polished sample (Fig.5a). The FeS−and MgS−signals, observed at the beginning of the sputtering time, can be assigned to surface Mg–S and Fe–S corresponding to Sads
resulting from a surface reaction between H2S in the electrolyte
and both the Mg matrix and the Fe particles. The low levels measured for these ions by ToF-SIMS and the small S 2p XPS signal at low binding energy both indicate a small surface coverage by adsorbed sulfur.
The MgS−signal could also be attributed to Mg sulfite in the corrosion products, however this would imply that characteristic
fragments of MgSO3 (MgSO− at 71.952 amu, MgSO2− at
87.947 amu and MgSO3−−at 103.942 amu) were observed, which
is not the case.
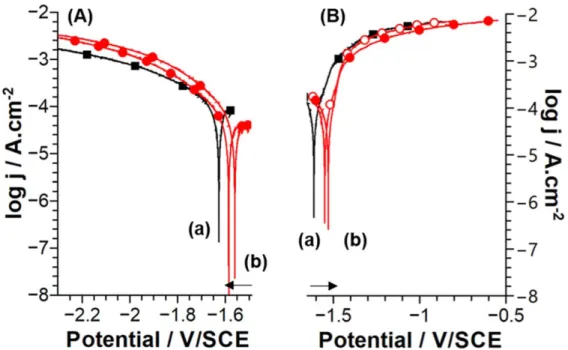
Influence of H2S on the polarization behaviour of Mg.—
Figure6presents the potentiodynamic polarization curves obtained for a magnesium electrode in 0.1 mol.l−1 NaCl without and with 0.01 mol.l−1 H2S. These experiments were performed in a
non-deaerated electrolyte and in a single upward scan at a rate of 1 mV s−1after immersion at OCP for 2 min in NaCl electrolyte and 10 min in NaCl/H2S electrolyte. Anodic and cathodic domains have
been scanned separately and starting near the OCP (OCP+ 0.05 V
Figure 5. (a): ToF-SIMS ion depth profiles (FeS−, MgS−, FeO2−, MgO2−and MnO2−) for a polished Mg sample. (b): ToF-SIMS ion depth profiles (FeS−,
for the cathodic domain and OCP− 0.05 V for the anodic domain). The value of OCP (∼−1.55 V SCE−1) is similar for both immersion times. As described previously,24 after this time of immersion in NaCl, no dark corroded areas and no bubble formation are observed. The shape of the curves is similar for both solutions and consistent with the literature for high purity Mg samples.20,46For both media, no passive domain is observed. H2S has no strong effect on the
anodic current and on the corrosion potential. The cathodic current is slightly higher in the presence of H2S, which may be explained by a
blocking effect of sulfur on the formation of Mg surface oxide/ hydroxide limiting the cathodic reaction.
To understand the behavior in the anodic domain, potentiostatic polarizations have been performed in NaCl and NaCl containing H2S
at low anodic overpotential (OCP + 0.25 V, corresponding to −1.32 V SCE−1) and H
2 gas has been collected simultaneously
(Fig.7). Polarizations have been stopped after aflowed charge of at least 6 C.cm−2. Micrographies obtained after a charge of
0.25 C.cm−2 and at the end of the polarization (>6 C.cm−2) are also presented in Fig.7. As at OCP, H2gas evolution follows a same
trend for both electrolytes but is always lower in the presence of H2S. In contrast to the OCP, the first domain attributed to the
initiation of the H2evolution is very short. Then, the collected H2
volume increases almost linearly. The decrease of the H2evolution
rate in the presence of H2S is similar to that observed at OCP (∼75%
decrease under anodic polarization and ∼70% decrease at OCP). While the evolution rate is similar, the required time to collect 5 ml of H2is longer under anodic polarization (90 min) compared to OCP
(300 min). Micrographies of surfaces in the presence of H2S show a
limitation of the dark corroded areas.
XPS analyses performed on the Mg samples after the anodic polarizations at OCP+ 0.25 V and OCP + 0.5 V for a charge of up to 250 mC.cm−2allowed us to determine the O 1s/Mg 2p ratio. The dark corroded areas covering the surface at high charges (6 C.cm−2) led to inhomogeneous surfaces and interpretation of data obtained by Figure 6. Potentiodynamic polarization curves (A cathodic; B anodic) obtained obtained at 1 mV s−1for Mg in (a) 0.1 mol.l−1NaCl (black line, squares) and (b) 0.1 mol.l−1NaCl+ 0.01 mol.l−1Na2S (red line, circles). The arrows indicate the direction of the scans.
Figure 7. Volume of evolved H2as a fucntion of charge obtained during anodic polarization (OCP+ 0.25 V) in (a) 0.1 mol.l-1 NaCl and (b) 0.1 mol.l-1 NaCl +
XPS on these surfaces is quite complex. This O1s/Mp2p ratio (1.9 close to expected 2) does not depend on the nature of the electrolyte or the overpotential, which indicates that the anodic polarization has no effect on the global stoichiometry of the layer which remains mainly composed of hydroxide in the outer part. A significant charging effect is also observed for these two samples indicating an insulating character of the surface explained by a thickening of the hydroxide layer. The corresponding binding energy shift in NaCl solution containing H2S is estimated to 4.1 eV and
4.2 eV for the samples polarized at OCP+ 0.25 V and OCP + 0.5 V, respectively. For comparison, in NaCl solution, this shift is estimated to 1.9 and 2.2 eV for the samples polarized at OCP+ 0.25 V and OCP + 0.5 V, respectively. The amount of chlorine is also similar (about 0.5 at%) without or with H2S and after the two polarizations.
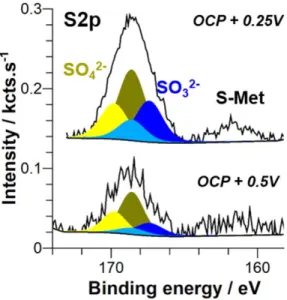
After anodic polarization in NaCl+ H2S solution a sulfur signal
is also observed by XPS (Fig. 8) as after OCP measurements (Fig.4). Again it shows the doublet peaks corresponding to sulfate (168.6 and 169.8 eV), sulfite (167.4 and 168.5 eV) and the peak indicative of a surface S-Met bond (at 162.6 eV). By selecting the best XPS experimental conditions for the analysis of the latter peak,
particularly by increasing the number of scans to 500, we could reduce the signal-to-noise ratio and thus enhance the quantitative analysis. The amount of adsorbed sulfur measured by XPS is low and varies from 0.08 at% for the sample immersed at OCP, to 0.05 at% for the sample polarized at OCP+ 0.25 V and to 0.03 at% for the sample polarized at OCP+ 0.5 V. These at% correspond to the S amount measured in the analyzed volume. These atomic percents are determined considering all species quantified by XPS (using Mg2p, O1s, Cl2p, S2p) except carbonaceous species (C1s peak).
As already mentioned in the analysis of Fig. 4, the low binding energy peak is assigned to Sadson segregated Fe particles and on Mg.
The ToF-SIMS ion depth profiles obtained after anodic polariza-tion in 0.1 mol.l−1NaCl+ 0.01 mol.l−1H2S at OCP+ 0.25 V and
OCP+ 0.5 V are presented in Figs.9a and9b, respectively. As after immersion at OCP in NaCl+H2S solution (Fig.5), the profiles show
a strong modification compared to the ToF-SIMS depth profiles obtained on the freshly polished Mg sample (see discussion about Fig.5). The two ToF-SIMS ion depth profiles in Fig.9show intense MgOH−signals, that remain higher than the MgO−signal over the whole analyzed thickness. This indicates an outer Mg-rich hydro-xide, as already observed by XPS (see discusion about Fig. 3). Compared to the ToF-SIMS analysis performed after immersion at OCP in NaCl+ H2S electrolyte (Fig. 5), the analyses carried out
after anodic polarization show a slightly different behaviour for the FeS−and MgS−fragments. In particular, the maximum of the MgS− signal is slightly shifted (∼20 s for Eocp+ 0.25 V and ∼70 s for Eocp
+ 0.5 V) suggesting that the species with Mg–S bond is slighty buried into the hydroxide layer when the potential increases. The FeS− fragment follows the same trend as previously observed (Fig.5) with a complete and fast decrease of the signal indicating that the S–Fe species is located at the surface. Compared to the results obtained after immersion without anodic polarization (see Fig. 5), the FeO− fragment (characteristic of metallic iron as explained previously) appears simultaneously with the FeS− for the low anodic polarization and in a large domain similar to that observed for the FeS− fragment for the high anodic polarization suggesting the presence, at the same location, of Fe–S and metallic Fe species in the outer layer. The presence of the FeO−signal in the whole profile confirms the existence of metallic Fe segregating at the grain boundary terminations. Under anodic polarization, a porous Mg(OH)2layer covers the segregated Fe. However the connectivity
of the segregated iron particles and the porosity of the Mg(OH)2
layer can maintain the catalytic activity of Fe on the HER. The evolution of the MgS−signal is similar to that observed previously (Fig.5a) with a final intensity slightly higher than for the freshly Figure 8. XPS spectra of S 2p core level obtained for Mg samples after
anodic polarization in 0.1 mol.l−1 NaCl + 0.01 mol.l−1 H2S at OCP +
0.25 V and OCP+ 0.5 V.
Figure 9. (a): ToF-SIMS ion depth profiles (FeS−, MgS−, FeO2−, MgO2−and MnO2−) of a Mg sample obtained after anodic polarization (OCP+ 0.25 V,
500 mC.cm−2) in 0.1 mol.l−1NaCl+ 0.01 mol.l−1H2S electrolyte. (b): ToF-SIMS ion depth profiles (FeS−, MgS−, FeO2−, MgO2−and MnO2−) of a Mg
polished sample. Moreover, the shape of the MgS− signal profile suggests the presence of Mg–S species in the Mg hydroxyde layer.
Discussion
As reported in the introduction, it has been suggested that metallic impurities in the Mg substrate, particularly Fe play a main role in the hydrogen evolution reaction and the enhancement of Mg corrosion.19,22–24,27Recently our group has shown the role of residual metallic Fe segregated at grain boundaries, on the Mg corrosion and HER.24From the experiments reported in the present work it is observed that the growth of dark corroded areas associated with a significant rate of HER is strongly limited by the addition of sulfides into the NaCl electrolyte. This effect is explained by the XPS results showing a S2p photopeak at 162.6 eV characteristic of a metal-adsorbed sulfur bond, and the detection, by ToF-SIMS, of FeS−and MgS−ions, which are assigned to the adsorption of S on Fe and Mg.
The adsorption of S and its effect on hydrogen evolution has been previously studied on different metallic surfaces. It was shown on platinum single crystal surfaces that the adsorption of H at under-potential strongly decreases when the coverage of adsorbed sulfur increases, and is prevented by a complete sulfur monolayer, which indicates a strong blocking of the H sites by adsorbed sulfur.39,40 The HER rate at a given potential is also strongly reduced (the HER overpotential increases) when the sulfur coverage increases, which was explained by a partial blocking of the HER sites.41,42The effects of adsorbed sulfur on different metal substrates have been reviewed, and the mechanisms of the blocking of the reactive sites by sulfur rationalized.59,60It was also observed that adsorbed sulfur drastically impedes the HER on Ni61in acidic solution and on Fe38in alkaline solution. Moreover, it was previously shown that a stable sulfur monolayer accelerates the metal dissolution on Ni, NiFe and Fe by blocking the O adsorption sites required for the growth of a passive film.52,62–64
The electrochemical measurements combined with H2 volume
collection and optical observations show that sulfur has a significant effect both on the Mg corrosion and the HER. A decrease of ∼70%–75% of the evolved H2volume is observed in the presence of
H2S at OCP and under anodic polarization.
In order to highlight the relationship between sulfur and Mg corrosion in H2S-containing solution, we examine the possibility that
sulfur adsorbing on a Mg electrode surface from H2Saqcould block
the HER sites on metallic Fe particles segregated at the Mg grain boundaries.24
The amount of S adsorbed on Fe segregated during immersion at OCP can be assessed as follows. Using the polarization curve (Fig.6), the corrosion current density has been only estimated using the Tafel slopes extrapolation (not shown here because this is only to get an approximate value, as the potential range of Tafel behaviour is limited). A value of about 90μA.cm−2is obtained in the presence of H2S. With this current density for a time of 1800 s, using the
Faraday law, the amount of dissolved Mg is calculated to be 2.0 10−5g.cm−2which corresponds to a 5.0 1018 at.cm−2. The initial content of Fe impurity in Mg is 60 weight ppm hence the atomic ratio Fe/Mg in the bulk is equal to 2.6 10−5. Whereas Mg is dissolved, Fe accumulates at the surface by anodic segregation, and the amount of Fe at the surface is calculated to be 1.3 1013at.cm−2. Considering that on Fe a complete monolayer of Sadscorresponds to
a ratio S/Fe= 0.5, as determined on Fe surfaces,65,66 a complete monolayer of S on Fe segregated at the Mg surface would give a surface density of 6.5 1012 at.cm−2. From the XPS spectra, the global S% (average value for the depth analyzed by XPS) was estimated at 0.08 at%. Assuming that the surface layer is mainly composed of Mg(OH)2 (molar density: 0.04 mol.cm−3) for the
analyzed volume (depth of 12 nm), the sum of surface densities for all measured species is estimated to 8.7 1016 at.cm−2. The S surface density corresponding to the percentage of 0.08 measured by XPS is about 7.0 1013 at.cm−2, i.e. much higher than the value
estimated above (for a dissolution of 1800 s) for a full monolayer of S adsorbed on segregated Fe, showing that S is also adsorbed on Mg. Similar calculations have been carried out after anodic polarization. The same charge (250mC.cm−2) has beenflowed at the two anodic potentials (OCP+0.25 V and OCP + 0.5 V) (see Fig.8). The Sads
surface density obtained from XPS data is 4.3 1013at.cm−2at OCP +0.25 V and 2.6 1013
at.cm−2 at OCP + 0.5 V. These values are lower than the value at OCP but still higher than the density corresponding to a full monolayer of Sadson segregated Fe.
In addition to S bonded to Fe (evidenced by the FeS−signal in ToF-SIMS, and consistent with the S2p signal at low binding energy in XPS), the excess of the full monolayer on Fe is assigned to Mg–S species, which is consistent with the MgS−signal in ToF-SIMS. The Mg–S species, resulting from the reaction of H2S with Mg, could
remain trapped in the hydroxide layer.
Summarizing our results, it appears that sulfur is adsorbed on Mg and on segregated Fe. The amount of adsorbed sulfur is sufficient to form a complete monolayer on segregated Fe and this explains the inhibiting effect observed on HER. When the applied potential is increased anodically from OCP, the Sadssurface density decreases,
which can be related to the observed limited inhibition of HER and of associated dark corroded areas growth (Fig.7). This suggests that the coverage of Sadson segregated Fe is lower when the potential
increases.
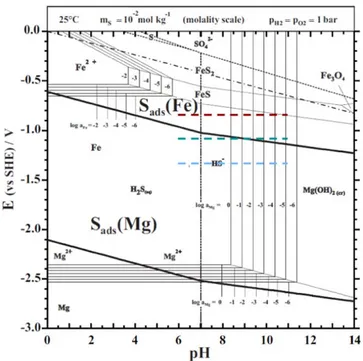
In order to better understand the influence of S on Mg and Fe electrochemical behaviour, the equilibrium potential-pH diagram for the Mg–Fe–S system including the adsorbed species was calculated (Fig.10) (the principle of calculation of the E-pH lines for adsorbed species is described in Ref. 67). This diagram shows the stability domains of atomic S adsorbed on Mg, denoted Sads(Mg) and S
adsorbed on Fe, denoted Sads(Fe).
The electrochemical equilibrium of S adsorption on a metal (Mg or Fe) surface from H2Saqcan be written as
67
:
Figure 10. E-pH equilibrium diagram for the Mg–Fe–S system, showing the thermodynamically stable forms of dissolved S, dissolved species and solid compounds of Mg and Fe, and also S adsorbed on the Mg and Fe surfaces from dissolved sulfides (H2Saq or HS–). The activities (on the molal scale)
are: aS=10−2, aMg=1 to 10−6, and aFe = 10−2to 10−6. The bold lines
indicate the E-pH lines for the S adsorption equilibria at half-saturation of the surface. The method for estimating thermochemical data used in calculation of the lines for adsorption is given inAppendix. (blue circle: OCP, green circle: OCP + 0.25 V and brown circle OCP + 0.50 V). the potentials investigated are indicated as color segments: blue line: OCP, green line: OCP + 0.25 V and brown line: OCP + 0.50 V.
H S2 aq+( )M = Sads( )M +H++e- [ ]2 where (M) represents a free M surface adsorption site.
The diagram indicates that at pH 6, corresponding to the experimental conditions used in this work, sulfur should adsorb on the Mg surface when increasing the potential from the cathodic region.
At pH 6, above∼−1 V/SHE, S can adsorb on the Fe surface at lower (more negative) potentials than the potentials of formation of the Fe sulfides, indicating the excess of stability of the 2D phase as compared to the 3D compounds. The potentials at which the experiments reported here were performed (from −1.3 V/SHE to −0.8 V/SHE), are located only partially in the E-pH stability domain of sulfur adsorbed on Fe. The lower potentials corresponding to OCP are located ∼0.2 V below the bold full line representing the S adsorption equilibrium at half-saturation coverage on the surface. In our previous work on S adsorption on silver,68it was shown that the half-saturation adsorption potential measured from experiments using voltammetry combined with electrochemical in situ STM69 was lower by ca. 0.1 V than the value calculated from gas phase experiments.68Moreover it should be noted that the S adsorption line drawn in Fig. 10 is calculated at half-saturation coverage from estimated data for S adsorption (cf.Appendix), using the Langmuir model of adsorption where all the adsorption sites are similar, whereas real S adsorption begins on the more stable sites of the surface (such as defects) at potentials more negative (some hundreds
of mV) than the line at half-saturation coverage. Drawing the lines for low S coverage would give a larger thermodynamic stability domain for Sads(Fe).
On a Mg electrode with metallic Fe segregated at the surface, the potential is imposed by the Mg matrix to the surface Fe. Our thermodynamic calculations indicate that for the potentials used in this work (from OCP to OCP+0,5 V), S is adsorbed from H2Saqboth
on Mg and segregated Fe.
In contrast to ourfindings, other authors argue that the anomalous hydrogen evolution is not associated with the presence of metallic impurities in the Mg matrix but is the result of very high corrosion current densities at the actively corroding front.29,30This hypothesis is mostly supported by the fact that no Fe is observed during characterization (for example by EDX31). These observations are in contrast with other works showing the presence of Fe, as for example using TEM,19RBS22 and ToF-SIMS.24Using ToF-SIMS imaging, a very sensitive technique allowing the detection of a few ppm, the presence of Fe at the emergence of grain boundaries was evidenced.24In the present work, the presence of FeS−and FeO− fragments (in very low amount, too low to be detected by XPS) confirms the presence of surface Fe. Thus, this work, associated to our previous work24confirms the role of segregated Fe on the HER at OCP and above.
Finally, a schematic representation of the mechanism of Mg corrosion showing the role of metallic Fe impurities segregated at grain boundaries surface terminations in the excess hydrogen evolution was proposed in a previous paper.24 An extended Figure 11. Mechanisms of Mg corrosion at OCP and above (anodic overpotential) and inhibition of excess HER by S adsorption on Fe segregated at the surface.
model incorporating the blocking by Sads(Fe) of the excess
hydrogen evolution sites on the surface Fe particles is shown in Fig.11.
At OCP in chloride solution.—During Mg dissolution, Fe enrichment at the Mg surface occurs by anodic segregation. The Fe particles (shown in red on Fig. 11a) segregated at the grain boundaries surface terminations supply catalytic sites for the HER, explaining the excess H2 evolution on Mg compared to the HER
deduced from extrapolation of the cathodic branch.
At OCP in the presence of H2S in the chloride solution.—In the
presence of H2Saq, (orange on Fig.11b) S is adsorbed on the Fe
particles segregated at the grain boundaries surface terminations during the Mg corrosion. This Sadsmonolayer inhibits the HER and
the development of the dark corroded areas. Simultaneously, a porous Mg(OH)2forms from Mg
2+released during Mg dissolution.
Some Mg released by the corrosion process reacts with S and the Mg–S species remain trapped in the Mg(OH)2layer.
Under polarization in H2S containing chloride solution.—
Under anodic polarization (Fig. 11c), a similar mechanism is proposed. Anodic segregation of metallic Fe at the grain boundaries surface terminations takes place, and the adsorption of S blocks the iron surface sites for HER.
Conclusions
The influence of iron impurities corrosion of magnesium (con-taining 60 ppm of Fe) and on the Hydrogen Evolution Reaction at OCP and above (OCP+ 0.25 V; OCP + 0.5 V) in 0.1 mol.l−1chloride solution (pH6) without and with Na2S (0.01 mol.l−1) was investigated
by XPS, ToF-SIMS, electrochemical measurements and H2volume
measurements.
The addition of H2S to the electrolyte leads to a significant
corrosion mitigation associated with a inhibition of the Hydrogen Evolution Reaction, of ∼70% at OCP and of ∼75% under anodic polarization.
Combining XPS and ToF-SIMS analyses, the presence of adsorbed sulfur, corresponding to a low surface coverage on Mg and a high coverage on Fe, was evidenced.
Sulfur adsorbed from H2Saqon the Fe particles segregated at the
grain boundaries terminations inhibits the excess HER (also called “anomalous” HER) by poisoning the Fe catalytic sites.
The surface analysis also indicates the presence of Mg–S species trapped in the Mg(OH)2layer.
The potential-pH diagram for the Mg–Fe–S system including the adsorbed sulfur species (Sads) was calculated. It shows the E-pH
domains of stability of Sadson Fe and Mg, which are consistent with
the experimental results.
A model was proposed for the mechanisms of Mg corrosion including the role of the segregated Fe impurities and the inhibition of the excess HER at OCP and above by adsorption of S on Fe particles.
Appendix A
The equilibrium potential-pH diagram for the Mg–Fe–S system was calculated using thermochemical data from NBS.70The Gibbs free energies of formation for sulfur adsorbed on iron were calculated from gas phase data and presented in a previous paper.67 Since there was no available data for sulfur adsorbed on Mg (2D phases), we estimated the thermodynamic values from the ones available for the most stable 3D sulfide, i.e. MgS,70as follows: for the adsorption enthalpies, we used an empirical correlation established between the enthalpies of formation of the most stable metallic sulfides and the enthalpies of adsorption of sulfur.65 The entropy of adsorbed sulfur was estimated from the entropy of MgS and Mg using a relation presented previously.67
ORCID
Dimitri Mercier https://orcid.org/0000-0002-9637-1484
Philippe Marcus https://orcid.org/0000-0002-9140-0047
References
1. M. Esmaily, J. E. Svensson, S. Fajardo, N. Birbilis, G. S. Frankel, S. Virtanen, R. Arrabal, S. Thomas, and L. G. Johansson,Prog. Mater Sci., 89, 92 (2017). 2. T. B. Abbott,Corrosion, 71, 120 (2015).
3. T. Zhang, Z. Tao, and J. Chen,Mater. Horiz., 1, 196 (2014). 4. F. Witte,Acta Biomater., 23, S28 (2015).
5. A. Atrens, G.-L. Song, M. Liu, Z. Shi, F. Cao, and M. S. Dargusch,Adv. Eng. Mater., 17, 400 (2015).
6. G. S. Frankel, S. Fajardo, and B. M. Lynch,Faraday Discuss., 180, 11 (2015). 7. A. Atrens and W. Dietzel,Adv. Eng. Mater., 9, 292 (2007).
8. S. Thomas, N. V. Medhekar, G. S. Frankel, and N. Birbilis,Curr. Opin. Solid State Mater. Sci., 19, 85 (2015).
9. R. L. Petty, A. W. Davidson, and J. Kleinberg,JACS, 76, 363 (1954). 10. P. Brouillet, I. Epelboin, and M. Froment, Comptes Rendus Hebdomadaires Des
Seances De L Academie Des Sciences, 239, 1795 (1954).
11. G. Song, A. Atrens, D. S. John, X. Wu, and J. Nairn,Corros. Sci., 39, 1981 (1997). 12. P. F. King,J. Electrochem. Soc., 110, 1113 (1963).
13. R. Tunold, H. Holtan, M. Hagg Berge, A. Lasson, and R. Steen-Hansen,Corros. Sci., 17, 353 (1977).
14. L. Petrova and V. Krasnoyarskii, Prot. Met., 23, 342 (1987).
15. G. Song, A. Atrens, D. Stjohn, J. Nairn, and Y. Li,Corros. Sci., 39, 855 (1997). 16. G. G. Perrault,J. Electroanal. Chem. Interfacial Electrochem., 51, 107 (1974). 17. A. Nazarov, A. Lisoskii, and Y. Mikhailovskii, Prot. Met., 25, 606 (1989). 18. E. Gulbrandsen,Electrochim. Acta, 37, 1403 (1992).
19. M. Taheri, J. R. Kish, N. Birbilis, M. Danaie, E. A. McNally, and J. R. McDermid, Electrochim. Acta, 116, 396 (2014).
20. N. Birbilis, A. D. King, S. Thomas, G. S. Frankel, and J. R. Scully,Electrochim. Acta, 132, 277 (2014).
21. D. Lysne, S. Thomas, M. F. Hurley, and N. Birbilis,J. Electrochem. Soc., 162, C396 (2015).
22. T. Cain, S. B. Madden, N. Birbilis, and J. R. Scully,J. Electrochem. Soc., 162, C228 (2015).
23. D. Hoche, C. Blawert, S. V. Lamaka, N. Scharnagl, C. Mendis, and M. L. Zheludkevich,Phys. Chem. Chem. Phys., 18, 1279 (2016).
24. D. Mercier, J.Światowska, S. Zanna, A. Seyeux, and P. Marcus,J. Electrochem. Soc., 165, C42 (2018).
25. E. Michailidou, H. N. McMurray, and G. Williams,J. Electrochem. Soc., 165, C195 (2018).
26. G. L. Makar and J. Kruger,Int. Mater. Rev., 38, 138 (1993).
27. M. Liu, P. J. Uggowitzer, A. V. Nagasekhar, P. Schmutz, M. Easton, G.-L. Song, and A. Atrens,Corros. Sci., 51, 602 (2009).
28. J. Yang, C. Blawert, S. V. Lamaka, K. A. Yasakau, L. Wang, D. Laipple, M. Schieda, S. Di, and M. L. Zheludkevich,Corros. Sci., 142, 222 (2018). 29. S. Fajardo, C. F. Glover, G. Williams, and G. S. Frankel,Electrochim. Acta, 212,
510 (2016).
30. M. Curioni, J. M. Torrescano-Alvarez, Y. F. Yang, and F. Scenini,Corrosion, 73, 463 (2016).
31. A. D. Gabbardo, G. Viswanathan, and G. S. Frankel,J. Electrochem. Soc., 166, C3266 (2019).
32. S. Fajardo and G. S. Frankel,Electrochem. Commun., 84, 36 (2017). 33. D. Eaves, G. Williams, and H. N. McMurray,Electrochim. Acta, 79, 1 (2012). 34. S. V. Lamaka, D. Höche, R. P. Petrauskas, C. Blawert, and M. L. Zheludkevich,
Electrochem. Commun., 62, 5 (2016).
35. S. V. Lamaka, B. Vaghefinazari, D. Mei, R. P. Petrauskas, D. Höche, and M. L. Zheludkevich,Corros. Sci., 128, 224 (2017).
36. H. Ma, X. Cheng, G. Li, S. Chen, Z. Quan, S. Zhao, and L. Niu,Corros. Sci., 42, 1669 (2000).
37. K. Videm and J. Kvarekvål,Corrosion, 51, 260 (1995).
38. B. Tian, J. Swiatowska, V. Maurice, S. Zanna, A. Seyeux, and P. Marcus, Electrochim. Acta, 259, 196 (2018).
39. P. Marcus and E. Protopopoff,Surf. Sci., 161, 533 (1985). 40. E. Protopopoff and P. Marcus,Surf. Sci., 169, L237 (1986).
41. E. Protopopoff and P. Marcus,Journal of Vacuum Science & Technology A, 5, 944 (1987).
42. E. Protopopoff and P. Marcus,J. Electrochem. Soc., 135, 3073 (1988). 43. M. Pourbaix, Atlas d’Equilibres Electrochimiques (Gauthier Villars, Paris) p. 644
(1963).
44. G. S. Frankel, A. Samaniego, and N. Birbilis,Corros. Sci., 70, 104 (2013). 45. G. Williams and H. N. McMurray,J. Electrochem. Soc., 155, C340 (2008). 46. S. Fajardo and G. S. Frankel,Electrochim. Acta, 165, 255 (2015).
47. M. Liu, S. Zanna, H. Ardelean, I. Frateur, P. Schmutz, G. Song, A. Atrens, and P. Marcus,Corros. Sci., 51, 1115 (2009).
48. M. Santamaria, F. D. Quarto, S. Zanna, and P. Marcus,Electrochim. Acta, 53, 1314 (2007).
49. S. Tanuma, C. J. Powell, and D. R. Penn,Surf. Interface Anal., 21, 165 (1994). 50. H. Shinotsuka, S. Tanuma, C. J. Powell, and D. R. Penn,Surf. Interface Anal., 47,
871 (2015).
51. M. Esmaily, D. B. Blücher, R. W. Lindström, J.-E. Svensson, and L. G. Johansson, J. Electrochem. Soc., 162, C260 (2015).
52. G. Seshadri, T.-C. Lin, and J. A. Kelber,Corros. Sci., 39, 987 (1997). 53. A. Galtayries, C. Cousi, S. Zanna, and P. Marcus,Surf. Interface Anal., 36, 997
(2004).
54. P. Marcus and J. M. Grimal,Corros. Sci., 31, 377 (1990).
55. L. Rivoaland, V. Maurice, P. Josso, M.-P. Bacos, and P. Marcus,Oxid. Met., 60, 137 (2003).
56. Y. W. Yang and L. J. Fan,Langmuir, 18, 1157 (2002).
57. M. Descostes, F. Mercier, N. Thromat, C. Beaucaire, and M. Gautier-Soyer,Appl. Surf. Sci., 165, 288 (2000).
58. H. S. Kim, T. S. Arthur, G. D. Allred, J. Zajicek, J. G. Newman, A. E. Rodnyansky, A. G. Oliver, W. C. Boggess, and J. Muldoon,Nat. Commun., 2, 427 (2011). 59. E. Protopopoff and P. Marcus,J. Chim. Phys. Phys.- Chim. Biol., 88, 1423 (1991). 60. E. Protopopoff and P. Marcus, Corrosion Mechanisms in Theory and Practice
(CRC Press, Boca Raton) (2012).
61. P. Marcus and J. Oudar, Comptes Rendus Hebdomadaires Des Seances De L Academie Des Sciences Serie C, 284, 959 (1977).
62. J. Oudar and P. Marcus,Appl. Surf. Sci., 3, 48 (1979).
63. P. Marcus, A. Teissier, and J. Oudar,Corros. Sci., 24, 259 (1984). 64. P. Marcus, I. Olefjord, and J. Oudar,Corros. Sci., 24, 269 (1984).
65. J. Bénard, J. Oudar, N. Barbouth, E. Margot, and Y. Berthier,Surf. Sci., 88, L35 (1979).
66. M. M. Montagono and J. Cabané,Surf. Sci., 285, L468 (1993). 67. P. Marcus and E. Protopopoff,J. Electrochem. Soc., 137, 2709 (1990). 68. E. Protopopoff and P. Marcus,Electrochim. Acta, 63, 22 (2012).
69. G. D. Aloisi, M. Cavallini, M. Innocenti, M. L. Foresti, G. Pezzatini, and R. Guidelli,J. Phys. Chem. B, 101, 4774 (1997).
70. D. Wagman, W. Evans, V. Parker, R. Schumm, I. Halow, S. Bailey, K. Churney, and R. Nuttall,J. Phys. Chem. Ref. Data, 11, 1 (1982).