UNIVERSITÉ DU QUÉBEC À MONTRÉAL
ÉVÉNEMENTS DE PLUIE VERGLACANTE
AYANT IMPACTÉS LE RÉSEAU D’ÉNERGIE NB ET LEURS
ÉVOLUTIONS DANS LE FUTUR
MÉMOIRE
PRÉSENTÉ
COMME EXIGENCE PARTIELLE
DE LA MAÎTRISE EN SCIENCES DE LA TERRE ET DE
L’ATMOSPHÈRE
PAR
JULIEN CHARTRAND
Avertissement
La diffusion de ce mémoire se fait dans le respect des droits de son auteur, qui a signé le formulaire Autorisation de reproduire et de diffuser un travail de recherche de cycles supérieurs (SDU-522 – Rév.10-2015). Cette autorisation stipule que «conformément à l’article 11 du Règlement no 8 des études de cycles supérieurs, [l’auteur] concède à l’Université du Québec à Montréal une licence non exclusive d’utilisation et de publication de la totalité ou d’une partie importante de [son] travail de recherche pour des fins pédagogiques et non commerciales. Plus précisément, [l’auteur] autorise l’Université du Québec à Montréal à reproduire, diffuser, prêter, distribuer ou vendre des copies de [son] travail de recherche à des fins non commerciales sur quelque support que ce soit, y compris l’Internet. Cette licence et cette autorisation n’entraînent pas une renonciation de [la] part [de l’auteur] à [ses] droits moraux ni à [ses] droits de propriété intellectuelle. Sauf entente contraire, [l’auteur] conserve la liberté de diffuser et de commercialiser ou non ce travail dont [il] possède un exemplaire.»
REMERCIEMENTS
Premièrement, je remercie ma directrice de recherche Julie Mireille Thériault pour sa présence, ses suggestions et son aide tout au long du projet de recherche. Je tiens à remercier Global Water Futures/Climate-Related Precipitation Extremes qui a couvert les dépenses liées à ce projet. Je remercie également mes collègues Mathieu Lachapelle et Sébastien Marinier pour leurs suggestions et leur aide sur l’analyse des résultats, ainsi que Katja Winger pour son aide avec l’écriture de programmes, en particulier sur l’algorithme de détection de trajectoires des dépressions.
Finalement, je voudrais remercier Énergie NB Power qui a fourni les informations sur les coupures de courant du réseau électrique au Nouveau-Brunswick, ainsi que le
National Center for Atmospheric Research et le groupe de recherche du professeur
Yanping Li de l’Université de Saskatchewan d’avoir produit et rendu accessible les simulations à haute résolution que j’ai utilisées dans ce projet.
LISTE DES FIGURES ... v
LISTE DES ABRÉVIATIONS, SIGLES, ET ACRONYMES ... viii
RÉSUMÉ ... ix
CHAPITRE 1 ... 1
INTRODUCTION ... 1
CHAPITRE 2 ... 11
FREEZING RAIN EVENTS IMPACTING THE PROVINCE OF NEW BRUNSWICK, CANADA AND THEIR EVOLUTION IN A WARMER CLIMATE ... 11
ABSTRACT ... 13
2.1. Introduction ... 14
2.2. Data and Methodology ... 17
2.2.1. Identification of Winter Storms ... 17
2.2.2. Convection-permitting simulations ... 19
2.2.3. Station Data and Model Validation ... 20
2.2.4. Freezing rain observations and duration of events ... 21
2.2.5. Ice accretion on circular wires ... 21
2.3. Historical climatology of winter precipitation ... 22
2.4. Analysis of historical freezing rain events ... 23
2.4.1. Composite evolution of selected events ... 24
2.4.2. Distribution of precipitation ... 26
2.4.3. Case study of 2 February 2008 event ... 27
2.5. Freezing rain events under a warmer climate ... 29
iv
2.5.2. Projected changes in the occurrence of freezing rain events ... 30
2.6. Implications on NB Power Network ... 32
2.6.1. Ice accretion ... 32
2.6.2. Wet snow ... 33
2.7. Summary and conclusion ... 34
FIGURES ... 38
ANNEXE A ... 51
CHAPITRE 3 ... 56
CONCLUSION ... 56
positions of the low-pressure systems at 3-hour periods in the ERA5 reanalysis dataset. ... 39
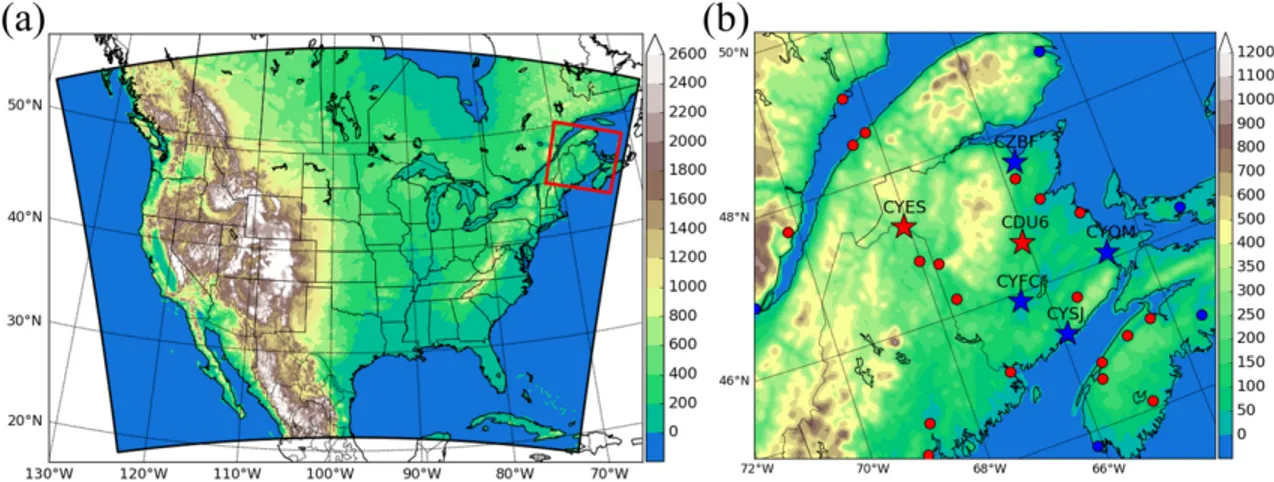
Figure 2.2: (a) WRF model domain (5440 km × 4064 km) at 4 km grid-spacing,
showing topographic elevation in meters. (b) Zoom over domain of interest. Locations of weather stations used to validate WRF-CTL model output are shown. Stations depicted in red have daily data and stations depicted in blue have hourly weather observations as well. Stars are the locations chosen for analysis of future changes of freezing rain event occurrence. ... 40
Figure 2.3: Topography field (m) of (a) the CRCM5 at 0.11° and (b) the CanESM2 at
2.8°. ... 40
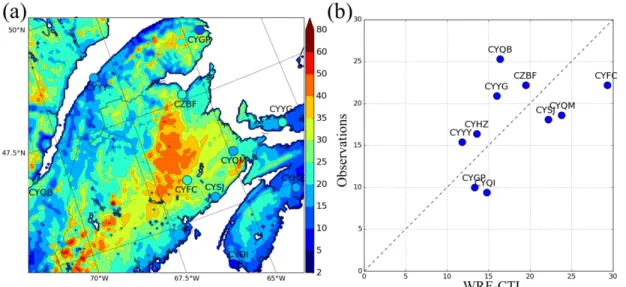
Figure 2.4: (a) Average annual freezing rain occurrences in hours for the period
2000-2013 using WRF-CTL simulation (shaded) and observations (circles). (b) Comparison between observations of average annual freezing rain occurrence at weather stations with the control simulation at the nearest grid point. ... 41
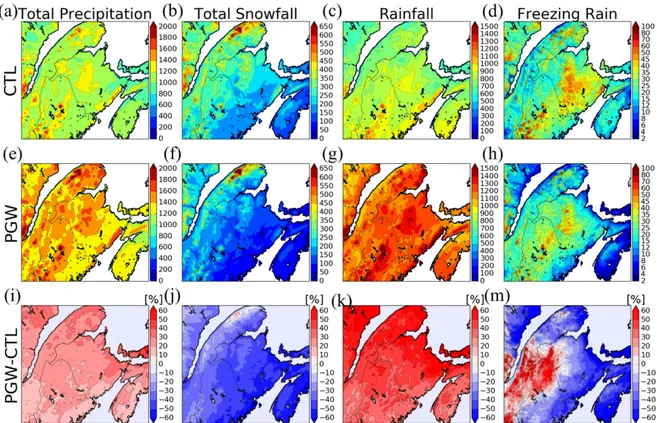
Figure 2.5: Annual average (mm/year in liquid equivalent) of (a,e) total precipitation,
(c,g) rainfall, (b,f) snowfall and (d,h) freezing rain in the 2000-2013 period using WRF-CTL and WRF-PGW simulations. Changes (%) of annual (i) total precipitation, (j) snowfall, (k) rainfall and (m) freezing rain between the two simulations (PGW-CTL). ... 42
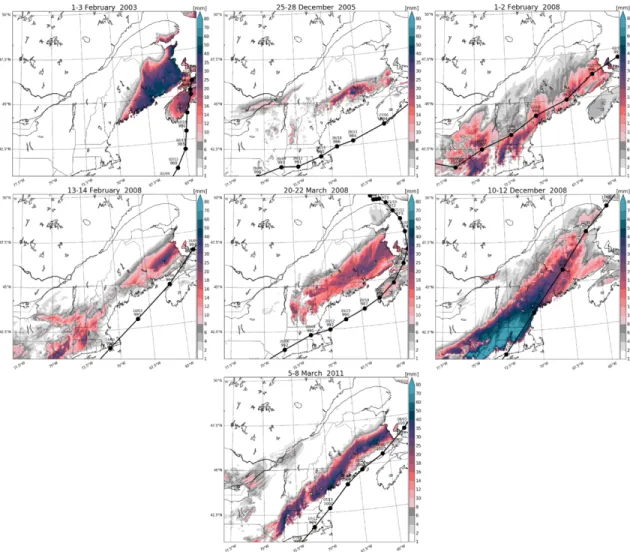
Figure 2.6: Freezing rain amounts associated with the 7 identified storm tracks. Black
dots represent the position of the low-pressure centers at 3-h intervals. The sea level pressure minimum is shown, as well as the date at each time interval (day/time). .... 43
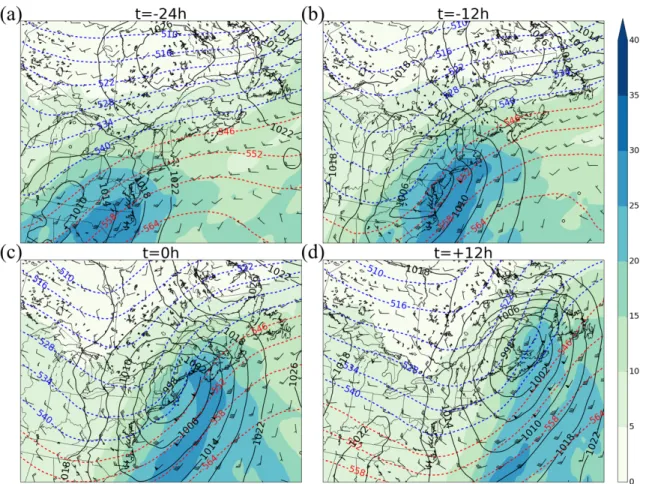
Figure 2.7: Composite of the ERA5 reanalysis 500-1000 hPa thickness (dam, dashed),
total precipitable water (mm, shaded), sea level pressure (hPa, contours) and 850-hPa wind (barbs) fields corresponding to 7 freezing rain events in New Brunswick at (a) t=-24 h, (b) t=-12 h, (c) t=0 h, (d) and t=+12 h. ... 44
vi
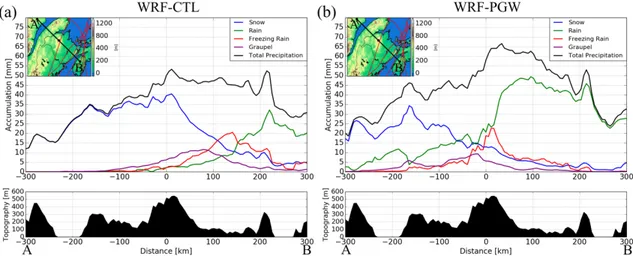
Figure 2.8: Cross section of the average precipitation accumulation corresponding to
7 freezing rain events in NB using the WRF (a) CTL and (b) PGW simulations. To capture the most significant orographic effects, the cross-section was centered on Mount Carleton, NB’s highest point (0km). At -200 km, the cross-section crosses the Saint-Lawrence River. At 200 km, it crosses the Caledonian highlands. At 250 km, it crosses the Bay of Fundy. ... 45
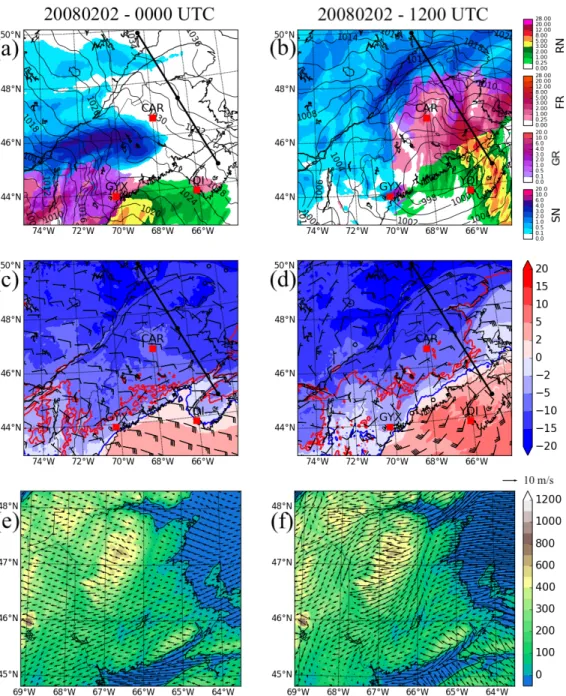
Figure 2.9: WRF-CTL Sea level pressure (hPa, contours), precipitation type and rate
(mm/h, shading) valid at (a) 0000 UTC and (b) 1200 UTC on 2 February 2008. 2-m temperature (°C, shading) and 10-m wind (barbs) at (c) 0000 UTC and (d) 1200 UTC. The blue and red contours in (c), (d) represent the 0°C isotherm in the CTL and PGW simulations, respectively. Terrain (m, shading) and 10-m wind (arrows) at (e) 0000 UTC and (f) 1200 UTC. The black line and the A and B marks represent the cross-section presented in figure 2.11. ... 46
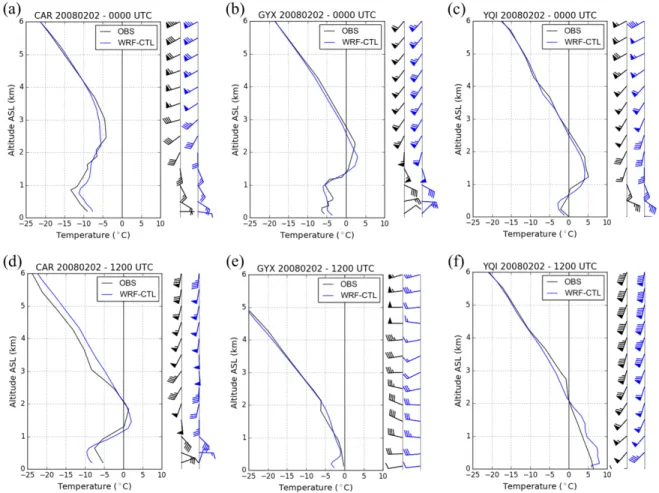
Figure 2.10: Caribou, Maine sounding observed (black) and simulated (blue) by the
WRF-CTL simulation valid at (a) 0000 UTC and (d) 1200 UTC on 2 February 2008. (b), (e) as in (a), (d), but for Gray, Maine. (c), (f) as in (a), (d), but for Yarmouth, Nova Scotia. The nearest grid points were used for the simulated profile. The location of the upper air sounding stations are shown in Fig. 2.9 by red squares. ... 47
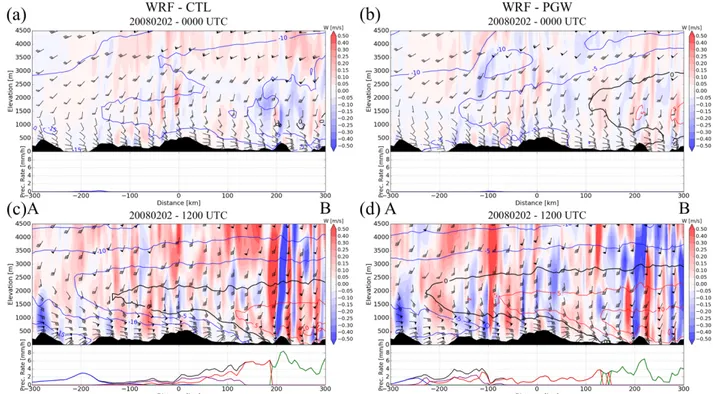
Figure 2.11: Vertical cross-section of the vertical motion (m/s, shading), temperature
(°C, shading), horizontal wind (barbs) and precipitation type and rate (mm/h) valid at (a) 0000 UTC and (c) 1200 UTC on 2 February 2008 using WRF-CTL. (b), (d) as in (a), (c), but for WRF-PGW. The precipitation types correspond to snow (blue), graupel (purple), freezing rain (red), rain (green) and total precipitation (black). The cross-section is defined in figure 2.9. ... 48
Figure 2.12: Difference in freezing rain event occurrence between observations
(black), WRF-CTL (blue) and WRF-PGW (red) simulations for the 2000-2013 period. ... 49
Figure 2.13: Annual average (mm) of (a) radial ice accretion on circular wires and (b)
wet snow in the WRF-CTL simulation for the period 2000-2013. (c), (d) as in (a), (b) for the WRF-PGW simulation. Difference (%) of (e) annual radial ice accretion and (f) annual wet snow between PGW and CTL. Wet snow is defined here as snowfall with
a temperature > -2 °C. NB Power transmission network is represented in black lines. ... 50
LISTE DES ABRÉVIATIONS, SIGLES, ET ACRONYMES
CAD Cold Air Damming CTL Control
UTC Coordinated Universal Time
ECMWF European Center for Medium-Range Weather Forecasts ERA5 ECMWF Reanalysis version 5
FR Freezing Rain
GCM General Circulation Model GR Graupel
NCAR National Center for Atmospheric Research NB Nouveau-Brunswick
RN Rain
RCP Representative Concentration Pathway PGW Pseudo Global Warming
SLRV Saint Lawrence River Valley SLP Sea Level Pressure
SN Snow
accompagnées de précipitations abondantes et de vents forts. Plusieurs de ces tempêtes peuvent entraîner une accumulation importante de pluie verglaçante dans la province du Nouveau-Brunswick (N.-B.), Canada, causant des impacts importants sur de nombreux secteurs de la société. En collaboration avec Énergie N.-B., des événements de pluie verglaçante qui ont entraîné des pannes de courant majeures et des dommages aux infrastructures ont été identifiés. Pour analyser ces événements et mieux comprendre les liens entre les conditions météorologiques et les pannes de courant, des simulations à haute résolution autorisant la convection avec un maillage de 4 km sur le continent américain (Liu et al., 2017) ont été utilisées. Celles-ci ont été produites de 2000 à 2013 ainsi qu’en mode pseudo-global warming (PGW) qui suppose un climat plus chaud. Les effets locaux influençant l’intensité et la distribution des précipitations pendant les tempêtes ont été étudiés. Les résultats ont démontré que la présence des Appalaches au N.-B. produit de l’advection différentielle de température par le processus de blocage d’air froid, ce qui favorise le développement d’une forte inversion de température dans les niveaux inférieurs. Cela entraîne une augmentation de la quantité de pluie verglaçante dans le sud du N.-B. De plus, la présence de chaînes de montagnes de basse altitude dans le centre du N.-B. et sur la côte sud peut augmenter le taux de précipitation par effet orographique et produire un changement local du type de précipitations à la surface. Dans PGW, il y a une diminution de la fréquence des événements de pluie verglaçante dans le sud et l’est du N.-B. (régions côtières), tandis qu’au nord-ouest du N.-B. on voit plutôt une augmentation, surtout pour les événements de longue durée (> 6 heures). Dans l’ensemble, cette étude contribue à une meilleure compréhension des facteurs météorologiques à l’origine des quantités extrêmes de pluie verglaçante au N.-B. et contribue à mieux anticiper l’impact du changement climatique sur ces tempêtes.
CHAPITRE 1
INTRODUCTION
Les hivers dans l’Est du Canada sont caractérisés de nombreuses tempêtes hivernales apportant des vents forts ainsi que des précipitations abondantes. Typiquement, celles-ci sont assocelles-ciées au passage de cyclones extratropicaux (ou dépressions aux latitudes moyennes). Chaque hiver, plusieurs de ces événements météorologiques affectent la province du Nouveau-Brunswick (N.-B.), produisant de nombreuses coupures de courant. La cause de ces coupures de courant varie en fonction des types de précipitation associés aux tempêtes. Les vents violents font tomber des arbres sur les lignes de distribution électriques et causent des inondations côtières par l’onde de tempête. La pluie forte est à l’origine de crues des rivières, surtout lorsqu’elle tombe sur un manteau neigeux au printemps. La pluie verglaçante et la neige mouillée mènent à un chargement important sur les structures. Particulièrement, le vent fort combiné à un chargement de neige mouillée et/ou de pluie verglaçante a un effet dévastateur sur le réseau de distribution électrique. Par exemple, la récente tempête hivernale de janvier 2017 dans les provinces Maritimes a mené à plus de 130 000 domiciles privés d’électricité au N.-B. (Énergie NB Power, 2017) suite à une accumulation de pluie verglaçante de plus de 50 mm dans l’Est du N.-B. sur une période de trois jours (McFadden, 2019). Dans la région reculée de la Péninsule Acadienne, certains foyers ont été privés de courant pour une durée de deux semaines suite à l’événement. Sachant à quel point ces événements sont dommageables pour la société, il est important de comprendre les facteurs météorologiques menant à des accumulations importantes de pluie verglaçante.
La plupart des cyclones qui affectent les provinces Maritimes du Canada sont des tempêtes côtières, couramment appelés Nor’easters (Stewart et al., 1995; Frankowski and DeGaetano, 2011). Ces dépressions se forment couramment durant la saison froide au large de la côte Est Nord-Américaine à cause du fort gradient thermique entre l’air chaud au-dessus de l’Atlantique et l’air froid continental (Miller, 1946; Hirsch et al., 2001). Dans certains cas, la forte baroclinicité mène au développement de bombes météorologiques (diminution de pression de plus de 24-hPa/jour), phénomène qui ne survient qu’à quelques endroits sur la planète (Sanders and Gyakum, 1980; Roebber, 1984). Après leur formation, ces tempêtes suivent une trajectoire vers le nord-est, suivant à peu près la côte Nord-Américaine (Hirsch et al., 2001; Bradbury et al., 2003). Elles atteignent souvent les provinces Maritimes en tant que cyclones en stade mature ou en stade de dissipation. Sur leurs trajectoires, elles apportent des précipitations abondantes et des vents forts et sont responsables de la plupart des chutes de neige extrêmes sur la côte est des États-Unis (Kocin and Uccellini, 2004). De plus, il a été montré que les tempêtes côtières sont responsables de plus de 50% des précipitations sous forme de neige annuellement en Nouvelle-Angleterre et dans la région des états
Mid-Atlantic (Frankowski and DeGaetano, 2011).
Certains des cyclones extratropicaux formés en aval des Montagnes Rocheuses dans l’ouest de l’Amérique du Nord par conservation du moment angulaire (lee
cyclogenesis) (ex : Dépressions du Colorado et Clippers de l’Alberta) affectent les
provinces Maritimes après avoir traversé l’Amérique du Nord (Stewart et al., 1995). En s’approchant de l’Océan Atlantique, ces cyclones tendent à se renforcir grâce à la plus forte baroclinicité et l’apport additionnel en vapeur d’eau, affectant potentiellement davantage les provinces Maritimes que les régions traversées précédemment sur leur trajectoire (Kocin and Uccellini, 2004). On observe aussi fréquemment des redéveloppements des cyclones provenant de l’ouest lorsque ceux-ci atteignent la région des Appalaches; ceux-ci forment des centres dépressionnaires secondaires près de la côte Est qui rapidement deviennent plus importants que les
3
dépressions originales, redéveloppant les cyclones en tant que Nor’easter (Miller, 1946; Nielsen and Dole, 1992; O’Handley and Bosart, 1996). Dans la plupart des cas, la proximité du N.-B. avec l’Océan Atlantique fait en sorte que cette région est plus fortement affectée par des précipitations intenses et des vents forts lors de tempêtes hivernales.
Le type de précipitation lors des tempêtes hivernales a un impact crucial sur les répercussions associées à ces événements. En plus d’une région recevant de la neige et d’une région recevant de la pluie, une région de transition est normalement présente lors des tempêtes hivernales dans les Maritimes (Stewart, 1992). Dépendamment du profil vertical de température dans la région de transition, cette transition peut être caractérisée par un mélange de neige mouillée et de pluie, ou bien peut contenir de la pluie verglaçante et du grésil. La largeur de ces régions de transition est normalement comprise entre 10 km et 100 km et est généralement associée à un front chaud, à proximité du centre dépressionnaire (Stewart, 1992; Stewart et al., 1995). La position relative au centre dépressionnaire est alors hautement reliée au type de précipitation. Lors de l’approche d’un front chaud, une inversion de température se développe (inversion frontale). La forte advection d’air chaud en altitude mène éventuellement à la production d’une couche de fonte en altitude (température > 0°C), alors qu’une couche de regel (température < 0°C) est présente près de la surface. Lorsque les flocons de neige formés à une altitude plus élevée entrent dans la couche de fonte, une fonte graduelle se produit. Quand les particules sont partiellement fondues lorsqu’elles pénètrent dans la couche de regel, la fraction solide restant dans les particules va agir en tant que noyau glaçogène et initier le regel des particules. Ceci est le principal mécanisme de formation du grésil (Zerr, 1997). Au contraire, si les particules fondent complètement, elles deviennent des gouttelettes surfondues en entrant dans la couche de regel. Sans l’aide de particule solide ou d’un noyau glaçogène actif pour initier le gel, cela mène généralement à de la pluie verglaçante à la surface, les gouttelettes gelant
uniquement au contact avec les surfaces (Huffman and Norman, 1988; Zerr, 1997). Étant donné le besoin de conserver une fraction solide dans les particules pour produire du grésil, la couche de fonte est généralement plus mince et/ou plus près de 0°C lors d’un événement de grésil par rapport à un événement de pluie verglaçante (Thériault et al., 2006). La neige mouillée regelée est produite de la même manière que le grésil, cependant la fonte des particules est moins étendue, alors la forme des cristaux demeure visible suite à la fonte partielle et au regel (Thériault et al., 2010). Étant donné la large distribution de taille des particules entrant dans la couche de fonte, il est assez commun d’observer un mélange de pluie verglaçante et de grésil à la surface.
La pluie verglaçante peut également se produire suite au processus de collision-coalescence dans un nuage chaud (warm rain process), même lorsque la température de toute la colonne d’air est sous 0°C (Rauber et al., 2000). Sous certaines conditions, des précipitations faibles sous forme de bruine verglaçante se produisent par ce processus par le manque d’une abondance d’aérosols pouvant agir comme noyau glaçogène à des températures au-dessus de -10/-15°C et l’absence de nombreux cristaux de glace existant déjà dans les nuages (Huffman and Norman, 1988).
Sachant les processus menant aux différents types de précipitation associés aux tempêtes hivernales, l’évolution du type de précipitation peut généralement être prédite en fonction du déplacement des dépressions (Stewart and King, 1987). Au nord du cœur chaud de la dépression en altitude (une région de température potentielle plus élevée), seulement de la neige peut être prévue. Dans les régions où il y a passage d’un front chaud, généralement à l’est de la trajectoire des dépressions, une évolution de la neige vers le grésil, la pluie verglaçante et finalement la pluie peut être envisagée. La couche de fonte devenant graduellement plus épaisse est à l’origine de cette transition en 4 types. Dû à l’intrusion d’air sec, on peut s’attendre à une baisse du taux de précipitation entre les fronts chauds et froids. Finalement, des averses de pluie ou de neige suivent généralement le passage d’un front froid.
5
En plus d’être déterminante pour le type précipitation, la position relative au centre dépressionnaire peut également avoir un effet sur l’intensité des précipitations par la structure en bandes de précipitations à méso-échelle souvent observée lors des tempêtes côtières dans les Maritimes (Donaldson and Stewart, 1989; Stewart, 1991). Plusieurs études ont traité des bandes associées aux tempêtes hivernales dans le Nord-Est des États-Unis et ont montré que ces bandes se retrouvent plus souvent au Nord-Ouest des centres dépressionnaires (Nicosia and Grumm, 1999; Novak et al., 2004; Moore et al., 2005; Novak et al., 2010; Baxter and Schumacher, 2017). Leur formation est liée à une région de frontogenèse positive combinée à une faible stabilité statique (Emanuel, 1985; Sanders and Bosart, 1985; Sanders, 1986), produisant un mouvement vertical ascendant concentré à un endroit et formant des précipitations plus intenses en bandes. Dans une étude climatologique sur les bandes de précipitation associées aux tempêtes dans le Nord-est des États-Unis (Ganetis et al., 2018), il a été montré qu’une large bande unique est plus souvent associée aux cyclones en développement, tandis qu’une structure multibande est souvent associée aux cyclones matures et que des cyclones en phase de dissipation mènent à la dissipation des bandes. L’orientation des bandes de précipitation est généralement la même que l’orientation du vent thermique dans la couche ou la frontogenèse est maximale (Sanders and Bosart, 1985; Schultz and Schumacher, 1999). Finalement, les plus grandes accumulations de précipitation lors des tempêtes dans les Maritimes sont plus souvent observées légèrement à l’ouest des trajectoires des dépressions, étant donné que ces régions subissent les effets des bandes de précipitation pour la plus longue durée (Donaldson and Stewart, 1989).
La topographie et les caractéristiques de la surface ont également une influence sur le type et l’intensité des précipitations durant les tempêtes hivernales dans les Maritimes. La présence d’une région côtière peut imposer une zone de transition neige/pluie étant donné la température de surface océanique relativement chaude (Stewart et al., 1990). Dans les régions montagneuses, le type de précipitation peut être affecté par le mouvement vertical causé par le flux d’air au-dessus de la topographie. Un mouvement
ascendant (descendant) mène à un refroidissement (réchauffement) adiabatique, ce qui peut être le facteur déterminant entre la pluie et la neige lorsque la température est près de 0°C, ce qui est souvent le cas lors des tempêtes dans les Provinces Maritimes (Stewart et al., 1995). Dans la région voisine, la Nouvelle-Angleterre, la combinaison de ces deux facteurs fait en sorte que la quantité moyenne annuelle de neige apportée par les Nor’easters est maximale dans les montagnes du Vermont et du New Hampshire, alors que la quantité maximale de précipitation est observée dans les régions côtières (Frankowski and DeGaetano, 2011).
La présence de vallées et de barrières orographiques dans l’Est de l’Amérique du Nord peut renforcer les inversions de températures lors des tempêtes hivernales par les processus de canalisation du vent (wind channeling) et de blocage d’air froid (cold air
damming, CAD). Ces processus mènent à des conditions atmosphériques favorisant la
pluie verglaçante et le grésil en amplifiant les inversions de températures. La tempête de pluie verglaçante de janvier 1998 dans l’Est du Canada est un exemple d’un événement extrême qui a été fortement influencé par la canalisation du vent dans la Vallée du Saint-Laurent (Roebber and Gyakum, 2003; Henson et al., 2011). En climatologie, ce phénomène explique le maximum local dans le nombre d’heures médian annuel de précipitations verglaçantes de plus de 50 heures dans le Sud du Québec (Cortinas et al., 2004; Stuart and Isaac, 1999). En ce qui concerne de blocage d’air froid, il a été montré que ce phénomène est la cause de la plupart des longs événements de pluie verglaçante et de grésil dans les plaines côtières du Middle-Atlantic et de la Nouvelle-Angleterre (Forbes et al., 1987; Bernstein, 2000). Stuart et Isaac (1999) ont montré que certaines régions des provinces Maritimes, incluant l’est du N.-B., reçoivent plus de 50 heures de précipitations verglaçantes annuellement. Ils mentionnent que les effets locaux, tel que la topographie et la proximité de l’océan, jouent un rôle sur la présence de maximums locaux dans l’occurrence des précipitations verglaçantes, tel qu’à St. John’s, Terre-Neuve.
7
La fonte des particules en altitude a aussi un impact sur la structure à méso-échelle des tempêtes hivernales. La fonte de ces dernières dans une couche chaude en altitude est responsable de la production d’épaisses couches isothermes à 0°C, par le transfert de chaleur latente de fusion de l’environnement vers les particules (Stewart and Patenaude, 1988; Stewart and Macpherson, 1989). À proximité d’une région de transition solide/liquide, la fonte dans le secteur chaud de la région de transition favorise la formation d’une circulation indirecte à méso-échelle (Szeto et al., 1988; Stewart, 1986). Connu sous le nom de melting-induced circulation, cette circulation secondaire est caractérisée par un mouvement descendant dans le secteur chaud (pluie), et un mouvement ascendant dans le secteur froid (neige) de la région de transition, augmentant le taux de précipitation du côté froid de la région de transition. Même si ce phénomène n’est pas clairement observé en pratique, l’observation des taux de précipitation durant les tempêtes hivernales dans les Maritimes est généralement en accord avec ce concept, avec les plus forts taux de précipitation observés du côté froid de la zone de transition dans la plupart des cas (Stewart and Patenaude, 1988).
Un autre effet local qui peut avoir un effet sur les tempêtes hivernales est l’interaction entre les vents près de la surface et l’interface océan/continent. Bergeron (1949) a montré que le changement de rugosité de la surface entre l’océan et la terre produit de la convergence près de la surface lorsque la direction du vent est vers la terre (onshore
wind), induisant un mouvement vertical, soutenant ou augmentant le taux de
précipitation dans les régions côtières. Ce concept, aussi connu sous le nom de
frictional convergence, combiné au gradient de température imposé entre l’océan et le
continent dans le Nord-Est des États-Unis, a été étudié à maintes reprises étant donné son impact sur la distribution des précipitations hivernales. Une augmentation des taux de précipitation a été observée dans les régions côtières lors de plusieurs tempêtes en Nouvelle-Angleterre (Bosart et al., 1972; Bosart et al., 1975; Nielsen and Neilley, 1990). Le mécanisme microphysique de l’augmentation du taux de précipitation lié à ce phénomène est l’accrétion de gouttelettes d’eau surfondues de nuages stratiformes
bas par les cristaux provenant de plus haut dans l’atmosphère (seeder-feeder), ce qui augmente la masse des particules chutant à travers les nuages produits par convergence près de la surface (Marks and Austin, 1979). L’augmentation côtière des précipitations a aussi été observée à d’autres endroits sur la côte est Nord-Américaine : en Nouvelle-Écosse (Stewart et al., 1990) et sur Long Island dans l’état de New York (Colle and Yuter, 2007).
Dans un contexte de changements climatiques futurs, quelques études se sont intéressées aux changements dans la distribution et l’occurrence de la pluie verglaçante dans l’est de l’Amérique du Nord (Lambert and Hansen, 2011; Cheng et al., 2011; Klima and Morgan, 2015; Matte et al., 2018; Jeong et al., 2018). En utilisant le modèle climatique couplé canadien de troisième génération (CGCM3), Lambert et Hansen (2011) ont montré qu’un climat futur plus chaud apporterait un déplacement vers le nord des régions les plus propices à la pluie verglaçante. Pour les Maritimes, ceci entraînerait une diminution de la quantité. Cependant, ils mentionnent que la faible résolution utilisée dans leur simulation climatique (2.8°) n’est pas suffisante pour capter les effets locaux qui influencent la distribution de pluie verglaçante. En utilisant une méthode de diminution d’échelle statistique à partir de simulations de modèles de circulation générale (GCM), Cheng et al. (2011) a montré au contraire qu’une légère augmentation des précipitations verglaçantes pourrait survenir dans les Maritimes. Même si le N.-B. n’était pas dans leur domaine d’étude (Est des États-Unis, Ontario et Québec), Klima et Morgan (2015) ont utilisé des perturbations sur les profils de température historiques observés pour étudier comment l’occurrence de profil de température menant à de la pluie verglaçante va évoluer sous un climat plus chaud. Ils ont également montré un déplacement vers le nord de la distribution de pluie verglaçante, menant à une augmentation durant la saison hivernale (DJF) au Québec et Nouvelle-Angleterre et une diminution durant les saisons de transition dans ces régions. Matte et al. (2018) ont récemment étudié les changements prévus dans la climatologie des précipitations mixtes (pluie verglaçante et grésil) au Québec et en
9
Nouvelle Angleterre en utilisant une simulation climatique régionale (CRCM5) sur une grille à 0.11° de résolution et ont aussi trouvé une diminution générale de la quantité de précipitations mixtes sous un climat plus chaud. Finalement, une autre étude récente (Jeong et al., 2018) a montré des résultats similaires en utilisant le CRCM5 sur plusieurs régions du Canada, présentant une diminution de l’occurrence des événements de pluie verglaçante au N.-B. ainsi qu’une forte diminution de la quantité moyenne annuelle pour la période 2071-2100 sous le scénario RCP8.5. Ces résultats variés montrent que les changements prévus de pluie verglaçante au N.-B. sont variables selon les différentes méthodes utilisées et démontrent le besoin d’études supplémentaires sur le sujet.
L’objectif principal de ce mémoire est de mieux comprendre l’évolution des tempêtes hivernales passées qui ont impactées le réseau de transport et de distribution d’Énergie N.-B., afin de mieux anticiper leurs évolutions dans le climat futur. Cette étude sera menée en trois parties. Premièrement, nous déterminerons les patrons synoptiques associés aux tempêtes historiques de pluie verglaçante ayant causé des dommages aux installations d’Énergie N.-B. Ensuite, les effets locaux impactant l’occurrence de la pluie verglaçante lors des tempêtes hivernales seront analysés, en particulier l’influence du terrain sur la distribution de la pluie verglaçante. Finalement, l’effet du changement climatique sur les précipitations hivernales au N.-B. sera étudié en simulant le climat de 2071-2100 selon le scénario RCP8.5.
Plusieurs tempêtes hivernales qui ont provoqué des pannes de courant généralisées entre 2003 et 2013 ont été analysées. Certaines études récentes (Cholette et al., 2015; Marinier et al., 2020) ont montré que la canalisation du vent dans la vallée du Saint-Laurent est bien représentée par des modèles avec une résolution horizontale de ≤ 9 km. Pour bien reproduire les effets locaux, nous avons alors utilisé une simulation historique (2000-2013) du modèle Weather Reasearch and Forecasting (WRF) piloté par ERA-Interim sur une grille haute résolution permettant la convection (4 km) (Liu
et al., 2016). Pour simuler un climat plus chaud, nous avons utilisé la simulation suivant l’approche Pseudo Global Warming de Liu et al. (2017) qui utilise le modèle WRF sur la même période et grille que la simulation historique. Il est important de noter que l’évolution du patron synoptique avec les changements climatiques n’est pas étudiée, mais bien la réponse thermodynamique du changement climatique sur les tempêtes de pluie verglaçante et de neige.
CHAPITRE 2
FREEZING RAIN EVENTS IMPACTING THE PROVINCE OF NEW
BRUNSWICK, CANADA AND THEIR EVOLUTION IN A WARMER
CLIMATE
Ce chapitre, présenté sous forme d’un article scientifique rédigé en anglais, sera soumis au Journal of Geophysical Research : Atmospheres. L’article porte sur l’étude d’événements de pluie verglaçante extrêmes ayant impacté le N.-B. entre 2003 et 2013, plus particulièrement sur les phénomènes à méso-échelle influençant la distribution de pluie verglaçante durant ces événements. L’article porte également sur l’évolution de la pluie verglaçante au N.-B. dans un contexte de changement climatique en simulant le climat de 2071-2100 sous le scénario d’émission RCP8.5.
Freezing rain events impacting the Province of New Brunswick,
Canada and their evolution in a warmer climate
Julien Chartrand and Julie M. Thériault
Centre ESCER, Department of Earth and Atmospheric Sciences, Université du Québec à Montréal
13
ABSTRACT
Winter storms affecting the Maritime Provinces can bring heavy precipitation and strong winds. Several of these storms can result in severe freezing rain accumulation in the province of New Brunswick (NB), Canada, causing significant impacts on many sectors of society. In collaboration with NB Power, freezing rain events that led to widespread power outages and damages to infrastructure have been identified. To analyze these events, high-resolution convection-permitting simulations at 4 km grid spacing over the contiguous US and southern Canada (Liu et al., 2017) were used. These were produced from 2000-2013 as well as, in pseudo global warming (PGW) configuration in which a warmer climate is assumed following the RCP8.5 scenario. The local effects influencing the intensity and types of precipitation distribution during the storms were investigated. The Appalachian Mountains in NB enhance the differential temperature advection associated with veering winds through the process of cold air damming, which favors the development of strong temperature inversion in the lower-levels. This leads to an increase in the amounts of freezing rain in central and southern NB. In PGW, there is a major decrease of freezing rain event occurrence (-40%) in southern and eastern NB (coastal regions), while it increases slightly in northwestern NB, especially for long events (>6 hours). Overall, this study contributes to a better understanding of meteorological factors leading to extreme amounts of freezing rain in NB and to better anticipate the impact of climate change on those storms.
2.1. Introduction
Eastern Canada winters are characterized by the frequent occurrence of winter storms. Typically, they are associated with the passage of extratropical cyclones, bringing heavy precipitation along with strong winds. Most of these high-impact meteorological events bring mixed precipitation to the province of New Brunswick (NB) (Stewart, 1992). Freezing rain events are particularly damaging, as they result in heavy loading on structures, ultimately causing transmission lines to fall, even with relatively light precipitation amount (e.g. McKay and Thompson, 1969; Klaassen et al., 2003; Farzaneh, 2008). The recent January 2017 ice storm in Atlantic Canada resulted in more than 130 000 homes without power in NB (NB Power, 2017) after up to 50 mm of freezing rain fell in Eastern NB over the course of three days (McFadden, 2019). Households in the Acadian Peninsula were without power for up to two weeks after the event occurred. Knowing how much impact ice storms can have on society, it is important to understand the factors that lead to heavy ice accumulation during winter storms.
In Atlantic Canada, freezing rain and ice pellets are typically associated with the development of a temperature inversion ahead of a warm front (frontal inversion). Veering winds can produce a melting layer aloft (temperatures > 0°C) due to warm air advection, while there remains a subfreezing layer near the surface (temperatures < 0°C). When snowflakes fall in the warm layer, snow gradually melts. As the partially melted particles fall into the subfreezing layer, the remaining ice in the mixed phase particles initiate freezing, leading to the formation of ice pellets (Stewart et al., 2015). If the particles melt completely through the warm layer, they will enter the subfreezing layer as rain. Without activated ice nuclei, supercooled drops will not freeze while falling but only upon contact with the surface, producing freezing rain (Huffman and Norman, 1988; Zerr, 1997; Stewart et al., 2015). The melting layer is usually shallower and/or colder during an ice pellet event compared to a freezing rain event to allow
15
mixed phase particles to reach the top of the refreezing layer (Thériault et al., 2006; Zerr, 1997).
The precipitation transition region where freezing precipitation is found is also linked to the position of the low-pressure center, with a typical width of 10 km to 100 km (Stewart, 1992; Kocin and Uccellini, 2004). Precipitation type transitions can usually be expected depending on the storm track. Precipitation types typically evolve from snow, ice pellets, freezing rain to rain (Stewart and King, 1987) during the passage of a warm front, which deepens and warms the melting layer aloft.
Complex terrain, however, can reinforce temperature inversions during winter storms through the processe of wind channeling, and through the process of cold air damming (CAD) (e.g. Roebber and Gyakum, 2003; Henson et al., 2011; Forbes et al., 1987; Bernstein, 2000). Both of these processes favor the development or maintenance of atmospheric conditions that lead to extended periods of freezing rain and ice pellets by enhancing temperature inversions at lower levels. Wind channeling is responsible for a local maximum in the median number of hours of freezing precipitation (Freezing rain, drizzle and ice pellets) of more than 50 hours annually in Southern Quebec (Cortinas et al. 2004; Stuart and Isaac, 1999). For example, the January 1998 ice storm in eastern Canada and northeastern US was an extreme freezing rain event that was greatly influenced by channeling of low-level winds in the Saint Lawrence River Valley (SLRV, Roebber and Gyakum, 2003; Henson et al. 2011). Similarly, CAD is associated with most prolonged freezing rain and ice pellet events in New England as well as in the Mid-Atlantic region of the United States (Richwien, 1977; Forbes et al., 1987; Bernstein, 2000). Finally, eastern NB is also a local maximum region in yearly median hours of freezing precipitation, with more than 50 hours annually (Stuart and Isaac, 1999). Stuart and Isaac (1999) suggested that a very high occurrence of freezing precipitation locally in parts of Atlantic Canada is due to a combination of topographical features in the area, the proximity of the Atlantic Ocean, and the frequent
occurrence of cyclones. While others studied the climatology of freezing rain occurrence (e.g. Cortinas et al., 2004; Stuart and Isaac, 1999), McCray et al. (2019) also investigated separately the occurrence of long duration (> 6 h) freezing rain events, as heavy freezing rain accumulations are generally associated with long events (e.g. Ressler, 2012). They showed that stations in NB record ~1-1.5 long duration freezing rain events per year.
Only a few studies have investigated the effect of climate change on freezing rain events in eastern North America (Lambert and Hansen, 2011; Cheng et al., 2011; Klima and Morgan, 2015; Matte et al., 2018; Jeong et al., 2018). Most of them found a northward shift in the climatological distribution of freezing precipitation at the end of the 21st century. For Atlantic Canada, that northward shift translates in a decrease of annual freezing rain amount. However, the coarse resolutions of General Circulation Models (GCMs) used in some of these studies cannot resolve the local features that are conducive to freezing rain (Cholette et al., 2015). In contrast, results of Cheng et al. (2011) instead project a slight increase in freezing rain occurrence in the future in Atlantic Canada. The contrasting results of these previous studies suggests that there is still a large uncertainty in the expected changes in NB depending on the analysis method followed, highlighting the need for further studies on this topic.
As electrical utilities across Canada explore climate change opportunities, risks and adaptation, a better insight on how the frequency and distribution of freezing rain events may evolve under a warming climate is needed. Given this, the main objective of this study is to provide a better understanding of the processes leading to extreme freezing rain events during past events to better anticipate their evolution in a future climate. This study is divided into three parts. First, we investigate the synoptic patterns conducive to high freezing rain accumulation. Several winter storms that caused widespread power outages between 2003 and 2013 are analyzed. Secondly, the local effects on the distribution of freezing rain during these events are investigated with a
17
particular focus on the interaction of the low-level wind field with topography. As Marinier et al. (2020) showed that wind-channelling in the SLRV leading to freezing rain was well reproduced by the historical (2000-2013) simulation of the Weather Reasearch and Forecasting (WRF) model driven by ECMWF reanalysis (ERA-Interim) on a high-resolution (4-km) convection permitting grid (Liu et al., 2017), we used that simulation to investigate the local effects in NB. Finally, the evolution of freezing rain events with climate change is investigated using the Pseudo-Global Warming (PGW) method (Liu et al., 2017), which is based on a climate perturbation simulating the period 2071-2100 under the Representative Concentration Pathway 8.5 (RCP8.5). This paper is organized as follows. Data and methodology are described and discussed in section 2.2. Section 2.3 presents the climatology of winter precipitation in NB. Section 2.4 elaborates on the synoptic evolution of extreme freezing rain events impacting NB and the local effects caused by the presence of the Appalachians. The effects of climate change on freezing rain events in NB are examined in section 2.5 and their implications on power utilities are presented in section 2.6. The main findings are summarized in section 2.7, along with the conclusion.
2.2. Data and Methodology
2.2.1. Identification of Winter Storms
A list of events between 2003 and 2013 associated with widespread power outages in NB was first established by NB Power. This list consisted of 81 time periods within the cold season (October-May), with each case spanning from one to several days, depending on the duration of the power outages. Of these 81 cases, 76 were linked to the impacts of individual low-pressure systems that propagated through Eastern Canada or just offshore of Nova Scotia. Low-pressure systems associated with the most
precipitation and/or winds within the time period of NB power outages were identified as winter storms. Other cases were associated with convective localized precipitation and were not considered in this study.
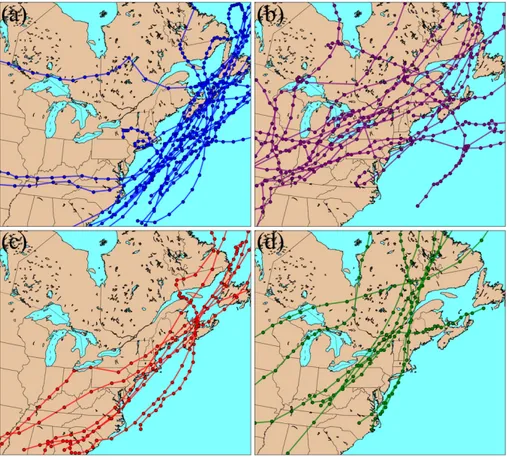
A cyclone tracking scheme has been applied on the ERA5 reanalysis (Hersbach et al., 2019) dataset to depict the storm tracks of every identified winter storms. The storm tracking method that we used is detailed in Chartrand and Pausata (2020). We chose to use the ERA5 data here instead of the WRF data because the global coverage allowed us to depict the complete storms tracks, whereas the coverage of the WRF simulation only covers a limited part of the western Atlantic Ocean, where many of the winter storms in our study originated. The metric used to track cyclones in the algorithm is the sea-level pressure, with the local minimum of the sea-level pressure (SLP) field being used to define a cyclone position. Figure 2.1 depicts the tracks of cyclones associated with NB Power outages grouped into four categories based on the precipitation types in NB. Snow events were associated with only snowfall over all NB surface weather stations (see Sect. 2.2.3). Rain events were only associated with liquid precipitation. Mixed events were associated with various types of precipitation (including freezing rain). Finally, freezing rain events are mixed events that produced more than 12.5 mm of precipitation in the form of freezing rain in NB based on the historical WRF simulation (see Sect. 2.2.2). The 12.5 mm threshold was chosen as it is the point where major damage to structures emerges (e.g. Klaassen et al., 2003). Thus, it identifies only the extreme freezing rain cases, which are further analyzed in section 2.4. Only the storms that occurred during the November to March period are considered, as events that occurred in October, April and May tend to be only rain or mixed events, regardless of their tracks. The influence of storm tracking on precipitation type during winter storms in NB is briefly discussed in section 2.4.
19
2.2.2. Convection-permitting simulations
To study local and mesoscale features within individual events, we used the Weather Research and Forecasting (WRF) model version 3.4.1 in a convection-permitting 4 km grid, as in Liu et al. (2017). The control (historical, CTL) run of the model was conducted at the National Center for Atmospheric Research (NCAR) and covers the 2000-2013 period, which includes all of the extreme events of this study. The model was configured with a domain size of 1360 × 1016 grid points, which covers all the contiguous United States, northern Mexico and southern Canada (Fig. 2.2a). There are 51 vertical levels, topped at 50 hPa. The model was one-way nested using the 6-h ERA-Interim reanalysis data. The Thompson aerosol-aware microphysics scheme was employed in the simulation (Thompson and Eidhammer, 2014), which is a single moment bulk microphysics parameterization. The scheme explicitly predicts the mixing ratios of five liquid and ice species: cloud liquid water, rain, cloud ice, snow, and graupel. A second moment is added for the number concentration of cloud ice. Liu et al. (2017) have shown that this simulation well represents the spatial and temporal patterns of sub-seasonal/seasonal/annual temperature and precipitation over all of the simulation domain. The mesoscale precipitation structures such as orographic precipitation and summertime convection are well reproduced by the model. It was also shown that most observed large-scale forced weather events (i.e. synoptic winter storms) were well replicated.
To investigate the thermodynamic feedback of climate change on freezing rain events in NB, we used the Pseudo Global Warming (PGW) simulation of Liu et al. (2017). The PGW method is a perturbation applied to the reanalysis data to simulate historical conditions in a warmer climate. In this case, the 95-year Coupled Model Intercomparison Project Phase 5 (CMIP5) ensemble-mean change signal under the RCP8.5 scenario (∆CMIP5 = CMIP5!"#$%!$""− CMIP5$&#'%!""() was applied on 8 physical fields of the ERA-Interim data while nesting the WRF model on the same grid
and time period as the CTL simulation. The perturbed physical fields are horizontal wind, geopotential, temperature, specific humidity, sea surface temperature, soil temperature, sea level pressure, and sea ice. Note that this method does not allow us to study the changes in storm tracking as it is based on monthly perturbations.
This method was chosen for two reasons. First, the comparison of the CTL and PGW simulations allows us to investigate the climatological changes between the two periods while avoiding internal variability of simulations conducted by GCMs. We can then isolate the thermodynamic impact of global warming in response to a given greenhouse gas (GHG) forcing. Secondly, it is possible to investigate extreme events in a very high-resolution grid, which is important in this study as we suspect that the local topography has an impact on freezing rain distribution in NB. Indeed, the 4-km resolution is enough to depict the various topographical features of NB (Fig. 2.2b) very well, whereas the highest resolution regional climate models (RCMs) used in similar climate studies have a 0.11° resolution. While at this resolution the topography is generally well defined, the complex topography of NB is not fully resolved. For example, the highest mountains in NB (e.g. Mount Carleton) are depicted ~100 m higher than with a grid-spacing of 0.11° (Fig. 2.3a).
2.2.3. Station Data and Model Validation
To assess the ability of the CTL simulation to reproduce winter storms in NB, daily precipitation and snowfall data from land surface weather stations all over the domain of interest were used. A total of 29 stations in the Global Historical Climatology Network (GHCN)-Daily were chosen based on the availability of the data in the 2003-2013 time period (Fig. 2.2b). For every storm studied, the total snowfall and the total precipitation were calculated by adding the daily values for all the days with measurable precipitation linked to a given winter storm. At each grid point in the model grid that is the closest to a station, the total precipitation and snowfall were also calculated for the same time period using the CTL simulation output data. For the total
21
snowfall, the value is the addition of snow and graupel (includes ice pellets), as snow observations include ice pellets. For every event, the mean bias and the correlation between the station data and the CTL simulation accumulated precipitation were calculated to decide if the simulation could be used to investigate the event. Based on these criteria, 68 of the 81 events were generally well reproduced by the CTL simulation, including the 7 freezing rain events.
2.2.4. Freezing rain observations and duration of events
Because no systematic freezing rain accumulation data exists in Canada, we chose to look at the duration of freezing rain events instead of amounts. The hourly reports of freezing rain at 10 Environment and Climate Change Canada weather stations were first compared to the CTL simulation to verify if the model depicts the right amount of freezing rain annually in historical conditions.
Freezing rain events durations have been calculated as in Marinier et al. (2020): an event duration is the number of hourly observations in which freezing rain (>0.2 mm h-1) was observed (including mix with other precipitation types). Up to 6 consecutive hours without freezing rain is permitted before identifying two separate events instead of only one.
2.2.5. Ice accretion on circular wires
One of the most disruptive consequences of freezing rain events is the ice loading on tree limbs and power lines that results in power outages. For that reason, the ice accretion produced by the identified events, as well as the ice accretion annual average was computed. The Jones ice load model (Jones, 1998) was used in this study, as it is a simple and generally accurate method to forecast the ice accretion on circular wires. The hourly uniform radial ice thickness is defined in the Jones model by equation 1: !!" =$#
!%[(P&&)
Assuming an ice density of &) = 0.9 g cm⁄ * and using Best’s relationship between
liquid water content and precipitation rate of - = 0.0677&.,-. (Best, 1949), the radial
thickness of ice then only depends on two meteorological variables: wind speed (m/s) and precipitation rate (mm/h). Note that this method is based on these assumptions: that the collision efficiency between raindrops and the circular wire is 1, and that the raindrops stick and form a uniform ice coating around the section of the cylinder. Moreover, the 10-m horizontal wind was used and it was assumed that the wind always blows perpendicularly to the power lines.
2.3. Historical climatology of winter precipitation
The mean annual total precipitation (Fig. 2.5a), rainfall (Fig. 2.5b), snowfall (Fig. 2.5c) and freezing rain (Fig. 2.5d) distribution using the CTL simulation are depicted for the period 2000-2013. The total precipitation distribution (Fig. 2.5a) is uniform across NB, with small regional differences. Over most of the province, the average total precipitation is within 1000-1300 mm/year. Nonetheless, mountainous regions receive slightly more annual precipitation, which is due to the orographic enhancement of precipitation. The hilly southern coast is the wettest location in NB, with more than 1400 mm/year in the highest elevations. The annual snowfall distribution (Fig. 2.5c) instead shows a large variability within the study area. The proximity to the Atlantic Ocean and the topography is responsible for such variability in NB. The annual snowfall generally increases from south to north with a little more than 150 mm/year of water equivalent in southern NB and more than 400 mm/year in the Appalachians of northern NB. On the contrary, the annual rainfall distribution (Fig. 2.5b) shows a slight decrease from south to north. This could be explained by the position of the transition region associated with winter storms, which often place northern NB in the cold, snowy sector of storms while southern NB and coastal regions are in the warm sector with the precipitation type transition region parallel to the coastline (e.g. Stewart
23
et al., 1990). The snowfall distribution is correlates well with the terrain even though the elevations are relatively low but can still reach up to 800 m.
Both the average annual freezing rain accumulation (Fig. 2.5d) and occurrences (Fig. 2.4) follow similar patterns. The region that records the highest accumulation/occurrence of freezing rain is the central part of the province, from the Appalachians to the region of Fredericton. Up to 40 h of freezing rain are recorded annually, which produce up to 45 mm of precipitation. Moving toward coastal areas, the occurrence of freezing rain decreases to ~20 h. In northern NB, the annual occurrence of freezing rain is lower (~15-20 h in Edmundston). The presence of the Appalachians in northern NB and the warm Atlantic Ocean to the southeast is likely responsible for such distribution and will be discussed in section 2.4. While there are very limited observations of freezing rain in NB, the CTL simulation reproduces the annual occurrences well (Fig. 2.4). Unfortunately, there are no stations with hourly weather condition data in the central part of the province where a maximum of freezing rain is reported.
2.4. Analysis of historical freezing rain events
All of the extreme freezing rain events in NB were associated with cyclones that followed fairly similar tracks (Fig. 2.1). They formed over the southeastern US bordering the Gulf of Mexico, and moved northeastward closely following the US east coast, ultimately passing over southern NB or slightly south of the NB/NS border. This shows that a specific synoptic pattern shared by these events strongly favors a temperature inversion over NB, which leads to a significant amount of freezing rain in some parts of the province. In comparison, only snow events (fig. 2.1a) followed tracks that remained well offshore (Nor'easters), with all but one system passing southeast of NB. In contrast, only rain events (fig. 2.1d) tracked northwest of the province, putting
NB in the warm sector of the storms and bringing temperatures above 0°C, preventing freezing precipitation at the surface.
Figure 2.6 shows the total freezing rain distribution produced by each identified extreme freezing rain event and its respective storm track. The width of the region that receives a considerable amount of freezing rain in NB is in most cases well above the typical 10-100 km width observed by Stewart et al. (1992) in historical Atlantic Canada winter storms. This implies that local features have also been crucial in producing conditions favorable to freezing rain.
2.4.1. Composite evolution of selected events
A composite of the seven freezing rain events was created because of their similar synoptic patterns (Fig. 2.7). To combine the events, the time step corresponding to the heaviest precipitation rates in NB were chosen subjectively as t=0 h.
At t=-24 h, an upper level trough of relatively short wavelength is over the US, along with a weak ridge over the western North Atlantic and Atlantic Canada (Fig. 2.7a). A closed surface low-pressure system has formed over the northern part of Alabama and Georgia in the composite, with a sea level pressure (SLP) center of 1009 hPa. The 250-hPa wind field is showing upper level divergence over the southeast US (not shown), putting all the factors together for rapid cyclogenesis of a Miller type-A nor'easter in the southeast coastal plains (e.g. Miller, 1946; Kocin and Uccellini, 2004). In addition to the development of a surface low-pressure system, a high-pressure system is centered over Quebec. The presence of this cyclone-anticyclone couplet is a key pattern associated with the onset of freezing rain events in the northeastern US and southeastern Canada (Ressler et al., 2012; Rauber et al., 2001).
By t=-12 h, the deeper surface composite low-pressure system is located over Maryland with a SLP center of 1004 hPa (Fig. 2.7b). The eastward displacement and amplification of the 500-hPa trough-ridge pattern demonstrate the propagation and the
25
intensification of the surface cyclone (e.g. Sutcliffe and Forsdyke, 1950). The high-pressure center propagated slightly eastward, over southwestern Labrador with a relatively high SLP center of 1030 hPa. The closer positioning and strengthening of the cyclone-anticyclone couplet in a southwest-northeast axis produces a strong pressure gradient force parallel to the coastline (and the Appalachians mountains). This synoptic setup is conducive to CAD east of the Northeast US Appalachians (e.g. Lackmann, 2011; Kocin and Uccellini, 2004), which is recognizable by a U-shaped isobar pattern over New England (Fig. 2.7b). Warm frontal lifting aloft and high moisture advection produces widespread precipitation in New England at this time (e.g. Fig. 2.9a). With the CAD process enhancing the differential temperature advection between the surface and the mid-levels, freezing rain is produced between the mountains and the coast of New England in 6 of the 7 events of the composite at t=-12 h. This brings insights that events leading to a significant freezing rain accumulation in NB often cause significant icing in the coastal plains of New England before the onset of precipitation in NB. At t=0 h, the composite low-pressure center is located over southern Maine (998 hPa), and the high-pressure system has again shifted slightly eastward over Labrador (Fig. 2.7c). Over NB, strong geostrophic wind veering demonstrates significant warm air advection aloft. Surface winds are, however, from the northeast over most of NB (e.g. Fig. 2.9f), which suggests significant ageostrophic flow near the surface. The composite shows a plume of high precipitable water values extending from the subtropical Atlantic into NB. Together with warm frontal lifting, this produces high precipitation rates in NB. It is also noteworthy that the 540 dam 500-1000 hPa thickness is passing through the center of NB at this time.
At t=+12 h, the composite low-pressure center has continued its path northeastward over the Gulf of Saint Lawrence and has deepened to 996 hPa (Fig. 2.7d). The associated cyclonic circulation advected dry and cold air into NB at this time. Without frontal lifting, precipitation decreases rapidly in NB and the main precipitation region
has moved over Newfoundland and Labrador. Persistent snow showers remained active during a few hours past t=+12 h in NB and colder air expanded over the province, as seen in the smaller 500-1000 hPa thickness values (Fig. 2.7d). At this time, some of the surface low-pressure systems had become occluded.
2.4.2. Distribution of precipitation
To investigate how various types of precipitation were distributed across NB during freezing rain events, a precipitation accumulation composite of the seven freezing rain events was created. Knowing that all of the storm followed a southwest to northeast trajectory, we defined a northwest/southeast section (Fig. 2.8a). This cross-section intersects perpendicularly both the Appalachian Mountains and the southern NB coast, providing results on how the local topography affects the distribution of precipitation. The impact of the distance relative to the storm tracks on accumulated precipitation types can also be assessed.
The region from Mount Carleton to the Bay of Fundy is where the main precipitation type varies along the cross section. North of Mount Carleton, snow is by far the most important precipitation type during the events. South of the Bay of Fundy, rain was mostly recorded. Between the two points, the main precipitation types shift from snow to rain, indicating that the transition region during the chosen events was often located between the Appalachians and the Bay of Fundy. A large amount of freezing rain and graupel was recorded in this transition region. This is consistent with the freezing rain distribution associated with individual events (Fig. 2.6). In fact, the highest freezing rain accumulation in every case except the 10-12 December 2008 event (see Appendix A) were recorded between the Appalachians and the southern coast, with the region of maximum amounts parallel to the mountain chain.
27
2.4.3. Case study of 2 February 2008 event
The freezing rain event of 2 February 2008 is used here as a case study. This event was very well reproduced by the simulation and is representative of the composite discussed in sections 2.4.1. and 2.4.2. At 1200 UTC 2 February 2008, the surface low-pressure system, centered over eastern Maine, produced heavy precipitation over NB. Graupel, freezing rain and rain occurred in northern, central, and southern NB, respectively (Fig. 9b). Warmer temperatures to the southeast and colder to the northeast is associated with an intense horizontal temperature gradient (Fig. 2.9d). Consequently, strong warm air advection aloft under veering winds was responsible for the development of a melting layer aloft, as seen in the evolution of the temperature profile in Caribou, Maine between 0000 UTC (Fig. 2.10a) and 1200 UTC (Fig. 2.10d). While the WRF-CTL simulation generally reproduce the observed vertical temperature profiles very well (Fig. 2.10), it is noteworthy that the model representation of the temperature near the surface during the event is less accurate than that aloft. In this case, the model is colder than observed temperatures, which could have an impact on the simulated distribution of freezing rain. This was also noted by Marinier et al. (2020).
The comparison between the isobar pattern (Fig. 2.9a,b) and the near-surface wind (Fig. 2.9e,f) shows a sharp difference between the geostrophic wind and the actual wind over parts of NB. While the decrease in wind speed and the change in its direction are partly caused by the surface roughness that increases friction in the low-levels, it is also strongly linked to the change in terrain elevation. It is particularly evident southeast of the Appalachian Mountains of northern NB at 1200 UTC (Fig. 2.9f), where the low-level winds are from the north. As the strong easterly winds over the Gulf of Saint Lawrence approached the Appalachians, the mountains acted as a physical barrier to the stable flow and trapped the existing cold air along the eastern slopes. A calculation of the non-dimensional mountain height (inverse Froude number) confirmed that the easterly flow was blocked, the value of the non-dimensional mountain height being
well over the threshold value of 1.2 (e.g. Colle et al., 2013). As a result, it created a channeling (or damming) of the near-surface air flow, forcing the low-level wind to follow the terrain in an ageostrophic northeasterly flow. This prevents the air near the surface to warm above freezing, which produces a prolonged period of freezing rain in central NB. This observed process shares similarities with the CAD affecting the regions east of the Appalachians in the US (e.g. Forbes et al., 1987; Lackmann, 2011). The deformation in the SLP field, as seen on the southern side of the mountains in New England at 0000 UTC (Fig. 2.9a) and in NB at 1200 UTC (Fig. 2.9b), is also a typical characteristic of the cold air damming process.
The cross-sections depicted in figure 2.11 show the evolution of the temperature profile throughout NB between 0000 UTC and 1200 UTC. While the temperature profile shows little variation below 3 km at 0000 UTC (Fig. 2.11a), 12 hours later (Fig. 2.11c) the temperature near the surface is up to ~15°C colder compared to the temperature at 2 km. Again, the wind channeling/cold air damming effect caused by the Appalachians is visible. The veering winds, as well as the low-level cold-air advection (not shown), are the strongest between Mount Carleton and the Bay of Fundy at 1200 UTC (Fig. 2.11c). As a result, this is where the temperature inversion in strongest and where the maximum of freezing rain accumulation was reported. Therefore, the presence of the Appalachians in the northern part of the province is a key element to set the stage for prolonged periods of freezing rain in NB through the wind channeling/cold air damming process that reinforces temperature inversions. Furthermore, they explain why a maximum of annual freezing rain occurrences and accumulation is observed south of the Appalachians in NB.
29
2.5. Freezing rain events under a warmer climate
In this section, the climate changes of freezing rain are analyzed through the differences between the two simulations conducted (i.e. future-historical). As mentioned before, PGW uses the warming projected for the 2071-2100 period under the RCP8.5 scenario considering only the thermodynamic changes in the climate.
2.5.1. Projected changes in annual average
The changes in total precipitation are fairly uniform throughout NB, with an increase of 20-30% annually (Fig. 2.5i) over most of the province. These numbers are consistent with the CMIP5 ensemble projection for the period 2071-2100 under RCP8.5 over Atlantic Canada (Liu et al., 2017). More evaporation occurs at warmer temperatures, translating into an increase of global precipitation in already humid regions (e.g. Trenberth, 2011) like NB. The increase is slightly higher on the east coast of NB (30-40%). This stronger increase is likely caused by warmer sea surface temperatures and a major reduction of sea ice coverage on the Gulf of Saint Lawrence in PGW (not shown), allowing more moisture to be converted into precipitation in the adjacent coastal regions. The projected changes show a strong decrease of annual snowfall over all regions of NB (Fig. 2.5j). The change varies from -50% in southern and eastern NB to -30% in northern NB. In PGW, southern NB would receive < 100 mm of snowfall in water equivalent annually. The projected change in annual rainfall generally suggests an increase of 40-50% throughout NB (Fig. 2.5k). This is because snow generally changes into rain. For example, the PGW simulation is ~6°C warmer on average over NB during the cold season (Liu et al., 2017).
The annual amount of freezing rain over most of NB should decrease in the future, except in the northwestern part of the province in the area of Edmundston and the upper Saint John River Valley where there is instead a moderate increase. This distribution is generally consistent with the northward/inland shift in the freezing rain distribution
found in previous studies (e.g. Lambert and Hansen, 2011). Indeed, in the coastal regions of the Maritime Provinces, the projected change is a major decrease in the annual amount of freezing rain (~-50%). This shift is likely caused by a northward and inland displacement of the average position of the 0°C isotherm, bringing conditions more favorable to freezing rain in northwestern NB. Moreover, both warmer sea surface temperatures (~5°C warmer, not shown) and the reduction of sea ice coverage in PGW have an effect on freezing rain by forcing near surface temperatures to be warmer in coastal regions as the wind direction is frequently onshore during winter storms. The central part of the provinces, south of the Appalachians, remains the region of maximum annual freezing rain, with only a slight decrease in PGW, which suggests that CAD still has a significant impact on freezing rain events under warmer conditions.
2.5.2. Projected changes in the occurrence of freezing rain events
The seven historical extreme freezing rain events (Sect. 2.2.1) were also analysed in PGW to investigate how the warmer and more humid conditions would affect these storms. By comparing the composite precipitation type distribution along a northwest-southeast cross-section (Fig. 2.8), we see a ~125 km poleward shift in the regions that receive a maximum of freezing rain in PGW. Northern NB receives graupel and freezing rain in PGW whereas it mostly recorded snowfall in the historical storms. The average amount of freezing rain produced by these storms remains approximately the same in PGW. In the case of the 2 February 2008 storm, while we see an inland shift of the near-surface 0°C isotherm (Fig. 2.9c,d) and northward propagation of the melting layer aloft in PGW, the same wind patterns aloft and near the surface are seen in both simulations. Consequently, in this case CAD is still sufficient in PGW to produce freezing rain in central NB at 1200 UTC (Fig. 2.11d).
As more freezing rain events occurred during the 2000-2013 period than the extreme events identified (Sect. 2.2.1), the local changes in the occurrences of freezing rain events in 6 locations across NB has been analyzed (Fig. 2.12). Four of the locations