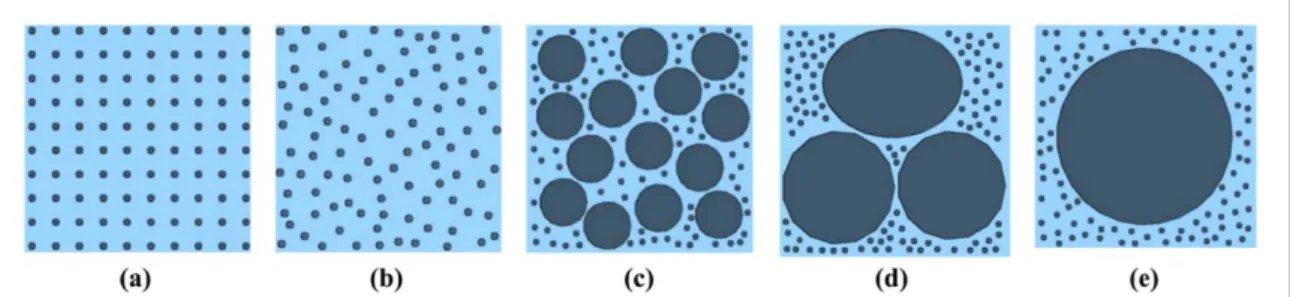
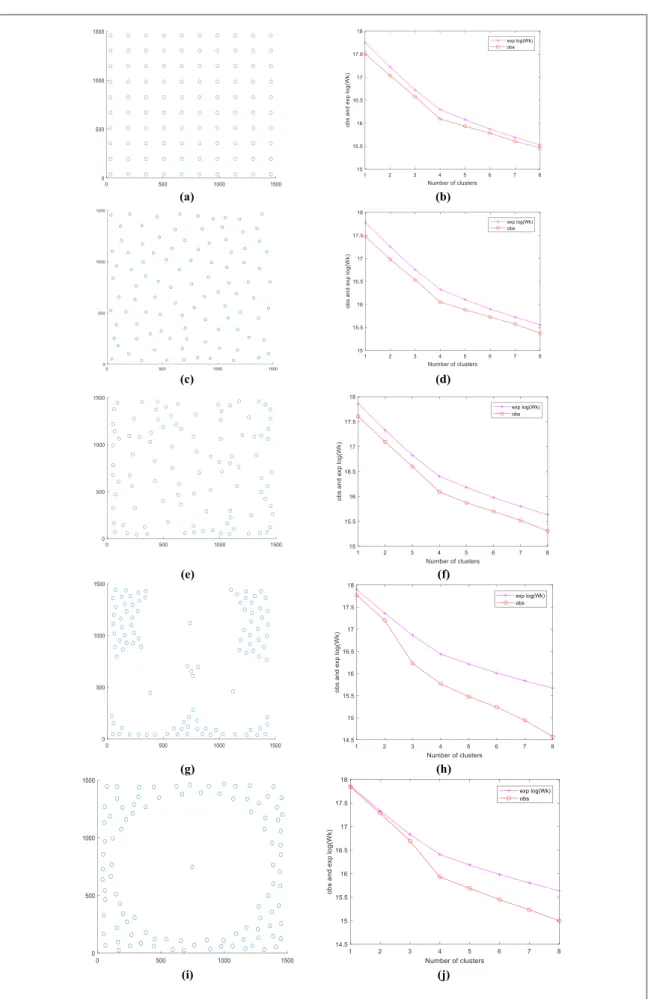
Quantification of nanoparticle dispersion within polymer matrix using gap statistics
Texte intégral
Figure


Documents relatifs
The epoxy resin is also involved in obtaining these exceptional properties thanks to its ability to impregnate the fibers well, its chemical and electrical resistance and low
One identifies the region of anomalous dispersion as, in fact, the mobility gap, terminating in well defined mobility edges where we find m* = co and the mobility
When running FLEXPART forward in time for a deposit- ing species with a given emission flux (kilograms per re- lease as specified in file RELEASES), the accumulated wet and
In contrast to the Hanna turbulence in FLEXPART, AROME TKE fields include shallow convective transport, allowing novel turbulent modes in FLEXPART-AROME to mix boundary layer air
In order to get a better description of the horizontal mixing, Figure 5 correspond to 2D horizontal maps of the PNC in 3 horizontal planes: Y=-0.04 (tailpipe level, Figure 5a),
In this section, the dispersion equation of radially periodic structures composed of multiple layers of cylindrical Frequen- cy Selective Surfaces (FSSs) is derived by using
When particle pairs are initialised away from the wall, with initial separations within the inertial range, the model closely predicts the mean- square separation obtained from
