Science Arts & Métiers (SAM)
is an open access repository that collects the work of Arts et Métiers Institute of Technology researchers and makes it freely available over the web where possible.
This is an author-deposited version published in: https://sam.ensam.eu Handle ID: .http://hdl.handle.net/10985/13494
To cite this version :
Joffrey VIGUIER, Christophe BOURGEAY, Anti ROHUMAA, Guillaume POT, Louis DENAUD - An innovative method based on grain angle measurement to sort veneer and predict mechanical properties of beech laminated veneer lumber - Construction and Building Materials - Vol. 181, p.146-155 - 2018
An innovative method based on grain angle
measurement to sort veneer and predict mechanical
properties of beech laminated veneer lumber
Joffrey Viguiera,, Christophe Bourgeaya, Anti Rohumaaa, Guillaume Pota, Louis Denauda
aLaBoMaP, Arts & M´etiers ParisTech, rue Porte de Paris, F-71250 Cluny, France
Abstract
This study proposes an innovative model based on local grain angle mea-surements to predict the modulus of elasticity of LVL made from beech. It includes a veneers sorting method industrially compatible thanks to its low computational time. For this study 41 LVL panels were prepared from 123 beech sheets of veneers. Local grain angle was obtained with a two dimen-sional scanner and veneer density was measured. Several models based on these measurements have been developed and their ability to predict the modulus of elasticity of LVL panels have been compared. The model based only on local grain angle measurements have been proven more efficient than models taking into account the veneer density. The proposed method can be used to sort veneer during the peeling process and grade the production of LVL panels to optimize their mechanical properties even for low-quality veneer.
Keywords: Laminated Veneer Lumber, grain angle, mechanical properties, beech, grading
List of main symbols :
1
ρveneer Veneer density
θ(x, y) Local grain angle
Eveneer(x, y) Local modulus of elasticity of veneer
¯
Eveneer Averaged local modulus of elasticity of veneer
Eglob,exp Global modulus of elasticity assessed by static bending
Eply(x, y) Local modulus of elasticity of veneer with variables
parameters
Emean(x) Averaged local modulus of elasticity along the width
of veneer
Eglob,mod(ρ) MOE calc. on basis of the proposed model taking into
account only the density
Eglob,mod(GA) MOE calc. on basis of the proposed model taking into
account only the grain angle
Eglob,mod(ρ + GA) MOE calc. on basis of the proposed model taking into
account both the density and grain angle ρpanels Panels density
¯
Epanel Average of Eveneer(x, y) of the three constitutive plies
¯
Epanel−opti Average of Eply(x, y) of the three constitutive plies
with optimal parameters ¯
θabs,veneer Average value of local grain angle in absolute value
1. Introduction
3
In recent years, interest in the use of beech as a raw material in engineered
4
wood products for structural purpose has increased in Europe, particularly
5
in France and Germany, where these renewable resources are available and
6
not used to their fullest extent. Laminated veneer lumber (LVL) is made
7
from rotary peeled veneers that have been dried and then glued together.
8
The grain direction of the layers is mainly oriented in the same direction and
9
parallel to its length [1]. This product has exhibited superior mechanical
10
properties in axial bending tests compared to solid wood even when
man-11
ufactured from lower-grade logs [2, 3]. In LVL, the defects are randomly
12
distributed throughout the cross-section, which prevents the concentration
13
of stresses at specific locations. Moreover, using low-grade veneers in the
14
inner plies can reduce the processing costs without significant decrease in
15
mechanical properties. Furthermore, the aesthetic value of the final product
16
is conserved by using free-defect veneers only for visible sides. This approach
17
is well known for drawing full benefit from second quality wood.
18
The mechanical properties of LVL can be affected by several factors such
19
as juvenile wood [4, 5], jointing method [6], lathe checks [7, 8], load direction
20
[9, 10], veneer thickness [11] or sylvicultural pratice [12].
21
To predict the mechanical properties of LVL some non-destructive
test-22
ing (NDT) methods were studied in the literature to evaluate the bending
23
properties. A study on red maple[13] showed that the flexural properties of
24
LVL can be predicted using ultrasonic method and suggested that the
per-25
formance of LVL can potentially be enhanced through ultrasonic rating of
26
individual veneer sheets. The same conclusions have been made in a study
for LVL made of Schizolobium parahayba [14]. Another study conducted
28
on southern pine [15] used ultrasonic method and transverse vibration and
29
showed that the prediction of the bending stiffness using these methods is
30
less accurate and reliable for LVL compared to solid wood. Pu and Tang [15]
31
also found a significant effect of veneer grade on the modulus of elasticity
32
(MOE) of LVL. The efficiency of ultrasonic methods for two different species
33
has also been discussed by de Souza et al. [16] and it has been shown that
34
the correlation with the MOE was significant for Pinus kesiya and that there
35
was no correlation for Pinus oocarpa.
36
The wood material presents a very high variability arising from several
37
factors. In particular, many studies have shown the existing correlation
be-38
tween density and mechanical properties [17, 18, 19] of sawn timber.
39
For clear wood in general, the MOE in fibers direction can be considered
40
to depend on density and microfibril angle (MFA) [20]. However, beech
41
wood is a very homogeneous specie regarding the density: its coefficient
42
of variation (CV) can vary between 4% and 6 % only [21, 22]. Therefore,
43
the level of determination of MOE variation which have a CV up to 16%
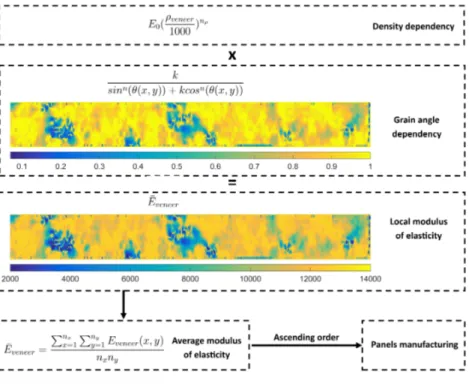
44
[22], by density is expected to be low. The variation in specific modulus
45
(MOE divided by the density) due to tree growth (juvenility, ring width,
46
tree slenderness, reaction wood...) is on the contrary similar to other species
47
and driven by MFA variations.
48
At the timber scale, several other studies [23, 24, 3] report the same
49
tendencies regarding the variation of density (CV from 5% to 6%). More
50
than 1800 timber beams of beech were characterized in [23], the coefficient
51
variation of MOE was found to be up to 20% (mean value equal to 14 100
MPa) for a coefficient variation of density equal to 6% (mean value equal to
53
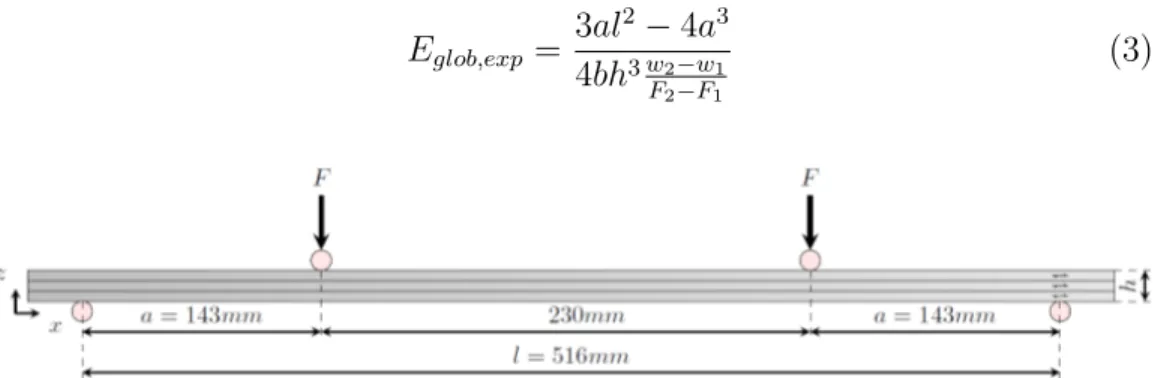
670 kg.m−3). Another study on compression and tension properties of beech
54
lamination [24] stated that due to its low variation (CV of 5%), density
55
could not contribute significantly to the strength and stiffness prediction.
56
This study also showed the poor correlation existing between density and
57
modulus of elasticity in both tension and compression tests, with a coefficient
58
of determination found between the density and the modulus of elasticity
59
lower than 0.06.
60
For beech LVL, the variation of density according to [3] is also low (CV
61
lower than 5%). In addition, the authors didn’t even tried to grade the
62
veneers according to density based on previous study [25] stating that there
63
were no relationship between density and strength properties for beech wood.
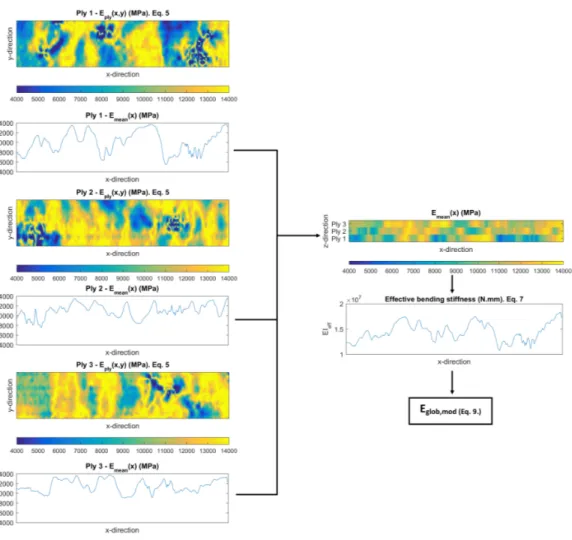
64
Moreover, local singularities such as knots and grain angle have a strong
65
influence on the mechanical properties. Indeed, the authors of [24] finally
66
concluded that strength and stiffness are mainly determined by the knot
67
area ratio. Several studies have focused on the measurement of the local grain
68
angle on timber [26, 27, 28]. The potential of the grain angle measurements
69
has also been studied for strength grading of timber and it has already proven
70
to be efficient to predict mechanical properties [29, 30, 31, 32]. Other studies
71
[33, 34] have also shown the potential of grain angle measurements to predict
72
mechanical properties of glulam beam made of spruce. To the best knowledge
73
of the authors there are no investigations carried out on local grain angle
74
measurement to predict LVL mechanical properties.
75
The main purpose of the present study is to develop a method based on
76
grain angle measurement to predict the modulus of elasticity of LVL made
of beech. The second goal is to assess the efficiency of local grain angle
78
measurements to grade beech LVL.
79
2. Materials and methods
80
2.1. Veneers production
81
Two green logs of beech from two different trees (Fagus Sylvatica L.)
82
were selected from the plantation site of Cluny (Burgundy, France) for their
83
high knotiness. They were soaked at 60°C for 24 hours and then rotary
84
peeled using a light packaging scale lathe (SEM S500 - knife length 900 mm)
85
equipped with an angular pressure bar. The veneer’s thickness was set to 2
86
mm and the compression rate was 5% of veneer thickness (a gap of 1.9 mm
87
between cutting face and pressure bar nose). Subsequently the veneers were
88
dried in a vacuum dryer with heating plates to limit waviness and to reach
89
about 12% moisture content. Afterward, dried veneers were cut to 600 ×
90
75 mm2 and conditioned in a climatic chamber for 72 h at a temperature
91
of 20 °C and 65% of relative humidity. After conditioning, each veneer was
92
weighed to obtain their average specific density ρveneer. In total, 123 veneers
93
were prepared for this study.
94
2.2. Grain angle measurement
95
Each veneer sheet was characterized with an optical scanner designed
96
to measure the local grain angle (BobiScan, LaBoMaP). The grain angle is
97
measured by projecting a line of laser spots on the surface of the veneer.
98
As a result of wood anisotropic light diffusion properties, an elliptic pattern
99
oriented parallel to the projection of the fibers axis can be observed on veneer
surface. The grain angle can be obtained with Principal Component Analysis
101
applied on each ellipse binarized image. The grain angle evolution over the
102
whole veneer surface is obtained by illuminating the surface with several
103
laser spots along a line (Figure 1 a). The grain angle measurement has been
104
conducted only on one face of each veneer (it has been considered that the
105
grain angle is the same through the section since the thickness is only 2
106
mm). An example of the grain angle measurement is shown in Figure 1 (b)
107
where the resolution is 1 mm in x direction and 5 mm in y direction. As
108
a final step, a linear interpolation of the raw data was conducted to obtain
109
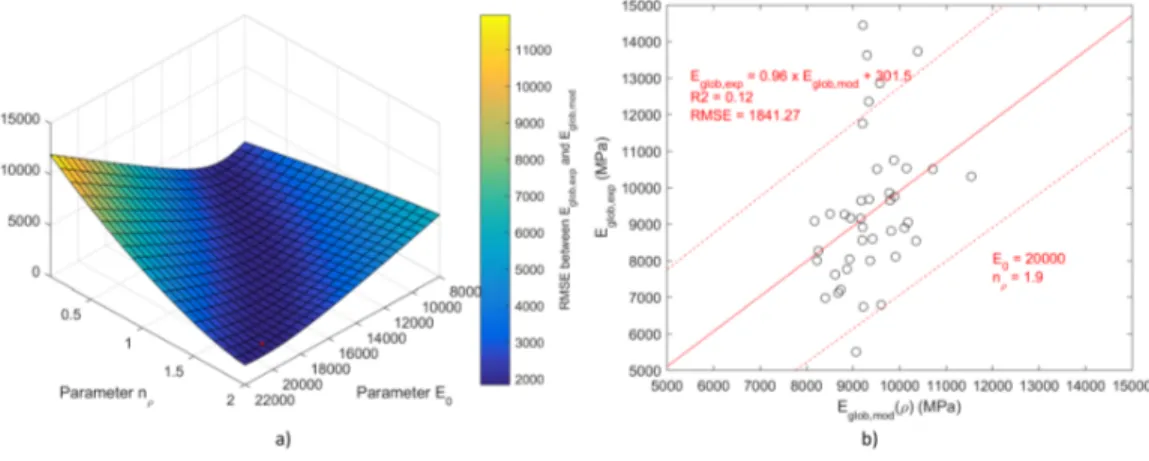
a regular grid (Figure 1 (c)). This accurate technique allows to observe the
110
strong deviations of the fibre direction around knots.
111
Figure 1: Local grain angle measurement: a) photography, b) raw data c) interpolated data θ(x, y) (Angles are represented in °)
2.3. LVL panel manufacturing
112
The 41 three plies LVL panels were prepared with dimensions 6 × 75 ×
113
600 mm3 out of 123 veneer sheets. A commercial Polyvinyl acetate (PVAc)
114
formulation (0892 100, Wurth) with a spread rate of approximately 150 g/m2
115
was used. The panels were pressed in a hydraulic press at 3 bars. To
max-116
imize the panels mechanical properties variability, the veneers were sorted
117
according to the grain angle measurement θ(x, y) (°) and their density ρveneer
118
(kg/m3); this variability maximization is described below.
119
For each veneer, a local modulus of elasticity Eveneer(x, y) (MPa) was
120
calculated using Equation 1.
121
Eveneer(x, y) = (E0(
ρveneer
1000 )
nρ) k
sinn(θ(x, y)) + kcosn(θ(x, y)) (1)
This equation is based on the relationships exhibited in [35] for the
mod-122
ulus regarding the density (E0 = 16 500 MPa and nρ = 0.7 for hardwood).
123
The modulus on a given density is multiplied by the Hankinson formula [35].
124
The k parameter represents the ratio between the modulus of elasticity
per-125
pendicular to the grain and the modulus of elasticity parallel to the grain
126
and has been taken equal to 1
15 according to EN 338 [36] and n has been
127
taken equal to 2.
128
Finally, an average modulus of elasticity ( ¯Eveneer) was computed for each
129
veneer using Equation 2.
130 ¯ Eveneer = Pnx x=1 Pny y=1Eveneer(x, y) nxny (2) The variables nx and ny respectively represent the number of pixels in x
131
and y direction. Subsequently, veneers were grouped by 3 in ascending order
according to ¯Eveneer to form the three-ply panels. This process is presented
133
in Figure 2.
134
Figure 2: Overview of veneers sorting and panels manufacturing process
2.4. Mechanical testing
135
Prior to mechanical testing, all panels were conditioned in a climatic
136
chamber for 72 h at a temperature of 20 °C and 65% relative humidity. The
137
panels were tested in four-points bending test as shown in Figure 3. The
138
global modulus of elasticity was calculated according to Equation 3, where h
139
and b are respectively the beam thickness and depth, a is equal to 143 mm,
140
l is the span, F2 - F1 is an increment of load (N) on the linear regression
(on the load vs. displacement curve), and w2 - w1 is the increment of global
142
displacement (mm) corresponding to the load increment F2 - F1.
143 Eglob,exp = 3al2− 4a3 4bh3 w2−w1 F2−F1 (3)
Figure 3: LVL mechanical test setup in 4 points-bending
2.5. Analytical models: prediction of the LVL mechanical properties
144
In this section, three models based on veneer density, local grain angle
145
measurements or a combination of both are presented and their ability to
146
predict the modulus of elasticity of LVL panels are compared.
147
2.5.1. Estimation of the global modulus of elasticity
148
The first step is to assign a modulus of elasticity Eply(x, y) to each veneer
149
constituting a ply of the LVL panel. The difference between the three models
150
rely on the calculation of Eply(x, y). For the model based only on the veneer
151
density, Eply(x, y) is calculated using Equation 4. Equation 5 and 6 are used
152
for the models using only local grain measurements and a combination of
153
both density and grain angle respectively.
154
Eply(x, y) = E0× (
ρveneer
1000 )
Eply(x, y) = E0 ×
k
sinn(θ(x, y)) + k × cosn(θ(x, y)) : Grain angle (5)
Eply(x, y) = (E0×(
ρveneer
1000 )
nρ)× k
sinn(θ(x, y)) + k × cosn(θ(x, y)) : Grain angle & Density
(6) The parameter E0 is a constant representing the modulus of elasticity
155
parallel to the grain, nρ a constant, k the ratio between E0 and E90 and n a
156
constant. The parameters in these equation are the same as in Equation 1,
157
but in this part their values are changing (see Table 1).
158
In the second step Eply(x, y) was averaged along the y-direction to obtain
159
a profile Emean(x) of the modulus of elasticity along the x-direction for each
160
LVL ply. Using these profiles, an effective bending stiffness (EI)ef f was
161
calculated for each section along the x-direction of the LVL panels, according
162 to the Equation 7. 163 (EI)ef f(x) = nply=3 X ply=1
(Emean,ply(x)Iply+ Emean,ply(x)Aplydply(x)2) (7)
Where Aply , Iply and dply(x) are respectively: the area, the second
mo-164
ment of area, and the distance from the neutral fibre of each element at a
165
given x position. nply is the total number of plies in z direction.
166
In this section, the deflection at mid-span in the case of a four point
167
bending test (v(2l)) of the modeled panels is calculated to obtain Eglob,mod
168
which can be assimilated to an equivalent of Eglob,exp. The deflection at
mid-span (v(2l)) of the modeled panels can be calculated using the M¨
uller-170
Breslau’s principle (see Equation 8).
171 v(l 2) = nx X i=1 Mf,iMv,i (EI)ef f,i ∆x (8)
Mf is the bending moment during a 4-points bending test, Mv is the
172
bending moment induced by an unitary load at midspan, (EI)ef f is the
173
effective bending stiffness calculated previously which is dependent of the
174
local modulus of elasticity, nx is the number of elements along x direction,
175
and ∆x=1 mm corresponds to the resolution of the images along x direction.
176
The modulus of elasticity was calculated according to the beam theory
177
in 4 point bending using Equation 9.
178 Eglob,mod = 3al2− 4a3 4bh3 v(2l) F (9) F is the load which induced the previous bending momentum Mf, l is
179
the span, and the mid-span deflection term v(2l) is the one calculated by
180
Equation 8. a, b and h are the same than in Equation 3. The different steps
181
described above, where only the grain angle is considered, are resumed in
182
Figure 4.
Figure 4: Principle of the analytical modeling in the case Equation 5 is used for Eply(x, y)
2.5.2. Analytical models parameters optimization
184
The final predicted global modulus of elasticity depends on different
pa-185
rameters: E0, nρ, k and n. Different values for theses parameters can be
186
found in the literature. In this study the relevant parameters were computed
187
by minimizing the root mean square error (RMSE) between Eglob,mod and
188
Eglob,exp. Each possible Eglob,mod has been calculated using every possible set
189
of parameters described in Table 1. Eglob,mod(ρ) is calculated using Equation
190
4, Eglob,mod(GA) using Equation 5 and Eglob,mod(ρ + GA) with Equation 6.
191
Eglob,mod(ρ) Eglob,mod(GA) Eglob,mod(ρ + GA)
Parameters Min Step Max N Min Step Max N Min Step Max N E0 8 000 500 22 000 29 8 000 500 22 000 29 8 000 500 22 000 29
nρ 0.1 0.1 2 20 - - - - 0.1 0.1 2 20
k - - - - 0.01 0.005 0.07 13 0.01 0.005 0.07 13
n - - - - 1.5 0.05 2.5 21 1.5 0.05 2.5 21
Total scenarios 580 Total scenarios 7 917 Total scenarios 158 340
Table 1: Bounds, step size and number of scenario tested for each parameter of each model
3. Results and discussions
192
3.1. Veneers physical properties
193
Descriptive statistics of measured and calculated properties of the
differ-194
ent veneers are presented in Table 2. The coefficient of variation of the veneer
195
density ρveneer is equal to 5.3% which is really close to what can be found in
196
the literature. The average local modulus of elasticity ¯Eveneer (calculated
us-197
ing Equation 2 i.e with parameters from the literature) seems to have a very
198
low coefficient of variation (7.6%) in comparison with what could be expected
from the literature. This could be explained by the fact that the parameters
200
used in the calculation of ¯Eveneer have been computed for hardwood and not
201
in particular for beech or simply by the fact that this parameter is a simple
202
average and do no represent a modulus of elasticity. The mean absolute value
203
of the local grain angle ¯θabs,veneer have been computed, its range goes from
204
1.9 °to 11.9 °. In addition, the coefficient of correlation R between ¯θabs,veneer
205
and ¯Eveneer is equal to -0.88 showing the negative influence of the grain angle
206
on ¯Eveneer . Finally, the thickness h of individual veneer is also described,
207
the mean is really close to the target and the coefficient of variation is very
208
low (CV = 3.3%).
209
Min Mean Max StD CV(%) R2(p-value) E¯
veneer θ¯abs,veneer
ρveneer 588.9 670.9 761.5 35.6 5.3 ρveneer 0.08 (1.6E-3) 0.04 (2.1E-2)
¯
Eveneer 7958.8 10657.5 12467.6 813.3 7.6 E¯veneer - 0.77 (5.5E-40)
¯
θabs,veneer 1.9 6.0 11.9 -
-h 1.85 2.02 2.30 0.07 3.34
Table 2: Minimum, mean, maximum, standard deviations (StD), coefficient of variation (CV), and coefficient of determination for different measured veneer properties
3.2. Panels physical properties
210
The measured and calculated properties of the different panels, i.e density,
211
¯
Epanel (which is the average between the three ¯Eveneer constitutive of each
212
panels) and Eglob,expare presented in Table 3. The mean modulus of elasticity
213
Eglob,exp appears quite low (9 350 MPa) for LVL made of beech; indeed in
214
the literature [3], this value reach approximately 16 000 MPa. This might
215
be due to two reasons, the first one is that only very low quality veneers
216
have been used and the second one is that the panels are only composed of
three veneers which reduce the potential for a good homogenization of the
218
mechanical properties. The coefficient of variation of Eglob,exp is higher than
219
in the literature [3] due to the process we used to produce the panels by
220
maximizing the variability. The average density ρpanels(which is the average
221
between the three ρveneer constitutive of each panels) is on the contrary close
222
to what can be found in the literature. The coefficient of determination
223
between ρpanels and Eglob,exp is only equal to 0.12 and this correlation is not
224
significant at the 0.01 level (p-value = 0.026). Furthermore, the coefficient of
225
variation of ρpanelsis only 3.9% maybe due to the fact that only two logs have
226
been used and probably leads to a density explaining only 12% of Eglob,exp
227
variance. A relatively good correlation exists between ¯Epanel and Eglob,exp
228
(R2 = 0.69, p-value = 9.4E-12) which corroborate the efficiency of the grain
229
angle measurement to predict mechanical properties of LVL made of beech.
230
Nevertheless, the range and the coefficient of variation of ¯Epanel is much
231
lower than the ones for Eglob,exp. This result highlights the fact that a true
232
computation of a modeled modulus is needed instead of a simple average and
233
also that some optimization is needed on the parameters involved in ¯Epanel
234
calculation.
235
Min Mean Max StD CV(%) R2(p-value) ρ
panels E¯panel
Eglob,exp 5504.1 9348.8 14442.6 1985.9 21.2 Eglob,exp 0.12 (0.026) 0.69 (9.4E-12)
ρpanels 624.3 670.9 748.9 26.6 3.9 ρpanels - 0.29 (2.5E-4)
¯
Epanel 8541.6 10657.5 12256.1 800.8 7.5
Table 3: Minimum, mean, maximum, standard deviations (StD), coefficient of variation (CV), and coefficient of determination for different measured panel properties
Furthermore, one can notice that the coefficient of variation of ¯Epanel and
¯
Eveneer are really close to each other (7.5% and 7.6% respectively). This
237
result could be surprising since one of the advantage of producing LVL is
238
to homogenize the mechanical properties. However, it was expected in this
239
study because of the process used to select the constitutive veneer of each
240
panels in ascending order of ¯Eveneerto maximize their variability. The average
241
coefficient of variation of ¯Epanel that could have been observed if the veneers
242
had been selected at random is approximately 4.4%. This value have been
243
calculated thanks to randoms permutation of ¯Eveneerto constitute LVL panels
244
and is the average coefficient of variation observed for 1000 repetitions.
245
3.3. Prediction of the LVL properties by analytic modeling
246
3.3.1. Model based only on density Eglob,mod(ρ)
247
The results of the model using only the density as input data are presented
248
in Figure 5. The left part of the Figure 5 shows the sensibility analysis of
249
the two parameters involved in this model (nρ and E0). The z-axis and
250
the colors represents the RMSE between Eglob,mod(ρ) and Eglob,exp. It can
251
be seen that a significant amount of parameters can give nearly the same
252
results (i.e a RMSE value close to 2 000 MPa) revealing the poor correlation
253
between density and modulus of elasticity. The optimal parameters are 1.9
254
and 20 000 respectively for nρ and E0. The corresponding RMSE for this
255
scenario is equal to 1841.3 MPa, the coefficient of determination is equal
256
to 0.12 and has nearly the same level of significance than the one between
257
ρpanels and Eglob,exp (p-value = 0.027). Those results show that taking into
258
account the position of the different plies and the bending solicitation does
259
not improve the prediction of the final modulus of elasticity if only the density
260
is considered as an input data.
Figure 5: a) Sensibility analysis of the different parameters and b) prediction results for Eglob,mod(ρ)
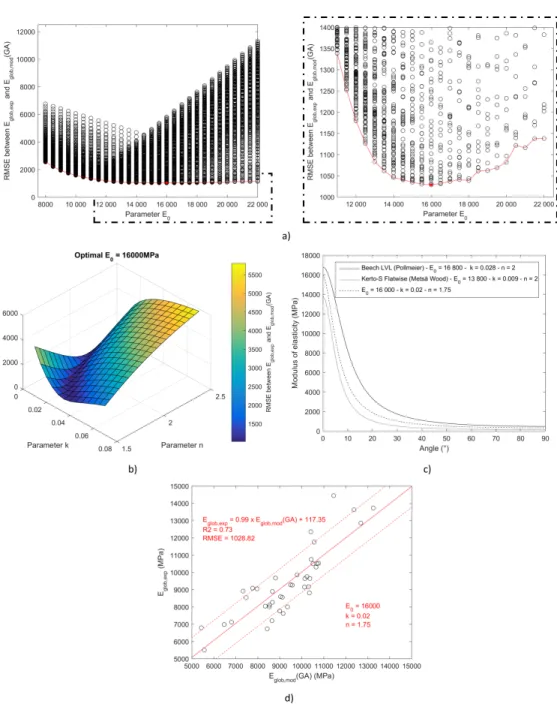
3.3.2. Model based only on grain angle Eglob,mod(GA)
262
The results of the different simulations for the model taking into account
263
only the grain angle measurement are presented in Figure 6. The Figure 6
264
(a) represents the RMSE between Eglob,exp and Eglob,mod(GA) on the basis
265
of E0 parameter. Each vertical set of points (at a given E0) represents the
266
total amount of simulation in which the k and n parameters vary. The
267
smallest RMSE is found for E0 = 16 000 MPa and the variation between
268
E0 = 14 000 and E0 = 18 000 MPa is quite low. The largest part of the
269
variation of the RMSE is due to the variation of the two other parameters
270
(k and n). The sensibility analysis of those parameters for the optimal E0
271
is presented in Figure 6 (b). The minimum of the RMSE is reached for k
272
= 0.02 and n = 1.75, it can be noted than other sets of these parameters
273
give similar results. The Figure 6 (c) shows the comparison in terms of MOE
274
variation according to grain angle for the optimal parameters compared to
parameters declared by two commercial LVL producers (beech LVL from
276
Pollmeier and Kerto-S tested in flatwise from Mets Wood). The ratio k is
277
equal to 16800470 = 0.028 for beech LVL and 1380130 = 0.009 for Kerto-S. The n
278
parameter is taken equal to 2 in accordance with EN 1995. The influence
279
of the grain angle seems to be much larger according to this comparison at
280
least in the case of beech LVL produced by Pollmeier. This could be due
281
to the fact that the grain angle deviation in the present study is mainly
282
caused by the presence of knots. Thereby, in the vicinity of knots, diving
283
angle is probably also present which induce an even higher reduction of the
284
mechanical properties. Also, the contribution of the shear modulus is not
285
taken into account in this formula and could lead to a virtual decrease of
286
the n parameter. Those facts could explain why an higher influence of the
287
grain angle is found by the optimization process. The optimal parameters are
288
anyways consistent within the comparison given in Figure 6 (c). Finally, the
289
quality of the prediction using optimal parameters is presented in Figure 6
290
(d). The coefficient of determination is equal to 0.73, and the RMSE is equal
291
to 1028.82 MPa which indicates the efficiency of grain angle measurements
292
in order to predict mechanical properties of LVL.
Figure 6: a) Sensibility analysis for E0 parameter, b) sensibility analysys for k and
n parameters, c) relevance of the different parameters and d) prediction results for Eglob,mod(GA)
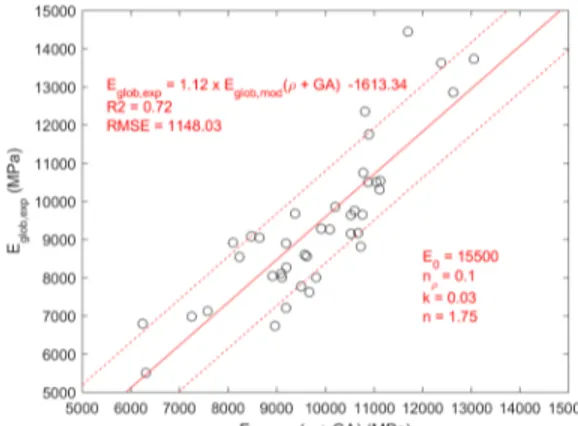
3.3.3. Model based on density and grain angle Eglob,mod(ρ + GA)
294
The results of the developed model taking into account both the density
295
and the grain angle is given in Figure 7. The coefficient of determination
296
between Eglob,exp and Eglob,mod(ρ + GA) is equal to 0.72 and the RMSE to
297
1148 MPa. Those results are actually lower than in the case of Eglob,mod(GA).
298
Since the result depends on four parameters it is difficult to plot the influence
299
of the different parameters. The optimization sets the nρ parameter close to
300
0 when the grain angle is part of the input data, which indicates the low
301
influence of the density. The part of the equation modeling this dependency
302
only represents a variation of less than 300 MPa for the studied batch of
303
panels when nρ = 0.1.
304
Figure 7: Prediction results for Eglob,mod(ρ + GA)
3.3.4. Potential of different methods to predict the modulus of elasticity
305
A summary of the correlation obtained between different measured or
306
calculated estimates and Eglob,exp is presented in Table 4. The analysis of
307
results reveals that the density is not a suitable predictor of the modulus of
elasticity of LVL made of beech. Indeed, the coefficients of determination
309
between Eglob,exp and respectively ρpanels and Eglob,mod(ρ) are both equal to
310
0.12. Even after taking into account the density differences in each ply and
311
modeling a 4-points bending test, the correlation is still rather low with a low
312
significance level. On the contrary, the coefficient of determination between
313
Eglob,mod(GA) and Eglob,exp is equal to 0.73, which is even better than the
314
coefficient of determination between Eglob,mod(ρ + GA) and Eglob,exp. Taking
315
both the density and the grain angle into account has not been proven to
316
be useful due to the low correlation existing between density and the global
317
modulus of elasticity.
318
The coefficient of determination between ¯Epanel and ¯Epanel−opti (which is
319
calculated in the same way as ¯Epanel but with the optimal parameters found
320
for Eglob,mod(GA)) and Eglob,expare respectively equal to 0.69 and 0.71. This is
321
slightly lower than the one between Eglob,mod(GA) and Eglob,expbut this rather
322
high correlation is an encouraging result to sort veneers in order to produce
323
LVL made of beech. Indeed, these properties do not take into account the
324
layup or the type of loading and could easily be used in a production line
325
to grade and sort veneers. However, these results are based on 3-ply panels,
326
and the difference between the mechanical models and the simple averaging
327
might be higher in the case of LVL panels with a higher number of plies.
328
Indeed, in this case the plies in the outer part have a much higher influence
329
that the ones in the inner part, which can only be taken into account with a
330
model such as the one described here.
331
The range of the obtained values and their coefficient of variation are
332
also described in Table 4. The closest range compared to Eglob,exp is found
for Eglob,mod(GA). The difference of optimizing the different parameters on
334
the coefficient of variation can also be seen : the coefficient of variation goes
335
from 7.5% to 12.6% for ¯Epanel and ¯Epanel−opti respectively. An improvement
336
in terms of coefficient of variation thanks to the modeling is also observable
337
: the coefficient of variation goes from 12.6% for ¯Epanel−opti to 18.3% for
338
Eglob,mod(GA). This coefficient of variation is really close to the one observed
339
for Eglob,exp (21.2%).
340
Statistics Correlation Parameters
Min Mean Max Std CV (%) R2 p-value E0 nρ k n
ρpanels 624.3 670.9 748.9 26.6 3.9 0.12 0.026 - - -
-¯
Epanel 8541.6 10657.5 12256.1 800.8 7.5 0.69 9.4E-12 16 500 0.7 0.07 2
Eglob,mod(ρ) 8171.1 9381.3 11545.3 711.3 7.6 0.12 0.027 20 000 1.9 -
-Eglob,mod(GA) 5441.6 9350.6 13252.8 1712.8 18.3 0.73 1.7E-12 16 000 - 0.02 1.75
Eglob,mod(ρ + GA) 6245.8 9818.1 13057.9 1511.9 15.4 0.72 2E-12 15 500 0.1 0.03 1.75
¯
Epanel−opti 7488.9 11128.1 13841.6 1398.4 12.6 0.71 5E-12 16 000 - 0.02 1.75
Eglob,exp 5504.1 9348.8 14442.6 1985.9 21.2 - - -
-Table 4: Summary of the relationship between measured or calculated properties and Eglob,exp
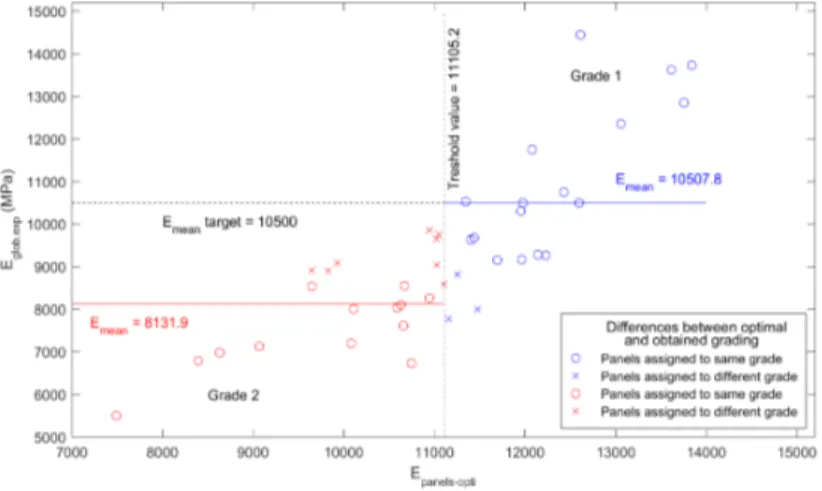
3.4. Grading LVL panels according to grain angle
341
In order to evaluate the potential of this method to grade LVL panels,
342
a grading method inspired by the method used to perform strength grading
343
of solid timber [36] is presented in Figure 8. Unlike in the case of solid
344
timber where the characteristic bending strength and density need to fulfill
345
requirements, in this case, only the average modulus of elasticity is considered
346
as a required parameter to reach a grade.
The proposed method to grade LVL is based on finding threshold values
348
on predictive properties ( ¯Epanel−opti in this case); such that panels have an
349
average modulus of elasticity higher than a given value (10 500 MPa in this
350
case). To assess the efficiency of the grading, it is necessary to perform
351
an optimal grading made on the basis of the modulus of elasticity obtained
352
during the mechanical tests. In this case, the grading is done by sorting the
353
values of modulus of elasticity in ascending order and removing the lowest
354
values until the average modulus of elasticity of the remaining panels is higher
355
than 10 500 MPa. In this particular application grade 1 represents the higher
356
grade and grade 2 the lower grade.
357
Knowing the optimal grading and the grading obtained by this method,
358
it is therefore possible to assess the performance of this method. The results
359
show remarkable accuracy of the method; the yield obtained by the method
360
reach 51% compared to 58% obtained by the optimal grading for grade 1.
361
4. Conclusions
362
This study shows that it is possible to predict the modulus of elasticity of
363
LVL made of beech using local grain angle measurements. In addition, this
364
study demonstrates that the average density is not a good predictor of the
365
modulus of elasticity. Encouraging outcomes have been highlighted
consid-366
ering the sorting based on local grain angle measurements. This method can
367
be used to efficiently define different grades of LVL panels and to lower the
368
variability of the final product even for low grade LVL made of low quality
369
veneer. The results presented in this study are only based on three layer
370
panels subjected to flatwise bending. These results need to be extended to
371
LVL composed of much more layers solicited in both loading directions. In
372
particular, in edgewise bending the results need to be investigated. Indeed,
373
sorting the veneer could still lead to lower the variability within grades even
374
in edgewise but the prediction results could be less convincing. The results
375
should also be extended with more logs. For such an extent and to improve
376
the quality of the prediction, measuring the ultrasonic speed to take into
377
account MFA variation which is mostly a tree effect and a property inherent
378
to clear wood could be insightful.
379
Acknowledgments
380
The present study was financed by the company Fernand BRUGERE.
381
This study was performed thanks to the partnership build by BOPLI: a
382
shared public-private laboratory build between Bourgogne Franche-Compt
383
region, LaBoMaP and the company Fernand BRUGERE. The authors would
also like to thank the Xylomat Technical Platform from the Xylomat
Scien-385
tific Network funded by ANR-10-EQPX-16 XYLOFOREST.
386
References
387
[1] CEN, EN 14374 Timber structures Structural laminated veneer lumber
388
Requirements, 2005.
389
[2] I. Aydin, S. C¸ olak, G. C¸ olakoglu, E. Salih, A comparative study on
390
some physical and mechanical properties of Laminated Veneer Lumber
391
(LVL) produced from Beech (Fagus orientalis Lipsky) and Eucalyptus
392
(Eucalyptus camaldulensis Dehn.) veneers, Holz als Roh- und Werkstoff
393
62 (3) (2004) 218–220.
394
[3] M. Knorz, J. van de Kuilen, Development of a high-capacity engineered
395
wood product-LVL made of European Beech (fagus sylvatica L.), World
396
Conference on Timber Engineering 15 (2012) 19.
397
[4] S. Girardon, L. Denaud, G. Pot, I. Rahayu, Modelling the effects of wood
398
cambial age on the effective modulus of elasticity of poplar laminated
399
veneer lumber, Annals of Forest Science 73 (3) (2016) 615–624.
400
[5] M. Nazerian, M. D. Ghalehno, A. B. Kashkooli, Effect of wood species,
401
amount of juvenile wood and heat treatment on mechanical and
physi-402
cal properties of laminated veneer lumber, Journal of Applied Sciences
403
11 (6) (2011) 980–987.
404
[6] A. ¨Oz¸cif¸ci, Effects of scarf joints on bending strength and modulus of
elasticity to laminated veneer lumber (LVL), Building and Environment
406
42 (3) (2007) 1510–1514.
407
[7] G. Pot, L.-E. Denaud, R. Collet, Numerical study of the influence of
408
veneer lathe checks on the elastic mechanical properties of laminated
409
veneer lumber (LVL) made of beech, Holzforschung 69 (3) (2015) 337–
410
345.
411
[8] A. Rohumaa, C. G. Hunt, M. Hughes, C. R. Frihart, J. Logren, The
influ-412
ence of lathe check depth and orientation on the bond quality of
phenol-413
formaldehyde–bonded birch plywood, Holzforschung 67 (7) (2013) 779–
414
786.
415
[9] B. C. Bal, I. Bekta¸s, The effects of wood species, load direction, and
ad-416
hesives on bending properties of laminated veneer lumber, BioResources
417
7 (3) (2012) 3104–3112.
418
[10] M. Kili¸c, The effects of the force loading direction on bending strength
419
and modulus of elasticity in laminated veneer lumber (LVL),
BioRe-420
sources 6 (3) (2011) 2805–2817.
421
[11] R. R. de Melo, C. H. S. Del Menezzi, Influence of veneer thickness on the
422
properties of LVL from Paric´a (Schizolobium amazonicum) plantation
423
trees, European Journal of Wood and Wood Products 72 (2) (2014)
424
191–198.
425
[12] J. Viguier, B. Marcon, S. Girardon, L. Denaud, Effect of Forestry
Man-426
agement and Veneer Defects Identified by X-ray Analysis on Mechanical
Properties of Laminated Veneer Lumber Beams Made of Beech,
BioRe-428
sources 12 (3) (2017) 6122–6133.
429
[13] X. Wang, Flexural properties of laminated veneer lumber manufactured
430
from ultrasonically rated red maple veneer: a pilot study, US Dept. of
431
Agriculture, Forest Service, Forest Products Laboratory, 2003.
432
[14] C. Del Menezzi, L. Mendes, M. De Souza, G. Bortoletto, Effect of
Non-433
destructive Evaluation of Veneers on the Properties of Laminated Veneer
434
Lumber (LVL) from a Tropical Species, Forests 4 (2) (2013) 270–278.
435
[15] J. Pu, R. Tang, Nondestructive evaluation of modulus of elasticity of
436
southern pine LVL: Effect of veneer grade and relative humidity, Wood
437
and fiber science 29 (3) (2007) 249–263.
438
[16] F. de Souza, C. Del Menezzi, G. B. J´unior, Material properties and
439
nondestructive evaluation of laminated veneer lumber (LVL) made from
440
Pinus oocarpa and P. kesiya, European Journal of Wood and Wood
441
Products 69 (2) (2011) 183–192.
442
[17] A. Rohanov`a, R. Lagana, M. Babiak, Comparison of non-destructive
443
methods of quality estimation of the construction spruce wood grown
444
in Slovakia, 17th international nondestructive testing and evaluation of
445
wood symposium, Hungary, 2011.
446
[18] S.-Y. Wang, J.-H. Chen, M.-J. Tsai, C.-J. Lin, T.-H. Yang, Grading of
447
softwood lumber using non-destructive techniques, Journal of materials
448
processing technology 208 (1-3) (2008) 149–158.
[19] A. Hanhijarvi, A. Ranta-Maunus, G. Turk, Potential of strength grading
450
of timber with combined measurement techniques, Combigrade-project
451
VTT Publications 568 (2008).
452
[20] I. Br´emaud, J. Ruelle, A. Thibaut, B. Thibaut, Changes in viscoelastic
453
vibrational properties between compression and normal wood: roles of
454
microfibril angle and of lignin.
455
[21] J. G´erard, D. Guibal, S. Paradis, M. Vernay, J. Beauchˆene,
456
L. Brancheriau, I. Chˆalon, C. Daigremont, P. D´etienne, D. Fouquet,
457
P. Langbour, S. Lotte, M.-F. Th´evenon, C. M´ejean, A. Thibaut, Tropix
458
7 (2011).
459
[22] E. P¨ohler, R. Klingner, T. K¨unniger, Beech (Fagus sylvatica
460
L.)–Technological properties, adhesion behaviour and colour stability
461
with and without coatings of the red heartwood, Annals of forest
sci-462
ence 63 (2) (2006) 129–137.
463
[23] J.-D. Lanvin, Correspondance entre classes visuelles et classes de
464
r´esistance m´ecanique EN 338 pour le HETRE (Fagus sylvatica) de
465
France., Rapport comission fran¸caise BF 002 LBO/JDL/403/15/170
466
08/04/2015, FCBA (2015).
467
[24] P. Glos, J. Denzler, P. Linsenmann, Strength and stiffness behaviour of
468
beech laminations for high strength glulam, in: Proceedings Meeting,
469
Vol. 37, Edinburgh, Scotland, 2004.
470
[25] P. Glos, B. Lederer, Sortierung von Buchen- und Eichenschnittholz nach
471
der Tragf¨ahigkeit und Bestimmung der zugeh¨origen Festigkeits- und
Steifigkeitskennwerte, Tech. Rep. Bericht Nr. 98508, Institut f¨ur
Holz-473
forschung, Technische Universit¨at M¨unchen (2000).
474
[26] S.-P. Simonaho, J. Palviainen, Y. Tolonen, R. Silvennoinen,
Determina-475
tion of wood grain direction from laser light scattering pattern, Optics
476
and Lasers in Engineering 41 (1) (2004) 95–103.
477
[27] J. Nystr¨om, Automatic measurement of fiber orientation in softwoods
478
by using the tracheid effect, Computers and electronics in agriculture
479
41 (1) (2003) 91–99.
480
[28] J. Zhou, J. Shen, Ellipse detection and phase demodulation for wood
481
grain orientation measurement based on the tracheid effect, Optics and
482
lasers in engineering 39 (1) (2003) 73–89.
483
[29] A. Olsson, J. Oscarsson, E. Serrano, B. Kallsner, M. Johansson, B.
En-484
quist, Prediction of timber bending strength and in-member
cross-485
sectional stiffness variation on the basis of local wood fibre orientation,
486
European Journal of Wood and Wood Products 71 (3) (2013) 319–333.
487
[30] J. Viguier, A. Jehl, R. Collet, L. Bleron, F. Meriaudeau, Improving
488
strength grading of timber by grain angle measurement and mechanical
489
modeling, Wood Material Science & Engineering 10 (1) (2015) 145–156.
490
[31] A. Olsson, J. Oscarsson, Strength grading on the basis of high resolution
491
laser scanning and dynamic excitation: a full scale investigation of
per-492
formance, European Journal of Wood and Wood Products 75 (1) (2017)
493
17–31.
[32] J. Viguier, D. Bourreau, J.-F. Bocquet, G. Pot, L. Bl´eron, J.-D.
Lan-495
vin, Modelling mechanical properties of spruce and Douglas fir timber
496
by means of X-ray and grain angle measurements for strength grading
497
purpose, European Journal of Wood and Wood Products (2017) 1–15.
498
[33] G. Kandler, J. F¨ussl, E. Serrano, J. Eberhardsteiner, Effective stiffness
499
prediction of GLT beams based on stiffness distributions of individual
500
lamellas, Wood Science and Technology 49 (6) (2015) 1101–1121.
501
[34] J. Oscarsson, E. Serrano, A. Olsson, B. Enquist, Identification of weak
502
sections in glulam beams using calculated stiffness profiles based on
lam-503
ination surface scanning, in: WCTE 2014, World Conference on
Tim-504
ber Engineering, Quebec City, Canada, August 10-14, 2014, Universit´e
505
Laval, 2014.
506
[35] R. Bergman, Z. Cai, C. Carll, C. Clausen, M. Dietenberger, R. Falk,
507
C. Frihart, S. Glass, C. Hunt, R. Ibach, Wood handbook: Wood as an
508
engineering material, Forest Products Laboratory.
509
[36] CEN, EN 14081-4 Strength graded structural timber with rectangular
510
cross section - Part 4: Machine grading — Grading machine settings for
511
machine controlled systems, 2009.