This is an author-deposited version published in: https://sam.ensam.eu
Handle ID: .http://hdl.handle.net/10985/11680
To cite this version :
Hortense LAEUFFER, Brice GUIOT, Jean-Christophe WAHL, Nicolas PERRY, Florian LAVELLE, Christophe BOIS - A model for the prediction of transverse crack and delamination density based on a strength and fracture mechanics probabilistic approach - In: ECCM17 - 17 th European Conference on Composite Materials, Allemagne, 2016-06-26 - European Conference on Composite Materials - 2016
A MODEL FOR THE PREDICTION OF TRANSVERSE CRACK AND
DELAMINATION DENSITY BASED ON A STRENGTH AND
FRACTURE MECHANICS PROBABILISTIC APPROACH
Hortense Laeuffer1,2, Brice Guiot2, Jean-Christophe Wahl2, Nicolas Perry3, Florian Lavelle1, Christophe Bois2
1CNES, 52 rue Jacques Hillairet 75612 Paris, France
Email: h.laeuffer@i2m.u-bordeaux1.fr, florian.lavelle@cnes.fr
2Univ. Bordeaux, I2M, UMR 5295, F-33400 Talence, France
Email: christophe.bois@u-bordeaux.fr, jean-christophe.wahl@u-bordeaux.fr,
brice.guiot@u-bordeaux.fr
3Arts et Metiers ParisTech, I2M, UMR 5295, F-33400 Talence, France
Email: nicolas.perry@ensam.eu
Keywords: transverse crack, delamination, fracture mechanics, in-situ microscopy
Abstract
The aim of this study is to provide a relevant description of damage growth and the resultant network for leakage prediction in liner-less composite vessels. A damage meso-model built on strength and energy criteria as proposed in FFM (Finite Fracture Mechanics) is introduced. Both criteria have to be fulfilled for the creation of the first transverse crack of the RVE (Representative Volume Element). The increase of crack density and the propagation of micro-delamination at crack tips are managed by Fracture Me-chanics using the energy release rate. In this way the effect of ply thickness is explicitly accounted. The energy release rate at the meso-scale (RVE scale) is calculated from a multiscale approach. Numerical results show that, in [02/901/02] and [02/903/02] lay-ups under tensile stress, no delamination should
occur for values of the energy release rates from the literature. This conclusion is reinforced by cross-section examinations through the width of specimens submitted to tensile loading. Delamination almost disappears after removing a few microns of the surface. Experimental results also highlight a preliminary step in the damage scenario with small cracking rate, likely driven by weak areas (defects locations). The modelling of this step being fundamental for the prediction of first leak paths, it was introduced through a probabilistic approach.
1. Introduction
Designing liner-less composite vessels for launch vehicles enables cost and weight savings at the same time, and is therefore a core issue for aerospace industry. One challenge of this application is to reach the permeability requirements with the composite wall itself. Pristine composite laminate meets the permeability requirement, but damage growth may occur for low thermo-mechanical loading cases, with very little effect on the stiffness. Transverse cracks and micro-delamination in adjacent plies may connect together (Fig. 1), resulting in a leakage network through the composite wall. The aim of this study is to provide a relevant description of damage growth and the resultant network at the meso-scale for leakage prediction. To do so a damage model based on Finite Fracture Mechanics is introduced. The model
100µm open crack
Figure 1. Transverse crack and delamination : crack network in two damaged plies and micrograph of one transverse crack with delamination at crack tip
applies for in-plane loadings and takes into account the effect of ply thickness, and mixed loading mode for transverse cracking. Viscosity, irreversible strains, and diffuse damage at the micro-scale (fibre matrix decohesion) are not modelled. It is assumed that damages of adjacent plies do not interact each other. In the second part of the paper, numerical and experimental results on [02/90n/02] lay-ups are discussed.
Finally variability is introduced thanks to probabilistic distributions of material properties. 2. Damaged model description
2.1. Damage variables
The meso-damage state of each ply of a laminate can be described by two damage densities, as illustrated in Fig. 2: the crack density ρ, which is the average number of transverse cracks over the observed length L, and the delamination length µ, which is the average length of delamination at each crack tip. The corresponding dimensionless variables are defined by:
the crack rate : ρ “ ρh “¯ n
Lh (1)
the delamination rate : ¯µ “ µρ “ µn
L (2)
where h denotes the ply thickness and n the number of cracks observed on the length L.
h= 0.26 mm Lobs µ1 00 900 00 µ2 µ4 µ3
Figure 2. Measurement of the crack density ρ and average delamination at crack tip µ in a [02/90/02]
lay-up
Experimental values of damage densities can be obtained by observation by optical microscopy or X-ray CT (Computed Tomography) as well. When used as damage variables in a model, they define the crack pattern which is commonly considered as periodic [1, 2].
2.2. Damage effect on the elastic properties
Damage effect on the elastic properties is modelled as a compliance increase ∆S , and numerically iden-tified by the multi-scale approach developed by Huchette et al. [2]. In practice,∆S has been computed using homogenization technique on a batch of RVEs (Fig. 3) defined by a large range of damage states p ¯ρ, ¯µq, and the response of ∆S was shown to be in the form of Eq. 4 and 5.
ε ´ εth“ S : σ “ ´ S0`∆S ¯ : σ (3) ∆S “ S ´ S0 “ ¯ρHp¯ρ, ¯µq (4)
where Hp ¯ρ, ¯µq is the tensor of damage effects and is written as: H p ¯ρ, ¯µq “ Hρ¯ 1` ¯ρH ¯ ρ 2` ¯µH ¯µ (5)
The components of the tensors of damage effect Hρ¯ 1, H
¯ ρ
2, and H
¯µ have been identified in [2] for the
material used in this study (namely, M21/T700), and are thus used herein as input parameters of the damage model.
Each tensor of damage effect Hρ¯
1, H ¯ ρ 2and H
¯µwas shown to be in the following form:
Hx y “ » – 0 0 0 0 h22xyS022 0 0 0 hxy66S066 fi fl with S0“ » — – 1 E1 ´ ν12 E1 0 ´ν12E 1 1 E2 0 0 0 2G121 fi ffi fl (6) h
(a) Diagram of the RVE (b) Finite Element Model of the RVE
We propose to build the evolution laws of the damage meso-model on strength and energy criteria as proposed in FFM (Finite Fracture Mechanics) [3, 4]. Both criteria have to be fulfilled for the creation of the first transverse crack of the RVE. The increase of crack density and the propagation of micro-delamination at crack tips are managed by Fracture Mechanics using the energy release rate. In this way the effect of ply thickness is explicitly accounted. The effect of damage on Helmholtz free energy at the meso-scale (RVE scale) is calculated from the multiscale approach introduced in the previous section [1, 2]. The energy criteria is built on the evolution of this free energy according to damage by defining related thermodynamic forces.
2.3.1. Thermodynamic forces
The thermodynamic forces yρ¯ and y¯µare conjugate to the damage variables ¯ρ and ¯µ and can be derived
from the Helmholtz free energyΨ “ 12σ : S : σ. By using the damaged compliance tensor defined in Eq.3 and 4, we obtain yρ¯and y¯µ:
yρ¯ “ BΨ B ¯ρ “ 1 2 „ σ : B B ¯ρ ´ S0`∆S ¯ : σ “ 1 2 ”´ hρ122¯ ` 2 ¯ρ hρ222¯ ` ¯µ h22¯µ ¯ S022σ222` ´ hρ166¯ ` 2hρ266¯ ` h66¯µ ¯ 2 S660 σ266 ı (7) y¯µ“ BΨ B ¯µ “ 1 2 „ σ : B B ¯µ ´ S0`∆S ¯ : σ “ 1 2ρ¯ ” h22¯µ S220 σ222` h66¯µ S660 2 σ212 ı (8)
2.3.2. Initiation and growth criteria
Damage initiation and growth requires that both energetic and strength criteria are verified. We propose to base the energetic criterion that drives crack propagation on Finite Fracture Mechanics. The Griffith criterion, illustrated in Fig. 4(a), is based on the variation of elastic energyΨ induced by the creation of new area of crack surface. This variation of energy have to be greater than the energy G required to propagate the crack:
∆Ψ “ G∆a (9)
where G denotes the energy release rate from the fracture mechanics and∆a the new surface of crack. As proposed in [4] for transverse crack propagation, this criterion can be extended to the creation of transverse crack by the equivalence between an increment of crack density d ¯ρ and the corresponding increment of crack area. The increment of crack area da for a unit volume is therefore defined by:
da V “ wh L dρ whL “ dρ¯ h (10)
This equivalence is illustrated in Fig. 4.
Then, criterion functions can be built by associating the thermodynamic forces to the energy required for creating the new surface of crack da in the volume element V. A critical energy release rate and the increment of crack surface area can then be defined for both damage variables.
When a criterion function is negative, there is no evolution of its associated damage variable. When the function becomes positive, damage growth occurs so that the equilibrium remains satisfied.
a ∆a
w (a) Centre Cracked Tension (CCT) specimen L ∆a w a h
(b) Laminate specimen with transverse cracks
Figure 4. Creation of a new area of crack surface in two types of specimens.
In addition to the energetic-criterion functions, the strength criterion for initiation is based on transverse and shear strain :
ˆε 22 εr 22 ˙2 ` ˆε 12 εr 12 ˙2 ´ 1 ě 0 (11)
Where εr22and εr12denotes the strength threshold for failure in mode I and II.
The three criteria have to be fulfilled, i.e. be positive or null to allow damage to initiate and propagate. If the criterion for propagation of delamination is not fulfilled while the two others are, transverse crack propagate alone.
2.4. Simulation results
Simulations were carried out on [02/901/02] and [02/903/02] lay-ups under tensile loading. Except for Gρ¯
and G¯µmaterial constants come from [1]. Fig. 5(a) show that no delamination occur for ratio of Gρ¯ and
G¯µ consistent with literature [5]. To allow delamination to occur (Fig 5(b)), the energy release rate for
delamination G¯µhas to be set to the half of Gρ¯. This point is discussed further in next section.
(a) Gρ¯“ G¯µ (b) Gρ¯“ 2G¯µ
Figure 5. Prediction of damage densities in the transverse ply of [02/901/02] and [02/903/02] lay-ups
for two sets of energy release rates Gρ¯ and G¯µ (ply thickness h “ 0.26 mm and h “ 0.78 mm, Gρ¯ “
The identification of this model relies on experimental observations of damage growth for cracking mode I and II. Tensile test were carried out on specimens polished on one edge so that transverse crack and delamination at crack tips could be identified with an optical microscope (Fig. 6). A length of 100 mm was observed for several loading cases, and tested layups were [0/90n/0], [+45/-45]sand [0
/+67.5/-67.52/+67.5/0]. Only [0/90n/0] results are presented in this paper. A specific protocol was applied for
the identification in order to bypass the issue of edge effects.
screen
positionning system microscope tensile test sample machine grips
Figure 6. Damage observation under tensile loading test 3.1. Results
The evolution of damage densities according to applied strain for two ply-thickness are presented in Fig. 7. Results highlight a preliminary step in the damage scenario with small cracking rate, likely driven by weak areas (defects locations). The modelling of this step being fundamental for the prediction of first leak paths, it was introduced in the evolution law through a probabilistic approach.
(a) Crack rate ¯ρ (b) Micro-delamination rate ¯µ
Figure 7. Damage densities vs longitudinal strain for [02/90/02] and [02/903/02] lay-ups (h “ 0.26 mm
and h “ 0.78 mm) obtained at the surface of the edge of the specimen
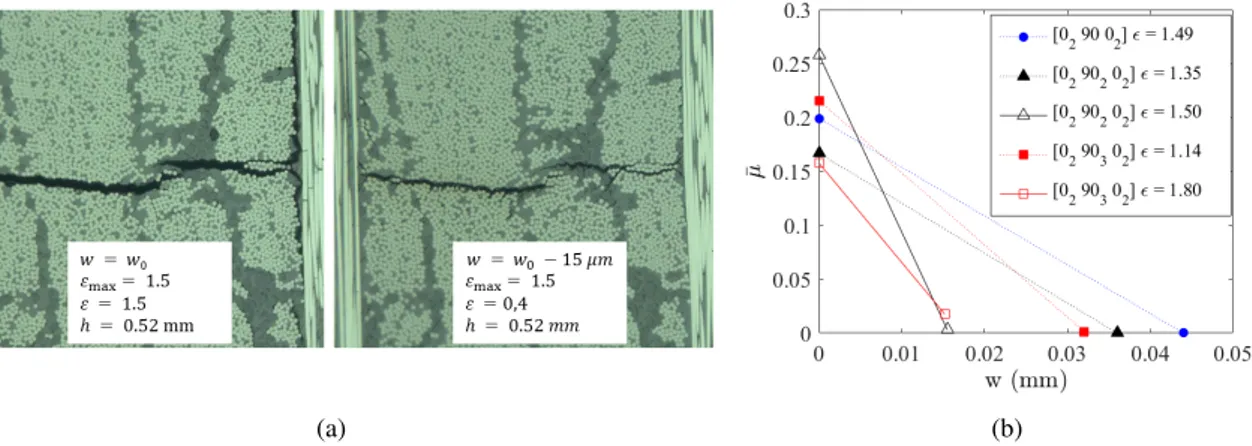
Fig. 8(a) shows the transverse crack and associated delamination at crack tips in the edge of the sam-ple before and after polishing (15 micron removed). Delamination clearly disappears after polishing. Fig. 8(b) presents the evolution of delamination densities before and after polishing for several ply thick-ness. Delamination densities are close to zero as soon as we move away from the edge. This experimental results agree with the model proposed above.
(a) (b)
Figure 8. Micro-delamination length ¯µ measured on the edge of the specimen at the surface (w “ w0)
and through the width w, 8(a): Micrographs before and after removing 15µm of the width, lay-up: [02/902/02], 8(b): Evolution of delamination density according to polishing depth (maximal applied
strain ε in %).
3.2. Introduction of the effect of variability
We propose to introduce variability in the model by running simulations on a set of values of the damage thresholds Gρ¯and εr22. The average response of the model is computed from the results for every possible
combination of the threshold values. A weight is assigned to each value, so that it is possible to take into account the density of probability of a threshold to take each value of the set. Results are presented on Fig. 9. Preliminary step in the damage scenario with small cracking rate is described even though that the density of probability was not accurately identified.
Figure 9. Crack rate for two ply-thickness with variability of the damage thresholds 4. Conclusion
A damage meso-model with strength and energy criteria was introduced. Evolution of damage densi-ties is managed by Fracture Mechanics using the energy release rates. Numerical results show that no delamination should occur for values of the energy release rates from the literature. This conclusion is reinforced by cross-section examinations through the width of specimens submitted to tensile loading: delamination almost disappears after removing a few microns of the surface. This confirms that standard identification techniques overestimate micro-delamination length. Experimental results also highlight a
locations). The modelling of this step was introduced applying variability on the damage thresholds. Confrontation of experimental and simulation results show a good ability of the model to describe the evolution of damage densities, although a more accurate identification of the damage parameters have to be performed.
Acknowledgments
The authors would like to thank the council of Region Aquitaine for their support. References
[1] Christophe Bois, Jean-Charles Malenfant, Jean-Christophe Wahl, and Michel Danis. A multiscale damage and crack opening model for the prediction of flow path in laminated composite. Composites Science and Technology, 97:81–89, 2014.
[2] C´edric Huchette. Sur la compl´ementarit´e des approches exp´erimentales et num´eriques pour la mod´elisation des m´ecanismes d’endommagement des composites stratifi´es. Phd thesis, Universit´e Paris 6, France, 2005.
[3] Pedro Ponces Camanho, Pere Maim´ı, and C. G. D´avila. Prediction of size effects in notched lami-nates using continuum damage mechanics. Composites Science and Technology, 67(13):2715–2727, 2007.
[4] Nicolas Tual, Nicolas Carr`ere, and Malick Diakhat´e. Multiscale model based on a finite fracture approach for the prediction of damage in laminate composites. In ICCM19, page xxx, Montr´eal, Canada, July 2013.
[5] Gina Gohorianu. Interaction entre les d´efauts d’usinage et la tenue en matage d’assemblages boulonn´es en carbone/´epoxy. Phd thesis, Universit´e Toulouse III, France, 2008.
![Figure 2. Measurement of the crack density ρ and average delamination at crack tip µ in a [0 2 /90/0 2 ] lay-up](https://thumb-eu.123doks.com/thumbv2/123doknet/7372223.214811/3.892.211.685.832.991/figure-measurement-crack-density-average-delamination-crack-tip.webp)
![Figure 3. Representative Volume Element for the identification of damage e ff ects [1, 2]](https://thumb-eu.123doks.com/thumbv2/123doknet/7372223.214811/4.892.160.759.599.1015/figure-representative-volume-element-identification-damage-ff-ects.webp)
![Figure 5. Prediction of damage densities in the transverse ply of [0 2 / 90 1 / 0 2 ] and [0 2 / 90 3 / 0 2 ] lay-ups for two sets of energy release rates G ρ¯ and G µ¯ (ply thickness h “ 0.26 mm and h “ 0.78 mm, G ρ¯ “ 0.13 MPa.mm).](https://thumb-eu.123doks.com/thumbv2/123doknet/7372223.214811/6.892.185.709.859.1054/figure-prediction-damage-densities-transverse-energy-release-thickness.webp)
![Figure 7. Damage densities vs longitudinal strain for [0 2 /90/0 2 ] and [0 2 /90 3 /0 2 ] lay-ups (h “ 0.26 mm and h “ 0.78 mm) obtained at the surface of the edge of the specimen](https://thumb-eu.123doks.com/thumbv2/123doknet/7372223.214811/7.892.185.698.766.974/figure-damage-densities-longitudinal-strain-obtained-surface-specimen.webp)