Université de Montréal
Pulvinar Modulates Contrast Response Function of
Neurons in the Primary Visual Cortex
par Jimmy Lai
École d’optométrie Faculté des études supérieures
Thèse présentée à la Faculté des études supérieures en vue de l’obtention du grade de Maîtrise
en Sciences de la Vision
option Sciences fondamentales et appliquées
Novembre, 2015
Résumé
Le pulvinar, localisé dans le thalamus postérieur, établit des connections réciproques avec la vaste majorité des aires visuelles corticales et il est ainsi dans une position stratégique afin d’influencer les processus de décodage de celles-ci. Les projections du pulvinar au cortex visuel primaire (V1) sont considérées comme étant des projections modulatrices, qui
modifieraient les réponses neuronales sans toutefois changer les propriétés de base des champs récepteurs. Dans la présente étude, nous avons étudié les réponses des neurones de V1 suite à l’inactivation réversible du complexe noyau latéral postérieur (LP)-pulvinar chez le chat. Des courbes de réponse au contraste ont été générées par la présentation de réseaux ayant plusieurs niveaux de contraste pendant l’inactivation du LP-pulvinar. Aucun changement n’a été
observé concernant l’orientation préférée ou la sélectivité à la direction des neurones de V1 lors de l’inactivation du pulvinar. Néanmoins, pour la majorité des cellules testées, l’amplitude de la réponse aux stimuli optimaux a été réduite. La fonction de Naka-Rushton a été appliquée aux courbes de réponse au contraste et l’analyse des effets de l’inactivation du pulvinar a montré une panoplie d’effets modulateurs : 35% des cellules ont présenté une réduction de leur réponse maximale, 11% ont eu une augmentation de leur C50, 6% ont montré une modulation de la pente et 22% des neurones ont présenté des changements dans plus d’un paramètre. Nos résultats suggèrent que le pulvinar module l’activité des neurones de V1 d’une façon dépendante du contraste et qu’il contrôle le gain des réponses des neurones des aires primaires du cortex visuel.
Abstract
The pulvinar, which is located in the posterior thalamus, establishes reciprocal connections with nearly all of the visual cortical areas and is consequently in a strategic position to influence their stimulus decoding processes. Projections from the pulvinar to the primary visual cortex (V1) are thought to be modulatory, altering the response of neurons without changing their basic receptive field properties. Here, we investigate this issue by studying V1 single unit responses to sine wave gratings during the reversible inactivation of the lateral posterior nucleus (LP) - pulvinar complex in the cat. We also studied the contrast response function of V1 neurons, before and during the inactivation of the LP-pulvinar complex. No change in the preferred orientation or direction selectivity of V1 neurons was observed during pulvinar inactivation. However, for the majority of the cells tested the response amplitude to the optimal stimulus was reduced. The contrast response function of neurons was fitted with the Naka-Rushton function and analysis of the effects of pulvinar deactivation revealed a diverse set of modulations: 35% of cells had a decrease in their peak response, 11% had an increase in their C50, 6% showed modulations of the slope factor and 22% exhibited changes in more than one parameter. Our results suggest that the pulvinar modulates activity of V1 neurons in a contrast dependent manner and provides gain control at lower levels of the visual cortical hierarchy.
Table of contents
Résumé ... i
Abstract ... ii
Table of contents ... iii
List of figures ... v
List of abbreviations ... vi
Acknowledgements ... viii
Introduction ... 11
Chapter 1 Background ... 12
1.1 Introduction to the Retinogeniculate Pathway ... 12
1.2 Receptive field properties ... 13
1.2.1 Structure of the Receptive Field ... 13
1.3 Organization of the Lateral Geniculate Nucleus ... 14
1.4 Organization of the Primary Visual Cortex ... 15
1.4.1 Laminar profile ... 18
1.4.2 Input from the Lateral Geniculate Nucleus ... 18
1.4.2 Temporal and Spatial Frequency ... 19
1.5 The Cat Visual Specificities... 20
1.6 The Lateral Posterior Pulvinar Complex ... 21
1.6.1 A higher order thalamic nucleus ... 22
1.6.2 Lesion studies... 23
1.6.3 Drivers and Modulators ... 24
1.6.4 Nature of the pathways involving the pulvinar complex ... 27
1.7 Contrast Perception ... 29
1.8 Aim of the study and hypothesis ... 30
Chapter 2 Methods ... 31
2.1 Animal Preparation ... 31
2.2 Histology ... 32
2.3 Electrophysiological Acquisition ... 32
2.5 Simultaneous Multi-unit recording and Reversible Inactivation of LP-Pulvinar ... 34
2.6 Data Analysis ... 35
Chapter 3 Results ... 39
3.1 LP-Pulvinar Responses during inactivation ... 40
3.2 Tuning properties of area 17 neurons after LP-Pulvinar inactivation ... 42
3.3 CRF changes ... 44
Chapter 4 Discussion ... 47
4.1 Contrast sensitivity... 47
4.2 Driver and Modulator impact ... 48
4.3 Attention as a mechanism for CRF modulation ... 50
Chapter 5 Summary and Conclusions ... 53
Works Cited ... 55 Appendix ... i Article ... i Abstract ... i Introduction ... i Protocol ... ii
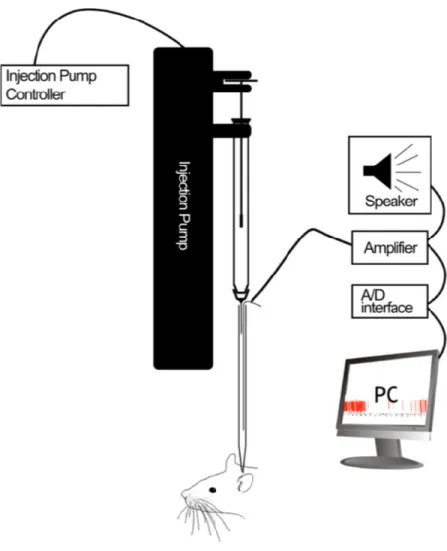
1. Assembly of the recording-injection pipette ... ii
2. Animal preparation ... iii
3. Filling and mounting of the injection system ... iv
4. Injection and reversible inactivation ... v
Representative Results ... v Figures... i Discussion ... iii Acknowledgments... vi Disclosures ... vi References ... i
List of figures
Figure 1: A schematic representation of receptive fields. ... 17 Figure 2: Organization of the retino-geniculo-cortical pathway and working model of the
pulvino-cortical pathway. ... 26
Figure 3: V1 responses to contrast fitted Naka-Rushton function. ... 38 Figure 4: Injection site verification. ... 41 Figure 5: An example of a direction tuning polar plot from a V1 neuron before injection. .... 43 Figure 6: CRF of a cortical neuron for control, injection, and recovery conditions. ... 45 Figure 7: CRF of a cortical neuron before, during and after LP-pulvinar inactivation. ... 45 Figure 8: Classification of changes in the CRF. ... 46
List of abbreviations
RF Receptive Field
LGN Lateral Geniculate Nucleus V1 Primary Visual Cortex RGCs Retinal Ganglion cells
TF Temporal frequency
SF Spatial Frequency
cpd Cycles per Degree
LPl Lateral Posterior- Pulvinar Complex (lateral zone) LPm Lateral Posterior- Pulvinar Complex (medial zone) CRF Contrast Response Function
PSTH Peristimulus time histogram
DI Direction Index
CV Circular Variance
Có công mài sắt có ngày nên kim.
Acknowledgements
I would first like to thank the Canadian Institute of Health Research (CIHR) for the grants that have been supporting my research. I would also like to thank the Fondation Yvon Boulanger for making this journey possible.
Thank you to my supervisor, Professor Casanova. Thank you for accepting me into your lab that I now call my second home every since my first year as an undergraduate. I remember how much curiosity and excitement I had that has continued to carry on ever since (with the frequent ups and downs). You have always inspired me to approach science like a child, with wonder and curiosity. Your intimidating, yet inspiring meetings have kept me on my toes. The time I have spent in your lab has been an honour and a privilege.
To Sebastien, thank you for being my teacher and mentor. I appreciate all your wisdom and guidance that you have provided me. Thank you Genevieve, for being my teacher from day one.
I would also like to thank fellow grad students who I was lucky enough to become friends with and whom I have shared many ups and downs with. Laurent, thank you for the learning experience while we spent many long nights trying to solve problems together. Marc-André, I’m glad to have worked with you. We went from trying to figure out why that damn injection system didn’t work to publishing a JoVE video. Thanks to Jeroen, I feel that we had a very short time to become very good friends. I enjoyed our beer adventures and scientific conversations. Your presence in the lab was very positive and you have been
missed. To Julie, sometimes I turn around on at my desk and expect you to still be there! You have always had a great attitude and some very funny lab stories to share. We have missed
you. To Robyn, thanks for all the morally uplifting things you have done over the course of my writing. Thank you to Thomas for our graduate student association and for our soccer team that I look forward to every week! I appreciate the advice you have given me during my writing process.
To the members of our lab, thank you Azadeh for your uplifting comments and encouragements during my unmotivated moments. Thanks to Reza for always having a creative joke ready for when we need it most. Bruno, we have grown to be good friends and shared some good times in the lab. You are hardest working person I know and I am certain all your efforts it will pay off. Thank you for all your helping and covering my back on the battlefield. Thank you Nelson for all you advice and encouragement. You are an abyss of ideas and enthusiasm.
To my parents, who sacrificed and endured so much for me to have the opportunity to do what I love. Thank you for supporting me, and for tolerating these long years of me as a student! Thank you for never giving up on me. You have encouraged me to pursue my dreams.
To my family, I thank you for your support and encouragements. It was often that I got asked “are you still in school?” at family gatherings and the answer was always “yes”. Thank you cô 5 for being there for guiding me through my childhood and for all your support during my studies. You were always there to give me good advice when I needed it. I also want to give a shout out to Lynn, Aileen and Kathleen for keeping me company virtually during my numerous all nighters of writing. And for keeping the family tradition of staying in
school for as long as possible. Thank you to Aileen for all the articles you were able to find for me through your university hookups.
Thank you Dr. Overbury, Dr. Khan for your extraordinary patience with me. I would also like to acknowledge the members of my review committee Dr. Bouchard and Dr. Lomber.
And finally, thank you to the most important person in my life, my better half, mon Cath. Merci pour ton patient extrême. Merci de m’encourager constamment, et pour avoir enduré mes études. Finalement, merci d’être mon autre cerveau, mais surtout, merci d’avoir toujours raison. Je t’aime.
Introduction
The sense of vision allows animals to interpret their environment through the
assimilation of light information. Vision is a highly complex process especially in humans, where a relatively large proportion of the brain is utilized for processing visual information. While it is the most studied sensory modality, visual perception leaves many alluring mysteries to be explored.
Researchers have been using primate and cat models to unlock the many questions of how vision works. It has allowed them to deeply explore the neural circuitry, molecular mechanisms and visual processes. Specifically, the cat visual cortex has been a model that has set the groundwork for vision science (Hubel & Wiesel, 1998) and helped paved the way for visual neurophysiology studies. To this day, the cat continues to be an important model for studying vision.
Chapter 1 will introduce important concepts relevant to this thesis. Chapter 2 will describe the methodological considerations for the animal preparation, visual stimulation, recording setup and data analysis. Then chapter 3 will detail the results found in this current study with data recorded in the LP-Pulvinar and in area 17. Chapter 4 will consider findings from other studies and discuss their implications regarding the larger picture of pulvinar function and its role in mediating and modulating visual processes in the visual cortex. Finally, in the last chapter, chapter 5, we summarize the findings and discuss the implications for future studies.
Chapter 1 Background
1.1 Introduction to the Retinogeniculate Pathway
The decoding of visual information begins as light enters the eye and lands on the retina, where photoreceptors (rods and cones) transduce photon energy into ionic currents. It is a process by which light is converted into electrical signals in the photosensitive cells of the retina. The number of rods far exceed the number of cones, which are packed densely in the central area of the retina called the fovea (Goodchild, Ghosh, & Martin, 1996). Rods are used for scotopic vision (vision under low light) and are very sensitive to scattered light, although they have low visual acuity (U. Stabell & Stabell, 1994; Wikler & Rakic, 1990). In contrast, the cone system has a high visual acuity and is used for photopic vision (vision under
illuminated conditions) and colour discrimination (Daw & Pearlman, 1969). Following phototransduction, visual information is further processed through a series of synaptic contacts, modulated by several retinal cells, before finally exiting the posterior of the eye through the optic nerve towards visual neurons in the central nervous system.
1.2 Receptive field properties
One fundamental feature of visual neurons is described by its receptive field (RF). The RF of a neuron is defined by the area of the sensory space in which visual stimulus will trigger neuronal activity. The RF structure becomes progressively more complex as sensory
information is moved through the visual system hierarchy, shaped by the integration of synapses at each level. For example, at the level of the retina, a population of bipolar cells connected to a single ganglion cell will shape and define the features of its RF, which is portrayed as a small cyclic region. RFs also have substructures, where stimulation of different parts of the receptive fields will yield different responses.
1.2.1 Structure of the Receptive Field
The RF of ganglion cells is built from the concentric arrangement of “on” and “off” responsive subfields. Cells described as “on” center cells will yield the highest firing rate when light hits the center of the cells RF, but at the same time inhibited when light hits the outer rim (Barlow, 1953; Hubel & Wiesel, 1961; Kuffler, 1953). Complimentary, an “off” center with “on” periphery RF has exactly the inverse characteristics: the ganglion cell will be inhibited by light at the RF centre and excited by light within the surrounding concentric area. Essentially, on-center cells increase firing rate to luminance increments in the RF centre and off-centre cells increase their firing rate to luminance decrements (darkness) in the RF centre. Since the surrounding peripheral area of a RF is antagonistic to the center, most ganglion cells respond more strongly to small spots of light that is confined to their receptive field centers than to either large spots that cover the centre and partial surround or to uniform illumination it the visual field that covers both centre and surround.
1.3 Organization of the Lateral Geniculate Nucleus
When the optic nerve fibers reach the optic chiasm, their projections are divided such that a portion of the connections from each retina reach both hemispheres of the brain. More specifically, visual information from the nasal retinas is directed to the contralateral
hemisphere and visual information from the temporal retina is directed to the ipsilateral hemisphere. Prior to reaching the cortex, a first synapse occurs in the thalamus, a major sensory and motor signal relay (Hale, Sefton, & Dreher, 1979; Worgotter & Koch, 1991). A sub structure of the thalamus known as the lateral geniculate nucleus (LGN) receives the majority of retinal inputs and it modulates and relays this information out to the primary visual cortex, referred to as V1 in primates and area 17 and 18 in cats (Payne & Peters, 2001). In addition, projections from LGN also travel directly toward higher cortical areas (Sincich, Park, Wohlgemuth, & Horton, 2004).
In the cat, retinal ganglion cells (RGCs) are classified as either X- or Y- cells that differ in their morphology and response properties. LGN cells receive efferents from Y-cells characterised by fast-conduction axons whereas X-cells have slow conducting axons
(Humphrey, Sur, Uhlrich, & Sherman, 1985). The cat LGN is composed of three main layers A, A1 and the C-complex where and Y- cells are uniquely distributed (Colby, 1988). X-cells from the contralateral eye project mainly to layer A, with Y X-cells diverging to layers A and C-complex. Additionally, the spatial layout of ganglion cells in each retina is reflected in the layout of their terminating axons within LGN forming a retinotopic map within each layer of LGN (Sanderson, 1971). This forms a 2D representation of the visual image formed on the retina in such a way that the neighbouring regions of the image are represented by
1.4 Organization of the Primary Visual Cortex
As visual information continues onward to the primary visual cortex, there are two physiologically classified types of cells: simple and complex cells. Hubel and Wiesel first discovered neurons at this level in the visual system which possess elongated RFs that would respond to lines or bars. The elongated structure of the RF of simple cells allow them to respond preferentially to specific orientation of lines, this is called the “preferred orientation” (Hubel & Wiesel, 1962). This means that the cell will respond strongly to lines, bars or edges of a specific orientation, but not to the orthogonal orientation.
In cat area 17, a single simple cell will integrate multiple inputs of on- and off- center LGN cells to create the RF structure (figure 1). Additionally, the RF of each integrated on- and off-centre LGN cell partially overlap and are aligned (figure 1B). In other words, each simple cell sums input from LGN neurons with neighbouring RFs to build an elongated RF that is most responsive to elongated bars or edges (Hubel & Wiesel, 1962). Furthermore, having LGN cells with varied RF sizes will define the preferred width of which simple cells will respond to. A preferred width means that the cell will respond preferentially to a specific width of a bar or line, this is referred to as the preferred spatial frequency (SF).
Simple cells also innervate other neurons in the striate cortex, these cells are referred to as “complex cells” (Hubel & Wiesel, 1959). Their RF is a summation and integration of the corresponding RFs of numerous simple cells. Complex cells do not have a clear division of excitatory and inhibitory regions within their RF (figure 1C). Much like simple cells, complex cells are tuned to stimuli of specific orientations. In addition, some complex cells will
Hubel & Wiesel, 1959). For example, a cell will respond with brief burst of spikes when a bar moves across the RF in a specific direction, referred to as the “preferred direction” (Bishop, Coombs, & Henry, 1971). Additionally, complex cells will maximally respond to both white and black contrasts bars of a grating stimulus at the optimal orientation independent of where it is inside its RF (Gawne, 2000).
Essentially, the integration of RFs of LGN cells form the RFs of simple cells, and further integrated to form the RFs of complex cells. Simple and complex cells are not
uniformly distributed within the depth of the striate cortex. Simple cells can be found mainly in layer IV and VI, while complex cells are found in deeper layer V as well as superficial layers II and III.
Figure 1: A schematic representation of receptive fields. A) An LGN RF with on-centre,
off-surround constructed from one or more RGCs. B) The RF of a simple cell found in V1, formed from the aligned RFs of LGN. C) The RF of a complex cell usually found in
1.4.1 Laminar profile
The primary visual cortex is organized into six distinct layers that differ in cell packing densities, cellular morphology and connections. These layers are labeled I to VI, with layer I at the surface and layer VI being next to the white matter. The term supragranular layers refers to layers II and III while infragranular layers refer to layers V and VI. In primates, layer IV is also subdivided into IVA, IVB and IVC which are referred to as the granular layers (Callaway, 2003; Purves, 2012). Within V1, there are anatomically distinct types of cells called spiny stellate cells and pyramidal cells. Pyramidal cells are the most numerous types in the cortex with axons and dendrites that project throughout all cortical layers excluding layer IVC. Pyramidal neurons are the output cells of V1 conveying the visual information to higher cortical areas. In layer IVC, there are numerous spiny stellate neurons, whose dendrites and axons remain in this layer to form local connections.
1.4.2 Input from the Lateral Geniculate Nucleus
LGN neurons innervate the primary visual cortex or striate area through layer IV (figure 2A). The term “striate cortex” is derived from the dense stripe of myelinated axons that runs along layer IV where the axons from LGN terminate. Since these axons only
innervate the primary visual cortex, a division is noticeable by the disappearance of this stripe between the border of the primary visual cortex (V1) and secondary visual cortex (V2). In the cat cortex, this stripe is found in area 17 and 18. Axon terminals that end in layer IV will further establish connections to both the upper cortical layers II-III and the lower layers V-VI. The neurons in lower layers V-VI make connections to subcortical structures such as LGN and
pulvinar. Meanwhile, the upper layers II-III establishes connections with other cortical areas (lateral connections) (LeVay & Gilbert, 1976; Leventhal, 1979).
1.4.2 Temporal and Spatial Frequency
There are also additional qualities that help define the properties of the neurons in the visual cortex. The cortex is not only considered as a form analyzer but also as a spatial frequency analyzer. Thus, in studies involving vision, sinusoidal drifting gratings are frequently used to characterized the spatial and temporal selectivity of cortical neurons (Enroth-Cugell & Robson, 1984).
Visual cells in the cat respond preferentially to a specific rate or speed at which the stimulus moves across its RF. Complex cells tend to prefer faster moving stimuli than simple cells, and will only respond to bars moving at certain speeds. The preferred rate at which a stimulus is moving that will elicit a neuronal response is referred to as the “preferred temporal frequency” (Movshon, 1975). The temporal frequency (TF) defines the number of cycles that are completed per unit of time, expressed as cycles per second or Hertz (Hz). The majority of neurons in area 17 are temporally tuned to low frequencies (2 to 4 Hz), and less to higher frequencies (Movshon, Thompson, & Tolhurst, 1978).
Neurons can also be characterized by their preference to how fine or coarse the stimulus is presented in their RFs, referred to as “preferred spatial frequency” (Berardi, Bisti, Cattaneo, Fiorentini, & Maffei, 1982; Movshon et al., 1978). For a sinusoidal grating, the spatial frequency (SF) is represented as the number of cycles in one degree of visual angle, measured in cycles per degree (cpd). The range of the preferred spatial frequency for neurons
in area 17 range from 0.3 to 3 cpd. Both simple and complex cells in area 17 are not different in their distributions of the preferred spatial frequency, however, complex cells are on average slightly less selective for spatial frequency than simple cells (Movshon et al., 1978).
1.5 The Cat Visual Specificities
The cat visual system has many parallels to the human visual system, but also some differences as well. As with most predators, the eyes of cats are forward facing to allow better depth perception at the expense of field of view. Compared to humans, cats have a slightly larger visual field (200° vs 180°) and a narrower binocular visual field (Tumosa, Tieman, & Hirsch, 1982). Cats also have better scotopic vision than humans, due to their higher retinal rods counts (Steinberg, Reid, & Lacy, 1973). In contrast to humans, cats have no fovea, but instead possess a retinal area enriched in cones called “area centralis”. The increased number of rods also augments their ability to detect movements at a much higher rate than humans. However, the increased number of rods and the associated enhancements are accompanied by lower visual acuity and reduced colour perception.
As with primates, the cat visual system follows the same retinogeniculate pathways (Payne & Peters, 2001). LGN projections innervate layer IV of the primary cortex or known as area 17 and 18 of the cat. This area is subdivided into two sub layers IVA and IVB as opposed to three layers as seen in the primate striate cortex (Payne & Peters, 2001). Like primates, layer IVA is mainly composed of larger, less densely packed neurons while the deeper layer IVB is composed of smaller, more densely packed cells. For this reason, the terms striate cortex and cat area 17/18 have become analogous of each other. Of the visual
areas in the cat, area 17 is the largest, covering 300-400 mm2 of cortical surface. This area accounts for 1/3 of the total surface of the visual areas (Tusa, Palmer, & Rosenquist, 1978). Through architectural staining and electrophysiological methods by Tusa et al. (1978), there is a perfect arrangement between the extent of area 17 and the retinotopic representation in the contralateral visual field. This area contains the first order-transformation of the contralateral visual hemifield in which they are visuotopically organized.
1.6 The Lateral Posterior Pulvinar Complex
The pulvinar is a sub-nucleus of the thalamus and is positioned along the medial edge of the LGN. In mammals, the relative size of the pulvinar nucleus increases with brain complexity occupying a large volume of the thalamus. Although this thalamic structure has been identified in several species, several aspects of its function remains elusive.
Similar to the LGN, the contralateral visual field is represented topographically in the pulvinar (Berson & Graybiel, 1978; Guillery, Feig, & Van Lieshout, 2001). Each subdivisions within the pulvinar contain a representation of the visual space (Casanova & Savard, 1996b; Chalupa, 1991; Hutchins & Updyke, 1989). In the cat model, the LP-pulvinar (also called pulvinar complex) consists of at least three subdivisions: the lateral and medial parts of LP (LPl and LPm, respectively), and the pulvinar (Hutchins & Updyke, 1989; Updyke, 1983).
1.6.1 A higher order thalamic nucleus
Compared to LGN, much less is known about the circuitry of the pulvinar complex. Nevertheless, it has been established that it has extensive reciprocal connections with
practically every visual cortical area (Grieve, Acuña, & Cudeiro, 2000; Shipp & Grant, 1991). Studies show that the pulvinar complex receives its primary visual afferents from layer V of neurons in the primary visual cortex, and not from the retina (Boire, Matteau, Casanova, & Ptito, 2004; Raczkowski & Rosenquist, 1983), whereas LGN receives its cortical afferents only from layer VI of the primary visual cortex and none from layer V (Abramson & Chalupa, 1985; Gilbert & Kelly, 1975). The pulvinar complex also sends its projections to thalamo recipient layer I of the striate cortex where information can travel to neurons in infragranular layer V (Abramson & Chalupa, 1985). These reciprocal connections allow the pulvinar complex to act as an important relay in the visual pathway, handling visual information that have already been through some form of cortical processing at least once. For this reason, it is considered a higher-order nucleus as opposed to a first-order nucleus in the LGN, which receives its driving afferents from the retina and sends it for the first time to the cortex (Guillery, 1995; Sherman & Guillery, 1996).
Since the LP-pulvinar is driven by the visual cortex, its cell properties resemble those of cortical rather than subcortical neurons. Therefore, like cortical cells, LP-pulvinar cells have a preferred stimulus orientation and respond to complex stimuli such as global motion (Casanova & Savard, 1996a; 1996b). In addition, LP-pulvinar neurons have large RF compared to striate cortex cells, making it suitable for the intregration of numerous inputs. They also respond to moving textured patterns including a subset of cells that respond to moving plaids with pattern-motion responses (Casanova, Merabet, Desautels, & Minville,
1998; 2001). Thus, LP-pulvinar cells are able to integrate separate motion signals into one coherent moving perception; a level of computation that generally occurs in higher cortical areas (Grieve et al., 2000; Macchi, Bentivoglio, Minciacchi, & Molinari, 1996). This suggests that the pulvinar complex may play a part in the processing of information in combination with cortical areas.
1.6.2 Lesion studies
Further insight into the nature of the pulvinar complex are also revealed in lesion studies. Patients with lesions to the pulvinar complex are unable to bind and integrate information from stimulus features (Ward, Danziger, Owen, & Rafal, 2002). Other studies have also associated this area of the thalamus with a variety of other functions including visual salience, attention and visually guided movements (Casanova et al., 1998; Purushothaman, Marion, Li, & Casagrande, 2012b; Robinson & Petersen, 1992). The varied array of functions that are associated with the pulvinar complex is thus logically a reflection of the extensive connectivity of this thalamic nucleus and its interactions with many cortical areas. Yet, it is still challenging to associate an overall function to the pulvinar complex.
1.6.3 Drivers and Modulators
There are two main types of inputs that carry information to cortical and thalamic neurons and they are referred to as driver and modulator synapses. They each possess
distinctive characteristics and differ in function and strength of activation of the target neuron (Sherman & Guillery, 1998). Between the two types, drivers possess thicker axons with larger terminal boutons and produce synapse that activate ionotropic receptors resulting in a rapid postsynaptic effect. Inputs from these types of connections carry the main information to be relayed and define the fundamental pattern of activity of the recipient cell. Axons of RGCs innervating the LGN are good examples of drivers. In contrast, the thinner axons and small boutons of modulatory terminals activate slower metabotropic receptors, resulting in a slow and prolonged postsynaptic effect. These modulatory connections can alter thalamocortical information without significantly influencing the general pattern of the signal. The differences in function allows drivers to define the RF properties of postsynaptic cells alongside
modulators that alter the pattern of the transmission without significantly changing the main RF properties.
Fibers going from the cerebral cortex to the thalamus consists of both driver and modulatory connections. Terminals of drivers in the thalamus originate from layer V
pyramidal cells in the cortex, whereas modulator terminals typically originating form layer VI pyramidal cells (Sherman & Guillery, 1998). Evidence suggests that both driver and
modulatory corticothalamic terminals are likely to occur in all thalamic nuclei (Sherman, 2001). As a first order relay, the LGN possess only modulatory innervation from cortical areas (figure 2A)(Sherman & Guillery, 1996). Reversible deactivation of cortical areas results only in subtle changes in the response properties of LGN relay cells (Geisert, Langsetmo, &
Spear, 1981). On the other hand, the pulvinar complex, a higher order relay (figure 2) receives mainly driver afferents from layer V and projects modulatory connections back to layer I as illustrated in figure 2B. Inactivation of area 17 for example, results in reduced overall responsiveness of lateral LP without changing the response characteristics of the neuron (Casanova, Savard, & Darveau, 1997). In contrast to LGN, the pulvinar complex receives its driving afferents from many cortical areas including area 17, but despite having more sources from cortical areas, the pulvinar complex has fewer synaptic driver inputs than the LGN (Van Horn, Erişir, & Sherman, 2000; Wang, Eisenback, & Bickford, 2002). However, the pulvinar complex has a significantly higher number of modulatory inputs from cortico-thalamic
connections than the LGN (Van Horn et al., 2000; Wang et al., 2002). This functional dichotomy is characteristic of cortico-pulvinar connections, but the functional role of LP-pulvinar is still difficult to assess.
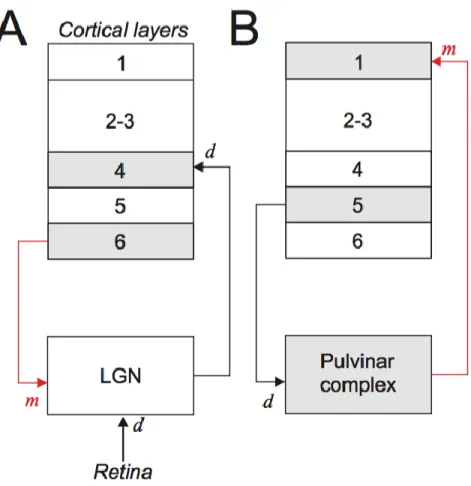
Figure 2: A. Established organization of the retino-geniculo-cortical pathway and working
model of the pulvino-cortical pathway. The retina projects a driver (d) input to the LGN, followed by d input to layer IV. B) Pulvinar exerts a modulatory (m) influence on layer I of V1 with reciprocal d connections.
1.6.4 Nature of the pathways involving the pulvinar complex
In the classical view, visual processing has a hierarchical structure. In the cat, visual information travels sequentially through about 20 visual cortices or levels of organization (Scannell, Blakemore, & Young, 1995). Incoming visual information to the primary visual cortex from LGN will be process locally within area 17, then transferred through the hierarchy of cortical areas, becoming more complex as information from lower areas is integrated in higher areas. RFs in higher cortical levels will code for progressively complex properties of the visual stimulus while also increasing in the RF size (Felleman & Van Essen, 1991). This model of cortico-cortical transmission among many functionally distinct areas along the visual hierarchy are referred to as feedforward connections and is generally accompanied by
reciprocal feedback projections from higher to lower areas. However, what is not considered in this classical approach is an alternate pathway with feedback and feedforward connections present between the pulvinar complex and the visual cortices (Guillery & Sherman, 2002). To uncover the role that the pulvinar complex plays in orchestrating information between the visual cortical areas, it is necessary to determine the distinction between drivers and modulator pathways in the transthalamic cortical pathways. To stay within the scope of this study, only the feedforward and feedback connections between the striate cortex and the pulvinar complex will be discussed.
As mentioned above, neurons in layer V of the striate cortex have axons that terminate in the LP-pulvinar complex. These terminations have morphological characteristics similar to that of retinogeniculate drivers (Bourassa & Deschenes, 1995; Ojima, Murakami, & Kishi, 1996). Because these thalamocortical synaptic terminals are similar to retinal terminals in LGN, it suggests that area 17 provides a driver input to the LP-pulvinar complex (Feig &
Harting, 1998). Additional evidence to support the idea of driver afferents from layer V is found in the fact that silencing area 17 will abolish or greatly diminish activity of cells in cat LPl (Casanova et al., 1997; Chalupa, 1991).
Next, the nature of the projections from the LP-pulvinar back to the striate cortex needs to be considered. The “the no-strong-loops hypothesis” states that a cortical area and a
thalamic nucleus cannot be reciprocally connected exclusively by driver connections,
otherwise the cortex would go into uncontrolled oscillations (Crick & Koch, 1998). Applying this hypothesis would suggest that the LP-pulvinar must project a modulatory afferent to layer I of area 17 (figure 2B) (Abramson & Chalupa, 1985). Contrary to this model, a recent study on primates demonstrate that a net inhibition in V1 occurred following lateral pulvinar inactivation (Purushothaman, Marion, Li, & Casagrande, 2012a). In this study, upon
inactivation of lateral pulvinar, the visually driven responses of V1 neurons were completely abolished. This net inhibition of layer 2/3 pyramidal cells was greatest at the preferred orientation to drifting gratings. Functionally, the strong impact of V1 by lateral pulvinar would suggest that there are driving feedback connections from the lateral pulvinar to the primary visual cortex, which does not support the anatomical evidence. Pulvinar complex projections to layer I of the striate cortex do not show terminal bouton sizes that are typical to driving projections (Li, 2015). Additionally having both feedforward and feedback
connections that behave like drivers would put it a state of uncontrolled oscillations (Crick & Koch, 1998). Taking into account the contradictions, it may be the case that other functional properties may influence the modulatory input of the pulvinar complex into the striate cortex. The transthalamic pathway via the pulvinar complex offers an alternate route for the
relay, the LP-pulvinar complex is thought to receive driver inputs from lower visual areas such as area 17, while providing modulatory feedback. However, as indicated by recent work in primates, it is possible that other properties may be involved in the modulation of V1 neurons. Contrast, is a putative mechanism in which the LP-pulvinar could be implicated on the
modulation of cortical processing.
1.7 Contrast Perception
Important information about the visual world includes differences in light levels or luminance relative to the mean. The ability to see these luminance differences or edges is important for visual form processing. The relative difference in luminance that makes an image distinguishable is called contrast; the greater this difference is, the greater the contrast. It is important to note that contrast depends on the difference in luminance from one area of the RF to another, and is independent on the amount of luminance (Bonds, 1991). In fact, the structure of the RFs as described above is well-organized for the detection of step edges in luminance. In other words, it is the contrast, and not luminance levels that is the relevant information that is transferred from the retina to the primary visual cortex.
In research, contrast sensitivity is used as a metric of visual function to compare different experimental conditions. The relationship between stimulus contrast and a cell’s response is represented by a sigmoidal shape of the contrast response function (CRF) as illustrated in figure 3A (Albrecht & Hamilton, 1982; Sclar, Maunsell, & Lennie, 1990). This nonlinear relationship expressed as a sigmoidal function, allows us to quantify changes in the contrast sensitivity of V1 neuron. In this study, we investigated the response of cells in area 17 to
varying contrast levels while inactivating LP. Changes in the different parameters of CRF represent contrast modulations and allows us to explore the influence of LP-Pulvinar on the perception of contrast.
1.8 Aim of the study and hypothesis
Our knowledge concerning the function of transthalamic pathways in vision remains rather obscure. Given its reciprocal connectivity with visual cortical areas, the pulvinar
complex is in a rather ideal position to relay and integrate information from lower- and higher- level cortical areas.
The aim of this study is to determine functionally the nature of the projections from the pulvinar complex to the primary visual cortex. We propose the hypothesis that the pulvinar complex provides a modulatory input to the primary visual cortex. To test this hypothesis, responses of area 17 neurons to drifting gratings will be recorded before, during and after the reversible inactivation of LP-pulvinar. Our results support the proposed hypothesis and indicate that LP-pulvinar modulates the contrast response of primary visual cortex neurons without altering the basic RF properties.
Chapter 2 Methods
2.1 Animal Preparation
Experiments were carried out on 8 healthy adult cats (2.5-3.5 kg) pre-medicated via subcutaneous injection of atropine (0.04 mg/kg) and Atravet (0.5 mg/kg). All animals were treated according to the guidelines of the Canadian Council on Animal Care. General anaesthesia was induced by inhalation of a 1:1 gaseous mixture consisting of oxygen and nitrous oxide with isoflurane. During surgical procedures, isoflurane was maintained at around 2% to 3% and was then interchanged with halothane at 0.5% to 1% during neuronal recording to prevent the depression of visual responses (Villeneuve & Casanova, 2003). Before placing the animal on the stereotaxic frame, a cannulation of the cephalic vein and a tracheotomy was performed. Lidocaine hydrochloride (2%) was injected subcutaneously at incision points. Once placed on the stereotaxic frame, the animal was paralyzed with a solution of gallamine triethiodide (10 mg/kg/h) through the cannulated vein and artificially ventilated with a gaseous mixture of nitrous oxide (70%) and oxygen (30%). The end-tidal CO2 partial pressure was monitored with a capnometer and kept constant between 35 to 40 mmHg by adjusting the volume and rate of respiratory pump. During the experiment, the animal was continually infused with 5% dextrose in a lactated Ringer solution and gallamine triethiodide. Electrocardiogram (ECG) was monitored and a feed-back controlled heating pad is placed under the animal to maintain its core temperature at 37.5C. Pupils were dilated using atropine drops (1%) and nictitating membranes were retracted with the application of phenylephrine hydrochloride drops (2.5%). The eyes were protected with contact lenses of appropriate refractive power.
2.2 Histology
Electrolytic lesions were performed at several locations along each successful penetration. At the conclusion of each experiment, the animals were euthanized via intravenous injection of Euthanyl (0.22ml/kg) and then perfused with a phosphate buffer solution followed by a fixative (4% paraformaldehyde). The brains were removed and fixed in a solution of buffered formalin (10%). Coronal serial sections (40μm thick) were cut using a cryostat. Half of the sections was stained for acetylcholinesterase (AChE) to identify LP-pulvinar subdivisions and the other half was Nissl stained to locate the lesions (Casanova et al., 1997). Under the microscope, each penetration was identified, and the location of neurons was determined in the cortex.
2.3 Electrophysiological Acquisition
To prepare for electrophysiological recordings, two craniotomies were made, one exposing area 17 and a second that allowed to reach the deeper structures of LGN and LP-pulvinar. For area 17, the craniotomy was performed at Horsley-Clark coordinates -5 to -9 along the anterior-posterior axis and +0.5 to +3 laterally. The craniotomy that allowed access to the thalamus was made at Horsley-Clark coordinates +5 to +7 along anterior-posterior axis and from +3 to +9. An electrode was lowered into area 17 with an angle of approximately 35 from the vertical axis. Vaseline was used to create a well to surround the craniotomies and was filled with saline with an agar cap to prevent dehydration of the cortex. Extracellular single spikes were recorded using a varnished tungsten microelectrode (H-J Winston, Clemons, North Carolina, USA, 2.0-3.0 MΩ). Recordings were acquired, amplified and
filtered using Alphalab Pro data acquisition system (Alpha Omega Inc., V4.11, Nazareth, Israel). Spike sorting and additional analysis were performed offline. Spikes were recorded at a sampling rate of 25Khz and band pass filtered between 300Hz to 6Khz. Local field
potentials were also sampled at 800Hz and band-pass filtered from 1 to 300Hz.
2.4 Area 17 recording and Visual Stimuli
The electrode was lowered slowly into area 17 until a visually responsive neuron is isolated. For each neurons, the RF was hand mapped by using an ophthalmoscope. All visual stimuli are generated with VPixx software, which was interfaced with DATAPixx (VPixx Technologies Inc) and were presented on a projector screen located 57cm from the eyes of the animal at a 60Hz refresh rate and a resolution of 1024x768 pixels. Each eye is stimulated monocularly via the dominant eye while the non-dominant eye is occluded. For each visually responsive cell, basic properties were measured using drifting sinewave gratings: optimal SF (tested between 0.05, 0.1, 0.3, 0.4, 0.8, 1.6 cpd) and TF (values tested: 0.5, 1, 2, 4, 8, 16 Hz), preferred orientation/direction, and CRF. The stimulus presentation itself lasted 2s, with a pre-stimulus and post-stimulus period of 1s each. The pre and post stimulations were blank presentations. The mean firing frequency was averaged across 6 repetitions.
At optimal direction, drifting sine wave gratings were presented at varying stimulus contrast levels to obtain a CRF. Optimal spatial and temporal frequencies ranged from 0.2-0.4 cpd and 2-4 Hz, respectively. Cellular responses were measured with pseudo randomly
changing stimulus contrast, which consisted of 7 contrast levels ranging from 3 to 100%. The baseline activity was expressed as the spiking activity during the presentation of a blank
stimulus with 0% contrast. Each contrast level was repeated 8 times to create a peri-stimulus time histogram (PSTH) of the neuronal response. Data acquisition was performed before, during, and after the inactivation of LP-Pulvinar, referred to as the control, injection, and recovery conditions, respectively.
2.5 Simultaneous Multi-unit recording and Reversible Inactivation
of LP-Pulvinar
Extracellular multi-unit recordings and injection of GABA in the LP-pulvinar were performed. First, cellular recordings from the LGN was performed and, based on the
coordinates of the receptive field, served as an anatomical reference point for targeting the LP-pulvinar. Using Horley-Clark coordinates +6 anterior-posterior and +9 lateral, a unipolar tungsten electrode was inserted. The electrode was lowered slowly (approximately 0.1 mm/s) while presenting full field flashes to a depth of approximately 12-13 mm where visually responsive neurons were found. The RF of LGN was mapped by hand using an
ophthalmoscope to determine and its location in the visual space was used to infer the electrode position and the accuracy of the stereotaxic coordinates. Retinal landmarks were determined by locating the area centralis as a reference point. Area centralis was identified by shining the light from an optic fiber onto the retina and marking its silhouette that was seen on the screen in front of the animal. Sub-regions of LP-pulvinar (LPl and LPm) were located using the known coordinates in LGN as a reference point. Extracellular multi-unit recordings in the LPl were made using a custom built injectrode containing a 20mM GABA solution stained with Chicago Sky Blue 0.5%. The injectrode allowed for simultaneous
electrophysiological recordings while delivering an inactivating agent within the same
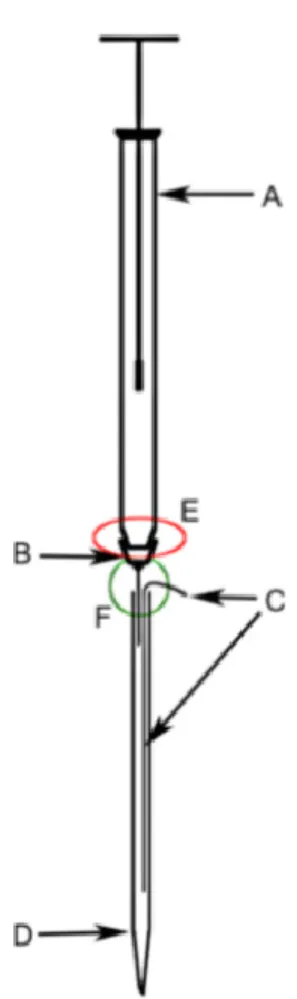
recording zone. See (Lai, Legault, Thomas, & Casanova, 2015) for details on the construction and preparation of the injectrode.
2.6 Data Analysis
Neuronal responses were analyzed using Matlab scripts (The MathWorks Inc, R2014b, Natick, Massachusetts, U.S.A). Spike detection was done using a threshold window followed by spike sorting via the Wavelet based Spike Classifier (WSC) method (Letelier & Weber, 2000). This method is based on the quantification of energy found in specific frequency bands at specific times during each spike profile to differentiate their features.
The orientation tuning curves were obtained using angular steps of 30. The response at each orientation was averaged over 2 seconds of drifting sine gratings at the optimal SF and TF for the specific neuron. Orientation tuning curves of each neuron were fit with Gaussian (von Mises function) using the least squares method as follows (Gao, DeAngelis, &
Burkhalter, 2010; Swindale, 1998):
𝑧 = 𝐵 + 𝐴1× 𝑒𝑘1[cos (𝑥−𝜙1)−1]+ 𝐴
2 × 𝑒𝑘2[cos(𝑥−𝜙2)−1]
where B is the baseline firing rate; A1 , A2 are amplitude of peaks; 𝜙1, 𝜙2are centers of the peak; k1 , k2 are tuning widths and 𝑒 is Euler’s constant.
The direction selectivity of visually responsive cells was quantified by computing a direction index (DI):
𝐷𝐼 = 1 −𝑟𝑒𝑠𝑝𝑜𝑛𝑠𝑒 𝑖𝑛 𝑡ℎ𝑒 𝑛𝑜𝑛𝑝𝑟𝑒𝑓𝑒𝑟𝑟𝑒𝑑 𝑑𝑖𝑟𝑒𝑐𝑡𝑖𝑜𝑛 − 𝑏𝑎𝑠𝑎𝑙 𝑎𝑐𝑡𝑖𝑣𝑢𝑡𝑦 𝑟𝑒𝑠𝑝𝑜𝑛𝑠𝑒 𝑖𝑛 𝑡ℎ𝑒 𝑝𝑟𝑒𝑓𝑒𝑟𝑟𝑒𝑑 𝑑𝑖𝑟𝑒𝑐𝑡𝑖𝑜𝑛 − 𝑏𝑎𝑠𝑎𝑙 𝑎𝑐𝑡𝑖𝑣𝑖𝑡𝑦
Units with a DI with less than 0.5 were classified as direction selective (Gur & Snodderly, 2007; Snodderly & Gur, 1995). Additionally, the bandwidth for direction tuning was defined as the full-width at half height above of the tuning curve.
To quantify the orientation selectivity of neurons, the circular variance index was used (Batschelet, 1981; Swindale, 1998). Circular variance is a global measure that provides an index of orientation selectivity ranging from 0 to 1 and is calculated as follows:
𝐶𝑉 = 1 −| ∑ 𝑅𝑘 𝑘exp(𝑖2𝜃𝑘) | ∑ 𝑅𝑘 𝑘
where 𝑅𝑘 is the response strength for the given direction 𝜃𝑘(in radians). The circular variance averages the responses for both directions of motion at each orientation. If the response is constant at all angles, then the neuron is not orientation tuned and CV = 1. If there is an increased response at only a certain orientation angle, then CV = 0. To clarify, CV is a global measure of the shape of the tuning curve.
Next, to quantify the contrast sensitivity of the recorded neurons, the responses to varying levels of contrast were fitted using the Naka-Rushton function, which has been previously used to fit CRFs of neurons in the visual cortex of cats (Sclar & Freeman, 1982). The CRF of each cell was fitted using the following equation (Naka & Rushton, 1966; Soma, Shimegi, Osaki, & Sato, 2012):
𝑅𝑚𝑎𝑥 = 𝐶𝑛 𝐶𝑛+𝐶
50𝑛 + b
where R is the neuronal response, C is the contrast level of the sine grating stimuli, and b is the baseline response. Additional parameters include the maximal response (Rmax), the
provide a reliable fit to CRFs from the cat visual cortex (Albrecht & Hamilton, 1982; Yang et al., 2008). Smaller values of C50 represents a higher level of contrast sensitivity of neurons. The exponent (n) determines the steepness of the CRF, thus larger values translate into steeper slopes. To quantify the changes in CRF, we define changes response gain as the ratio of the max response after LP inactivation (post Rmax) and the response before LP inactivation (post Rmax) and the changes in contrast gain as C50 after LP inactivation and C50 before LP
inactivation (Kohn & Movshon, 2003). Figure 3A illustrates a typical contrast response curve. Changes that can occur are discriminable based on the parameter that is affected: a peak response shift from Rmax (panel B), a horizontal shift from C50 (panel C), change in the slope from the exponential factor (panel D) and a vertical shift from baseline (panel E). To
determine which parameters were modulated, fitting parameters were compared from the control and injections conditions.
Figure 3: A) V1 responses to contrast were fitted using the Naka-Rushton function, where
Rmax is the peak response, C is the contrast of the grating, b is the baseline response, n is the exponent of the power function and C50 is the contrast value at ½ Rmax. B-E) Graphs
Statistical analysis was performed using the Statistical toolbox in Matlab (The MathWorks Inc, R2014b, Natick, Massachusetts, U.S.A). Comparisons between CRFs for each condition were made using an F-test to determine if there were significant changes. Linear regressions were used to evaluate the correlations between individual CRF parameters before and after inactivation of the LP-pulvinar. All comparisons with statistical data were made using the Student’s paired t-test when the data was normally distributed, otherwise the Wilcoxon signed rank test was used. To evaluate the presence of sub-populations within a scatter plot, k-means clustering was utilized. The Kolmogorov-Smirnov test was also used to test if the data was normally distributed.
Chapter 3 Results
To examine the effects of LP-Pulvinar on area 17 neuronal responses, single and multi-unit extracellular recordings of neuronal activity in area 17 was acquired before, during, and after inactivation of LP-pulvinar. For 54 visually responsive neurons, the preferred direction, optimal spatial and temporal frequencies were evaluated during each condition. Cells were often located between the granular and infragranular layers. Individual visual neurons were isolated off-line via spike sorting. The majority of cells recorded (70%) had a diminished response after LP-Pulvinar inactivation, while maintaining its orientation/direction tuning.
To examine the extent to which the contrast response curves were affected by LP-Pulvinar inactivation, the CRF for cortical cells during control, injection and recovery conditions were obtained, fitted with the Naka-Rushton function and the best fit parameters
were compared. LP-Pulvinar inactivation had diversified effects on the CRF of area 17 cells, often affecting more than one parameter of the Naka-Rushton function.
3.1 LP-Pulvinar Responses during inactivation
Utilizing the injectrode, LP-Pulvinar neurons whose receptive fields overlapped with area 17 receptive fields were isolated. Centrally located LP-pulvinar receptive fields were inactivated by infusing a small volume (0.4-0.8 l) of GABA (20mM) (figure 4A). Histological evidence shows a bleaching of the AChE staining indicating the presence of GABA injection. As shown in figure 4B, LP-pulvinar neuronal activity was greatly diminished during injection as compared to the post-injection recording. Approximately 1 hour after GABA delivery has ceased, LP-pulvinar showed an increase in neuronal activity. The reversible inactivation indicates that the injection did not cause damage to the local neurons.
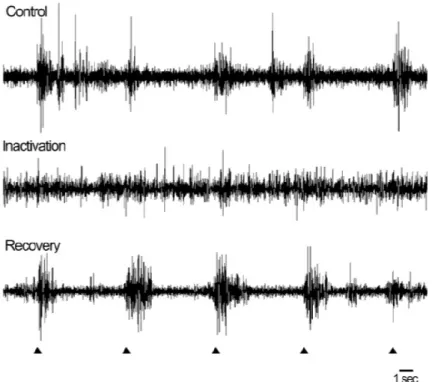
Figure 4: Injection site verification. For all experiments, Chicago Sky Blue Dye mixed with
the GABA solution was used to identify the anatomical position of the injection site; shown here as the bleached area. Coronal section stained for acetylcholinesterase (AChE) was used to delimit LPl and LPm nuclei. B) Extracellular recordings from the LPl before (top) and during (middle) and 60 minutes after (bottom) GABA induced inactivation.
3.2 Tuning properties of area 17 neurons after LP-Pulvinar
inactivation
Area17 neurons with receptive fields within 1 to 4 of area centralis were sampled using a tungsten electrode. Upon inactivation of LP-Pulvinar, 70% of tested V1 neuronal responses were diminished. An example of the visual responses from a unit in area 17 are shown as PSTHs and direction tuning polar plot in figure 5. At 50% stimulus contrast, LP-pulvinar inactivation had a suppressive effect, reducing the cellular response to a mean of 36% of the control response as shown in figure 5B. The same neuron was measured approximately 1 hour after the end of GABA injection, figure 5C shows a recovery in the spiking activity. For all cells tested, no difference in the preferred direction was found between control and injection conditions (mean DI: 0.05, p>0.05, Wilcoxon signed rank test). Also, no changes were found in the polarity of the tuning profile after inactivation of LP-pulvinar (mean CVs: control: 0.50, injection: 0.54, p>0.05, Wilcoxon signed rank test) as illustrated in figure 5D.
Figure 5: A) An example of a direction tuning polar plot from a V1 neuron before injection.
The PSTH below shows the spiking activity at the optimal direction. B) Response from the same neuron following injection of GABA. C) Data from the same neuron during recovery. D) A scatter plot of CV values during control and injection periods. As illustrated,
3.3 CRF changes
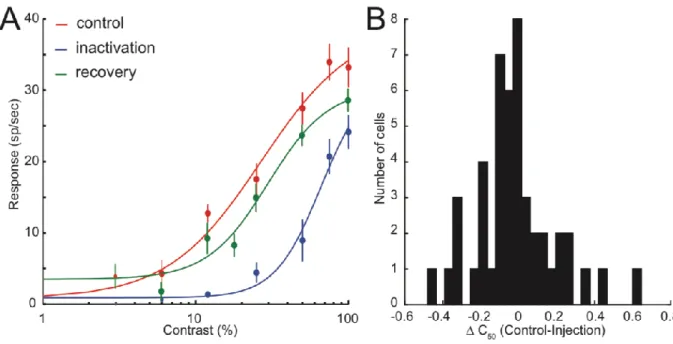
LP-pulvinar inactivation affected the CRF of 45 neurons of area 17 in infragranular layers. Comparing control and injection conditions, it was found that 13% of the affected neurons (6/45) showed an predominant increase in the C50 parameter which manifests as an overall shift in the CRF to the right as illustrated in figure 6A. However, not all cells displayed predominant change in the C50 parameter. Across all area 17 neurons, there were varying degrees of C50 changes or none at all. Figure 6B illustrates the degree of C50 changes across the measured population.
LP-pulvinar inactivation had other effects on individual contrast response curves such as Rmax decrease (figure 7A), and an increase in the exponent parameter (figure 7B). Neurons were quantitatively classified in terms of their most dominantly affected parameter. As illustrated in figure 8, among the 54 recorded cells, 35% were classified as Rmax decrease, 9% as Rmax increase, 6% were either increase or decrease in the slope, and 11% as C50 increase, with 22% as mixed. Mixed refers to cells that had multi-parametric changes and could not be classified since they did not have a predominantly modulated CRF parameter.
Figure 6: A) CRF of a cortical neuron for control, injection, and recovery conditions. B)
Histogram of the difference in C50 between control and injection.
Figure 7: CRF of a cortical neuron before, during and after LP-pulvinar inactivation. A)
Here, the effects of LP-pulvinar inactivation were predominantly characterized by a decrease in the Rmax parameter. B) Here, the effects of LP-Pulvinar inactivation were characterized by an increase in the exponent of the function (slope), but was also accompanied by a shift in C50.
Figure 8: Control and injection contrast response curves were statistically compared with a
F-test. For 83% of cells, the CRF was significantly changed by LP-pulvinar inactivation. Further classification was performed based on the parameters of the Naka-Rushton function that were predominantly affected.
Chapter 4 Discussion
In this study, we investigated the modulatory effects of LP-pulvinar on cat area 17 through electrophysiological extracellular recordings. It was found that inactivation of the LP-pulvinar would decrease spiking activity in the striate cortex while maintaining the basic properties of the cell such as direction selectivity, and spatio-temporal frequency preferences. Further, the degree of the reduction was dependent on the changes to the specific parameters related to the CRF of the neuron. We observed that weak firing rates in area 17 after LP-pulvinar inactivation were often associated with a peak response (Rmax) decrease and/or a decrease in the contrast sensitivity (increased C50). Below we consider the implications of these results in the context of previous literature and explore possible mechanisms.
4.1 Contrast sensitivity
Contrast sensitivity has been frequently studied in psychophysical and
electrophysiological studies (Buracas & Boynton, 2007; Ling & Carrasco, 2006a; Martı́nez-Trujillo & Treue, 2002; Saalmann & Kastner, 2009). In many of these studies, the
relationship between subject performance and contrast levels have been shown to be nonlinear. Responses plotted as a function of several contrasts are typically fitted with a psychometric function, one of which is usually several similar to several sigmoidal functions (Treutwein, 1995). Similarly, in our neurophysiological study, a sigmoidal function can be used to fit neural responses to changing levels of contrast providing parameters that allows us to quantify different properties, one of which being contrast sensitivity, a method that is used
in number of other neurophysiological studies(Duong & Freeman, 2008; Martı́nez-Trujillo & Treue, 2002; Williford & Maunsell, 2006; Yang et al., 2008).
In this study, the relation between contrast and neuronal responses are represented by a nonlinearity function, the Naka-Rushton function. The function produces four quantifiable parameters, three of which are contrast dependent (C50, Rmax, n) (Ling & Carrasco, 2006a). Specifically, shifts in the C50 parameter corresponds to changes in “contrast gain” or contrast sensitivity. Additionally, modulations of Rmax correspond to the peak response (asymptotic) at high contrast or “response gain”. Changes in peak response can be associated with alterations in firing rate of the neuron (Chirimuuta & Tolhurst, 2005). Finally, n is the exponent
parameter that determines the steepness of the function (slope), a parameter that is often disregarded in many other studies and merits consideration. Results in the current study indicate that inactivation of the LP-pulvinar modulates either one of the three parameters of the CRF to some degree or some combination of each. To further understand pulvinar complex function, we examined the impact of inactivating sub-regions of the pulvinar complex on cortical activity through changes in CRF.
4.2 Driver and Modulator impact
The duality of driver/modulator influence on area 17 from LP-pulvinar, plays an important role in determining its functional nature. In this study, inactivation of the LP-pulvinar produced diverse effects in the CRFs of area 17 neurons. In all cells, where visual responses were recorded, area 17 cells would always retain similar direction, SF and TF tuning properties before, during, and after injection. These tuning properties of the striate cortex are
defined by the convergent connections from the thalamus (Hubel & Wiesel, 1962; 1968). The findings in the present study show that inactivation of the LP-pulvinar yielded changes in neuronal activity, but the tuning properties were preserved as seen for orientation tuning in figure 5. The preservation of neuronal tuning properties and alteration in the contrast dependent responses seem to indicate that LP-pulvinar may not have the same gating properties as a first order thalamic nucleus such as the LGN. In fact, the results point in the direction of a modulator type influence for this pulvino-cortico connection. There were in rare cases in this study where certain area 17 cells (3/54) had both baseline and Rmax decrease during LP-pulvinar inactivation. The combination of both these types of effects, when it is robust, equate to an abolishment of V1 activity, reminiscent of a driver type influence.
The effects of LP-pulvinar inactivation have been examined in other species including prosimian primates (Purushothaman, Marion, Li, & Casagrande, 2012a). The prosimian study observed that inactivation of the lateral pulvinar prevented V1 neurons from responding to visual stimulation. Consequently, those results would indicate that lateral pulvinar connections to V1 possess robust influences suggestive of driver type terminals. As mentioned, this result is consistent with only a minority of cells measured in this study. However, we can also explain the effect, in part, by the shifts in CRF of neurons in the primary visual cortex. Since the result from the prosimian study was performed at a fixed contrast level of 50%, the results cannot account for V1 neural responses at higher contrast levels. For this study in the cat model, LP-pulvinar caused shifts in the CRF of area 17 neurons while its basic firing
properties were conserved, indicating primarily a modulatory influence. To further examine the function of LP-pulvinar, we explore a possible mechanism for CRF modulation.
4.3 Attention as a mechanism for CRF modulation
Although an abundance of visual stimulus reaches the retina, only a portion of the raw visual information is processed in the visual areas of the brain. Attention is a mechanism necessary for discriminating behaviourally relevant visual information in the environment for processing in order to respond to the stimulus in a relevant way. A neural coding model using psychophysics data has indicated that different changes in CRF parameters are correlated with specific types of attentional modulation (Pestilli, Ling, & Carrasco, 2009).
Two types of attentional mechanisms have been proposed that are involved in the task of stimulus discrimination (Chica, Bartolomeo, & Lupiáñez, 2013). The first is referred to as endogenous attention (voluntary attention) and occurs when attention is oriented to the relevant task of the observer. Endogenous attention allows us to monitor information at a given location and this allows the focus of attention to be controlled by the demands of the task. The second, exogenous attention (involuntary stimulus-driven attention) is considered to be reflexive and is caused by a sudden change in the periphery that grabs focus of the
observer. With respect to neural coding, it was found that the activation of the mechanism for endogenous attention had caused a leftward shift (a decrease in C50) of the CRF for area V4 and middle temporal visual area (Ling & Carrasco, 2006b). Interestingly, it was also found that the effects of exogenous attention changed both the maximal response (Rmax) and the contrast threshold (C50). Their findings suggest that endogenous attention operates through contrast gain mechanisms, while exogenous attention is best described as mix of both contrast gain and response gain (Ling & Carrasco, 2006a; Pestilli, Viera, & Carrasco, 2007).
There is simply too much information to be managed in real time by the brain, consequently, attentional mechanisms have evolved to allow the brain to select a fraction of sensory input for processing by higher level cognitive routines. The processing of attended stimulus leads to conscious awareness and voluntary actions to them, while the non-attended portion of the input is processed at a reduced bandwidth (Parks & Madden, 2013). Since the cats in this study were anesthetised and unconscious, visual information is processed in a passive manner without attention. This study has revealed that inactivation of areas in LP-pulvinar yielded changes in the CRF of area 17 with the majority of neurons exhibiting changes in Rmax and C50 as shown in figure 8. The results found here for the changes in CRF during LP-pulvinar inactivation can be compared to the changes caused by attention in the study of Ling and Carrasco (2006b), in that they both showed response gain and contrast gain changes. However, here, inactivation of LP-pulvinar deceases Rmax whereas exogenous attention was shown to do the opposite, increase Rmax. Similarly, a small proportion of neurons had an increase in C50 and endogenous attention was shown to decrease C50. However, it is important to note that these changes were seen in different visual areas, the primary visual cortex versus higher visual area V4 and MT. Here we see that the LP-pulvinar is also able to modulate neuronal without the presence of attention, suggesting that the LP-pulvinar may have an important role in the global attentional network.
There are a number of studies that show that LP-pulvinar plays an important role in visual attention based on its widespread connectivity with the visual cortex. Although isolating a specific role that the pulvinar nucleus has in vision is currently an ongoing challenge, there is some evidence that the pulvinar nucleus may be important in isolating behaviourally relevant objects from surrounding distractors (Desimone, Wessinger, Thomas,
& Schneider, 1990; Martı́nez-Trujillo & Treue, 2002; Robinson & Petersen, 1992; Snow, Allen, Rafal, & Humphreys, 2009; Wimmer et al., 2015). Desimone et al. (1990)
demonstrated that the inactivation of the macaque pulvinar would manifest as impairments in the ability to visually discriminate stimulus from distractors. Similarly, lesions studies in humans have been reported to show that subjects with pulvinar lesions due to stroke, displayed signs of reduced visual discrimination ability in the contralesional field in the presence of distractors (Snow et al., 2009). These results indicate a functional role of the pulvinar in distinguishing visual targets from distractors (Robinson & Petersen, 1992). Although, there is also evidence from lesion studies that do not coincide with this idea, where subjects with pulvinar lesions displayed no impairments in their ability to discriminate stimuli from distractors (Danziger, Ward, Owen, & Rafal, 2001; 2004). Whatever the mechanisms of the pulvinar’s influence on attention, the pulvinar contributions to the functioning of the visual cortex are observed through the changes in the CRF.