2008-2009 Proposed Program Budget
Main Document
-La Antigua Guatemala, Guatemala
IICA/JIA/Doc.313 (07) Original: Spanish 26-27 July, 2007
Contents
I. INTRODUCTION ... 1
II. STRATEGIC GUIDELINES FOR THE 2008-2009 BIENNIUM ... 1
M MIISSSSIIOONN ... 1 V VIISSIIOONN ... 2 V VAALLUUEESS ... 2 P PRRIIOORRIITTIIEESSFFOORRSSTTRRAATTEEGGIICCAACCTTIIOONN ... 2 O OPPEERRAATTIINNGGFFRRAAMMEEWWOORRKK ... 5
III. RESOURCES OF THE REGULAR FUND ... 6
IV. ALLOCATION OF REGULAR FUND RESOURCES BY CHAPTER ... 7
V. ALLOCATION OF RESOURCES OF THE REGULAR FUND BY SCOPE OF ACTION ... 9
VI. PRIORITY ACTIONS FOR 2008-2009 ... 10
VII. ALLOCATION, BY STRATEGIC PRIORITY, OF REGULAR FUND RESOURCES FOR DIRECT TECHNICAL COOPERATION SERVICES ... 10
VIII. ALLOCATION OF REGULAR FUND RESOURCES BY MAJOR OBJECT OF EXPENDITURE ... 11
IX. USE OF QUOTA CONTRIBUTIONS ... 12
I.
Introduction
This document contains IICA’s proposed Program Budget for the 2008-2009 biennium.
The document is based on the 2006-2010 Medium Term Plan, approved by the Executive Committee at its Twenty-sixth Regular Meeting. The purposes of the 2008-2009 Program Budget are: i) to define the cooperation actions on which the Institute will concentrate its efforts to implement the strategic guidelines and priorities set forth in the 2006-2010 MTP; ii) to specify the Institute’s priority actions, the role of IICA in each priority action, the expected results and the performance indicators; (iii) to approve the financing for the biennium, based on both the quota contributions of the Member States and miscellaneous income; and, iv) to allocate Regular Fund resources (quota contributions of the Member States and miscellaneous income), taking into account the actions defined by the units of the Institute’s General Directorate.
II. Strategic Guidelines for the 2008-2009
biennium
In 2002, IICA began to implement a series of changes aimed at overhauling its administrative and technical operations. These changes can be grouped under five headings:
Support for the Member States in facilitating consensus and providing follow-up to the ministerial agenda for agriculture and rural life in the Americas through 2015: the AGRO 2003-2015 Plan of Action for Agriculture and Rural Life in the Americas.
Promotion of a new relationship with the Member States based on the implementation of a technical cooperation model that promotes participation, transparency, accountability and ongoing dialogue with the national
authorities and the main clients of the countries’ public and private sectors.
Transformation of IICA into a results-driven institution, for which an organizational structure has been developed based on a simpler and horizontal integrated management framework.
Promotion of the Institute’s operations based on the principles of financial prudence, accountability and transparency.
Implementation of a policy for managing human resources that makes it possible to attract and retain qualified personnel, create an environment for professional growth and personal satisfaction, and remunerate the staff equitably and fairly, within the limits imposed by the Institute’s financial situation.
The results achieved over the last five years, which the community of agriculture and rural life in the Americas regards as full of promise, show the course that the Institute needs to follow to consolidate and build on the reforms required to make it the institution of excellence for agricultural and rural development in the Americas. Consequently, the 2006-2010 Medium Term Plan is based on the strategic guidelines adopted by the Institute’s governing bodies with a view to achieving that objective.
Therefore, the 2008-2009 Program Budget is intended to help create the conditions needed to fulfill the commitments established in the 2006-2010 Medium Term Plan, based on the elements described below.
M
M
i
i
s
s
s
s
i
i
o
o
n
n
IICA is the specialized agency for agriculture and the rural milieu of the Inter-American System, whose purpose is to provide innovative technical cooperation to the Member States, with a view to achieving their sustainable development in aid of the peoples of the Americas.
V
V
i
i
s
s
i
i
o
o
n
n
To be the leading agricultural institution in the Americas and the partner of choice by virtue of the quality of the technical cooperation it provides in response to the needs of Member States, and its contributions to sustainable agricultural development, food security and rural prosperity.
V
V
a
a
l
l
u
u
e
e
s
s
IICA’s future actions in the hemisphere will continue to be based on its fundamental principles and values, as will be reflected in its internal policies and relations with the Member States and strategic partners. These are:
i. Social and environmental responsibility ii. Respect for diversity
iii. Partnerships to enhance impact iv. Leadership through excellence v. Adherence to rules and regulations
vi. Efficiency, transparency and financial prudence vii. Interdisciplinary approaches
viii. Teamwork
ix. Excellence in performance
x. Education and knowledge as underpinnings of technical cooperation
P
P
r
r
i
i
o
o
r
r
i
i
t
t
i
i
e
e
s
s
f
f
o
o
r
r
S
S
t
t
r
r
a
a
t
t
e
e
g
g
i
i
c
c
A
A
c
c
t
t
i
i
o
o
n
n
The 2006-2010 Medium Term Plan is designed to consolidate the new technical cooperation model, which is based on four interrelated and complementary components. The first is designed to facilitate consensus and monitor strategies, and includes the AGRO 2003-2015 Plan of Action and national and regional development strategies. The
second component concerns the commitment to promote the permanent monitoring of agriculture and rural life in order to update the biennial hemispheric agendas of the AGRO 2003-2015 Plan, and define national and regional strategies. The third calls for actions aimed at promoting greater coordination among international organizations, to enable them to provide more effective responses to the needs of the countries and articulate their respective activities. The fourth component comprises the direct technical cooperation services that IICA provides under its national, regional and hemispheric technical cooperation agendas.
In pursuing its vision and mission, IICA takes into account the challenges and opportunities of the global context, defining its strategic priorities for technical cooperation on which it focuses its efforts and resources. Institutional actions are established for each of the priorities and define the Institute’s sphere of action.
Depending on the nature and specific characteristics of the different processes and technical cooperation activities, and on the institutions, stakeholders and strategic partners involved in the process and the geographic level on which they operate, IICA uses ad hoc cooperation methods and instruments and performs different functions to achieve its results, the most important of which are as follows:
i. Organize and implement forums for reflection, dialogue and consensus building at the hemispheric, regional and national levels on critical issues related to agriculture and rural life in the Americas.
ii. Devise and propose to the Member States strategies, policies, plans, programs and projects for the development of agriculture and rural life.
3 iii. Devise and propose to the Member States institutional
models for the development of agriculture and rural life. iv. Devise and propose to the Member States conceptual
frameworks, methodologies, mechanisms, procedures and instruments for the design, planning, management, monitoring and evaluation of agricultural and rural development actions.
v. Reach agreement on, program and coordinate actions involving horizontal cooperation among countries, and support their articulation at the international level to enable them to share know-how and experiences and link up with institutions in other parts of the world with a view to enhancing their capabilities for the sustainable development of agriculture and the rural milieu.
vi. Gather, compile and analyze information about the state and performance of agriculture in general, and the thematic areas on which the Institute focuses, to support decision-making processes.
vii. Establish knowledge networks with the participation of partner international organizations and the Member States, to document and disseminate experiences with regard to good practices, and to design and implement training programs with a view to developing capabilities in the Member States for addressing critical issues related to agriculture and rural life.
viii. Set up and operate information and knowledge management systems, based on the new information and communication technologies, to disseminate information and knowledge and keep the Institute’s personnel and clients abreast of the chief developments related to the topics of concern to the Member States.
ix. To provide special cooperation to research and educational organizations, with a view to fulfilling the commitments assumed by the IABA with the Tropical Agriculture Research and Higher Education Center (CATIE) and the Caribbean Agricultural Research and Development Institute (CARDI).
Accordingly, IICA will focus its efforts and resources on the strategic priorities described below.
1.
Contribute to the repositioning of agriculture and rural
life and to a new institutional framework
To implement this strategic priority, two types of actions are being carried out. The first group of actions is designed to help reposition agriculture and rural life on the development agendas of the countries. The second supports the construction of a new institutional framework to help achieve the objectives contained in the Vision: sustainable agricultural development, rural prosperity and food security.
General objective: To contribute to the repositioning of agriculture and rural life and to a new institutional framework
Areas of concentration:
The generation and dissemination of information, for decision making by public and private actors in agriculture and rural life; and,
The promotion of the construction of a new institutional framework.
2.
Direct technical cooperation
Direct technical cooperation is being provided by focusing actions on five strategic priorities whose objectives and areas of concentration are described below:
2.1 Promoting trade and the competitiveness of agribusinesses
General objective: To support the efforts of the countries to take advantage of the benefits of trade opening and the establishment of free trade areas, through the development of competitive agribusinesses and the promotion of trade.
Areas of concentration:
Trade integration and trade agreements. Development of competitive agribusinesses.
2.2 Promoting the development of rural communities based on a territorial approach
General objective: To assist the countries in formulating
development strategies that focus on rural territories and promote prosperity in rural communities by generating employment and income, and reducing the gaps between rural and urban areas.
Areas of concentration:
Management of rural territories. Consolidation of family agriculture.
Promotion of opportunities for rural women and youths to participate in development.
Knowledge management for rural development.
2.3 Promoting agricultural health and food safety (AHFS)
General objective: To promote and support capacity building and
the modernization of agricultural health and food safety services, in an effort to improve the sanitary and phytosanitary status of member countries and thus enable them to compete more successfully in agrifood trade.
Areas of concentration:
Modernization of public agricultural health and food safety services.
Capacity building to promote the implementation and administration of sanitary and phytosanitary measures.
Emerging issues and emergencies. Food safety.
2.4 Promoting the sustainable management of natural resources and the environment
General objective: To support the efforts of the member countries to transform their institutions, with a view to managing the environment and natural resources in such a way as to ensure the sustainable development of agriculture and the rural milieu.
Areas of concentration:
Articulation of agriculture, trade and the environment. Integrated natural resources management for agricultural and
rural development.
Impact of global environmental changes on agrifood systems.
Promotion of good environmental management practices in agricultural and rural production.
5
2.5 Promoting the introduction of technology and innovation for the modernization of agriculture and rural development
General objective: To support the efforts of the member countries to modernize agriculture and enhance its contribution to economic, social and environmental development by promoting technological and institutional innovation policies and processes that will promote and facilitate the incorporation of new knowledge and technologies into agricultural production chains.
Areas of concentration:
A prospective vision of technology and innovation as they apply to agriculture.
Support for institutional modernization and the design of technology policies for the development and incorporation of technological innovations.
Strengthening of the hemispheric system for cooperation among countries in technological innovation for agriculture, and of its links with the international research system.
Promotion of information management to support technological innovation processes.
Biotechnology and biosafety.
Promotion of horizontal cooperation in agro-energy and bio-fuels.
Appendix 1 provides details of the general objectives and the areas
of concentration of each strategic priority. The specific objectives and lines of action for each area of concentration are also described.
O
O
p
p
e
e
r
r
a
a
t
t
i
i
n
n
g
g
F
F
r
r
a
a
m
m
e
e
w
w
o
o
r
r
k
k
This section presents the internal and external operating actions required to improve the internal structure and the way in which the
technical cooperation actions are to be implemented. These guidelines will make it possible to consolidate the progress made during the previous four years and sustain the momentum of the modernization process proposed for the period covered by the 2006-2010 Medium Term Plan.
Internally
Consolidate the new institutional structure in order to:
o Maintain a process of continuous improvement of the coordination among national, regional and hemispheric initiatives.
o Strengthen teamwork in the units and via networks, as a key action for generating the expected results and carrying out the Institute’s mission.
o Bolster technical coordination for strategic thinking and action.
Strengthen the performance management and evaluation systems.
Consolidate an integrated institutional information management system.
Consolidate the knowledge management process as an integral part of IICA’s institutional culture, in order to promote the Institute as a knowledge-based and capacity-building institution.
Maintain the emphasis on greater transparency and accountability in the Institute’s operations at the national, regional and hemispheric levels.
Consolidate the Offices in the Member States as information, technology and training centers.
Train and develop IICA’s human resources to meet the new challenges of the 21st century.
Externally
Respond to regional priorities while the Institution continues to be a hemispheric entity.
Further strengthen relations with the Member States by developing and then updating new national and regional agendas keyed to their priorities.
Strengthen relations with strategic partners at the national, regional and hemispheric levels.
Promote horizontal technical cooperation and the sharing of experiences among countries.
Appendix 2 provides details of the priority actions, expected and
performance indicators for direct technical cooperation, the repositioning of agriculture and rural life and the new institutional framework, and the management of cooperation, by unit.
III. Resources of the Regular Fund
The proposed 2008-2009 Program Budget calls for:
• Regular Fund resources to be concentrated on the priorities and guidelines defined in the 2006-2010 Medium Term Plan and the national, regional and hemispheric Technical Cooperation Agendas.
• Total of Member State quotas to remain unchanged, as they have since 1995.
• The adjustment of miscellaneous income to match the amount expected to be generated during the biennium.
• Requesting the use of US$1,000,000 from the Miscellaneous Fund, which, as of December 31, 2006, showed a balance of US$4,900,000.
• The use of the additional resources generated by the increase in the Regular Fund for the following:
o Resources for new hemispheric actions such agro-energy and bio-fuels and organic agriculture.
o Readjustment of the salary scale of International Professional Personnel, which has been frozen since 1994, by 3% in 2008.
o Resources for salary increases for local personnel in line with the evolution of the salary market in each country and the exchange rate of local currencies against the US dollar, the Institute’s official currency.
o Resources for renewal of infrastructure and equipment.
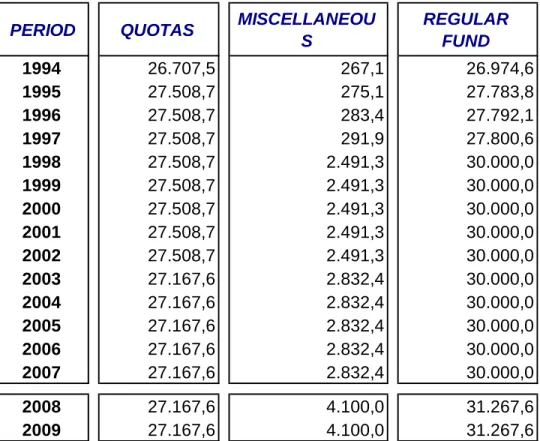
Table 1 shows the evolution of the budget of the Regular Fund in
recent years and the overall amounts proposed for the 2008-2009 biennium.
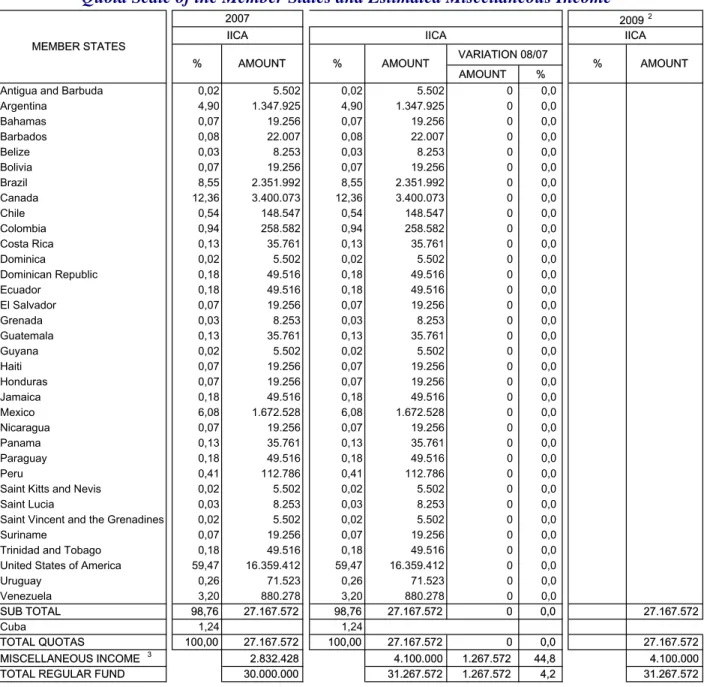
Table 2 show the proposed quota scale for the Member States, and
the estimated total amount of miscellaneous income and the use of the Miscellaneous Fund for the 2008-2009 biennium. This proposed quota scale is based on:
• The recommendation of the Executive Committee, calling for the full amount of Member State quotas to remain unchanged.
• An estimation of US$3,600.000 per year in miscellaneous income.
• The use of up to US$500,000 per year from the Miscellaneous Fund.
• A distribution, by percentage, of the Member State quotas, based on the resolution approved by the Executive Committee at its Twenty-seventh Regular Meeting, in which it recommended that the current IICA quota scale be maintained for 2008, pending the decision on the 2008 OAS quotas scale by the Thirty-seventh Regular Session of the OAS General Assembly; and that Special Advisory Committee on Management Issues (SACMI) make a
7 recommendation to the next Regular Meeting of the Executive Committee for adoption of the 2009 quota scale in accordance with the IICA Convention and applicable rules of procedures.
IV. Allocation of Regular Fund Resources by
Chapter
The Institute’s budget is divided into four chapters:
ο Chapter I: Direct Technical Cooperation Services ο Chapter II: Management Costs
ο Chapter III: General Costs and Provisions
ο Chapter IV: Renewal of Infrastructure and Equipment
Table 3 shows the proposed allocation of resources from the Regular
Fund for the 2008-2009 biennium, by Chapter. The 2006-2007 Program Budget is shown for purposes of comparison. At that time, there was no Chapter IV: Renewal of Infrastructure and Equipment.
Chapter I: Direct Technical Cooperation Services
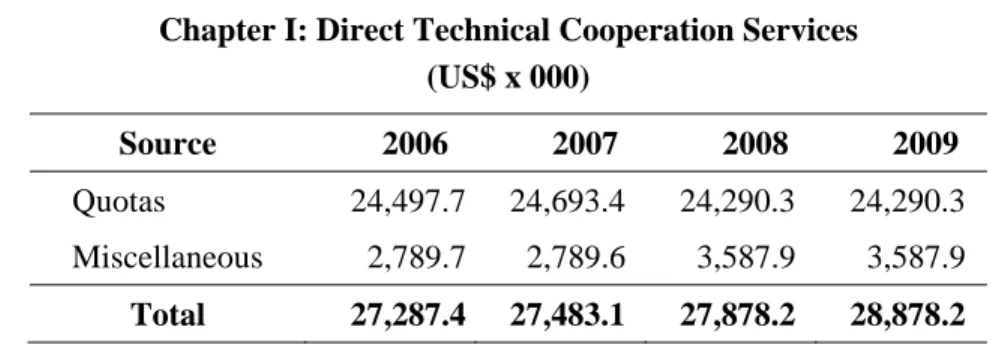
This Chapter contains the costs of the Institute’s technical cooperation actions at the national, regional and hemispheric levels required to achieve the objectives set in the Medium Term Plan. It includes IICA’s contribution to the Tropical Agriculture Research and Higher Education Center (CATIE). The resources allocated for this Chapter are as follows:
Chapter I: Direct Technical Cooperation Services (US$ x 000)
Source 2006 2007 2008 2009
Quotas 24,497.7 24,693.4 24,290.3 24,290.3 Miscellaneous 2,789.7 2,789.6 3,587.9 3,587.9
Total 27,287.4 27,483.1 27,878.2 28,878.2
With the inclusion of Chapter IV: Renewal of Infrastructure and Equipment for the first time, the resources allocated for the renewal of the infrastructure and equipment of the units responsible for technical cooperation were transferred to Chapter IV, reducing Chapter I. Furthermore, the increase in miscellaneous income results in an increase in the resources allocated to this Chapter.
Chapter II: Management Costs
Chapter II: Management Costs include the resources of the units responsible for managing the Institute and providing support services. These units, which are located at Headquarters, are the Office of the Director General and the Directorate of Administration and Finance. The resources that these units use to renew their infrastructure and equipment (Chapter IV) are not included. The resources allocated for this Chapter are:
Chapter II: Management Costs (US$ x 000)
Source 2006 2007 2008 2009
Quotas 1,574.4 1,378.6 1,292.5 1,292.5
Miscellaneous 42.7 42.8 82.8 82.8
Table 4 shows the allocation of the Regular Fund for 2008-2009 for
the units budgeted under Management Costs.
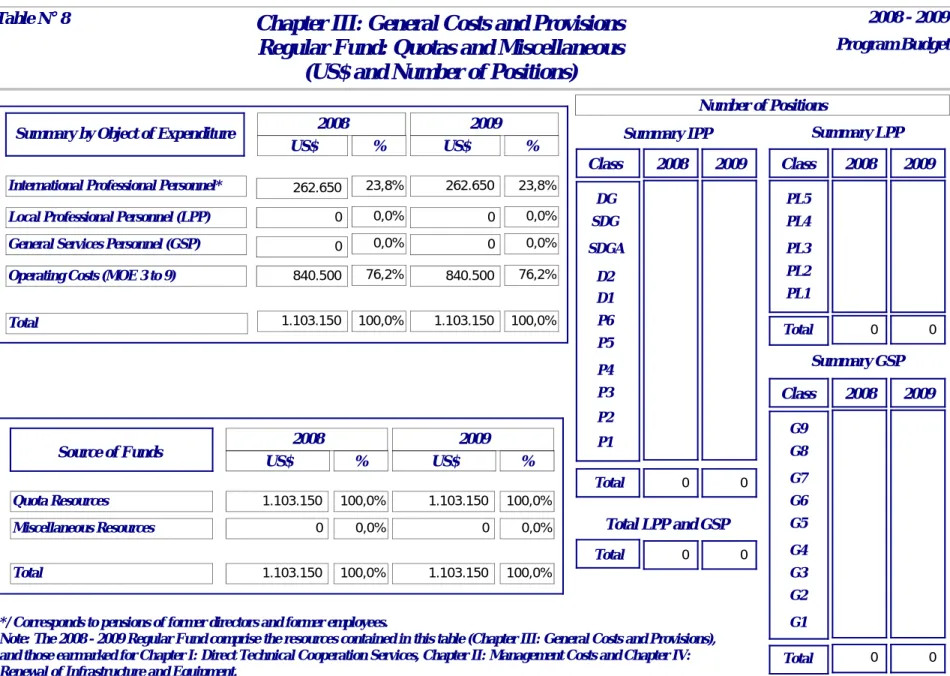
Chapter III: General Costs and Provisions
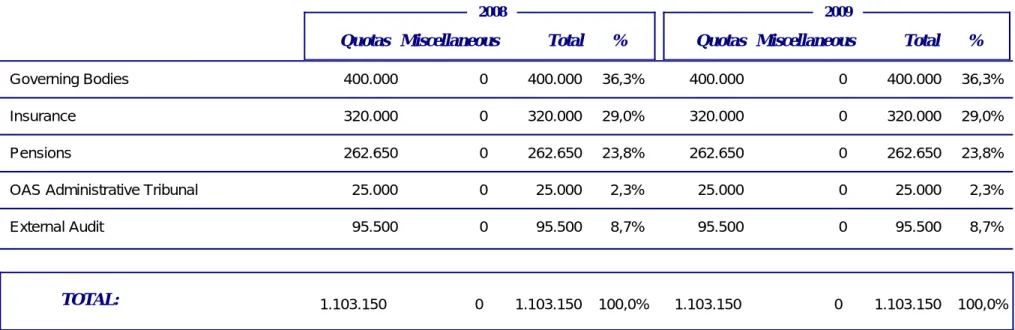
General Costs and Provisions are general commitments not directly related to the preceding chapters or to a specific Unit. They include support for the governing bodies, insurance, the OAS Administrative Tribunal, the external audit and the pensions of former Directors General and other former staff members. The resources for this Chapter include a slight increase in pensions for 2008 and a general increase for 2009. The figures are as follows:
Chapter III: General Costs and Provisions (US$ x 000)
Source 2006 2007 2008 2009
Quotas 1,095.5 1,095.5 1,103.2 1,103.2
Miscellaneous - - - -
Total 1,095.5 1,095.5 1,103.2 1,103.2
Table 5 gives a breakdown of the content of this Chapter for
2008-2009.
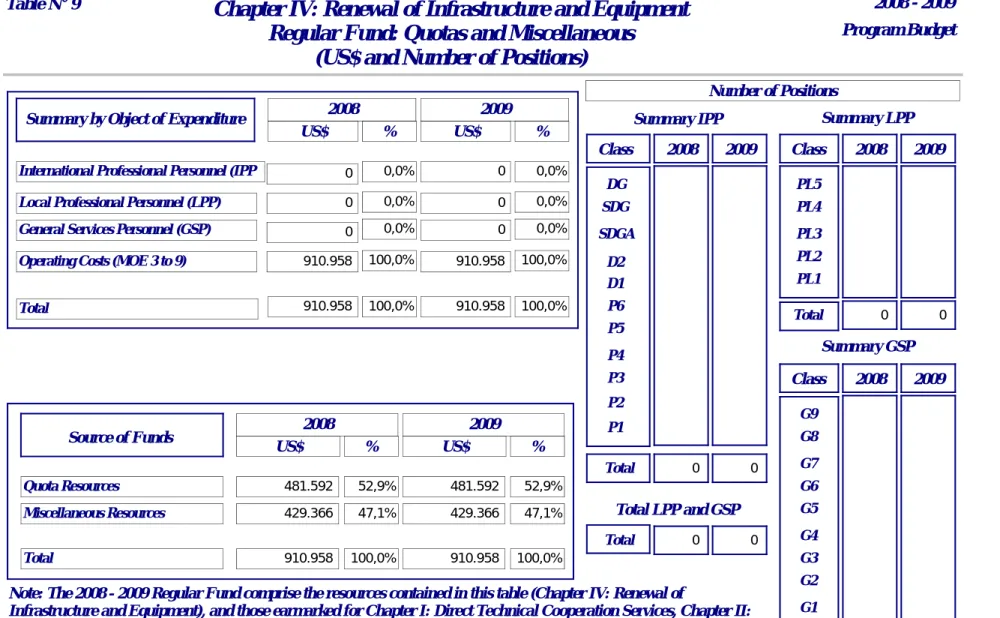
Chapter IV: Renewal of Infrastructure and Equipment
This Chapter is included for the first time. This action was approved by the IABA in resolution IICA/JIA/Res.415(XIII-O/05), at its Thirteenth Regular Meeting, held in Guayaquil, Ecuador. The budget items included in this Chapter are improvements to IICA-owned properties and buildings; the purchase of vehicles; the purchase of office equipment, communications, the reproduction of documents,
security, printing and field work; and the purchase of computer equipment and licenses.
The following amounts are programmed for the biennium:
Chapter IV: Renewal of Infrastructure and Equipment (US$ x 000) Source 2008 2009 Quotas 481.6 481.6 Miscellaneous 429.4 429.4 Total 911.0 911.0
In the judgment of the General Directorate, the Institute should continue to earmark resources for the renewal of physical and technological infrastructure, in an effort to make up for investments not made in recent years.
Personnel and Operating Costs, by Chapter
Tables 6,7, 8 and 9 show, for each Chapter: i) allocations by groups
of objects of expenditure (International Professional Personnel, Local Professional Personnel, General Services Personnel and Operating Costs); ii) the number of personnel positions, by category and class; and, iii) the sources of funding for each chapter.
Table 10 summarizes the data for the four Chapters, showing the
overall allocation of the Regular Fund by object of expenditure and the number of personnel by category and class.
9
V.
Allocation of Resources of the Regular Fund
by Scope of Action
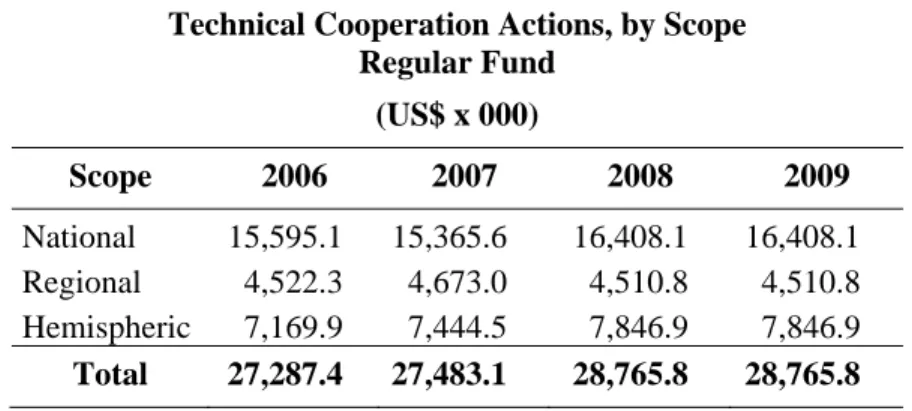
The allocation of resources of the Regular Fund for the units, programs and projects responsible for technical cooperation at the national, regional and hemispheric levels, which includes Chapters I: Direct Technical Cooperation and IV: Renewal of Infrastructure and Equipment of those units, programs and projects, are distributed as follows:
Technical Cooperation Actions, by Scope Regular Fund (US$ x 000) Scope 2006 2007 2008 2009 National 15,595.1 15,365.6 16,408.1 16,408.1 Regional 4,522.3 4,673.0 4,510.8 4,510.8 Hemispheric 7,169.9 7,444.5 7,846.9 7,846.9 Total 27,287.4 27,483.1 28,765.8 28,765.8
Table 11 shows the overall variations by scope of action between
2008-2007.
The corresponding allocation is based on the following:
• The amount of resources allocated for technical cooperation actions at the national level (see Tables 12 and 13) increases as the result of an increase in miscellaneous income.
• The amount of resources allocated for regional actions decreases due to the reclassification of PROCITROPICOS as a hemispheric action and the adjustment of the regional technical cooperation plans to bring them into line with the new 2006-2010 MTP.
Regional actions do not vary in 2009 from the level of 2008 (see
Table 12).
• The amount of resources allocated to hemispheric technical cooperation actions increases in order to carry out the mandates issued by the governing bodies with regard to topics such as biotechnology and biosafety, agro-energy and bio-fuels and organic agriculture (see Tables 12 and 18).
The country-by-country breakdown of the quota resources allocated can be seen in Table 13, with all countries receiving the same allocation as in 2007.
Tables 14, 15 and 16 show the allocation of the Regular Fund (quota
contributions and miscellaneous income) at the national, regional and hemispheric levels.
Table 17 shows the resources allocated to each Cooperative Project
and Project in Support of Integration for 2008-2009. It also shows the percentage variation between 2008 and 2007, none of which exceeds more or less 3.7%.
Table 18 shows the resources earmarked for special hemispheric
technical cooperation programs created by mandate of the governing bodies. This table shows the percentage variation between 2008 and 2007, with the only significant one being that of the Inter-American Program for the Promotion, Agribusiness and Food Safety, which decreases by 12.1% due to the elimination of an International Professional Personnel position. The Program is now operated by three international professionals, with support from four regional specialists in agribusiness development and five regional specialists in agricultural health and food safety.
VI.
Priority Actions for 2008-2009
The resources budgeted are based on the priority actions that will be carried out in 2008-2009, both for the technical cooperation and for management of cooperation.
Appendix 2 shows the priority actions, the role of IICA in each
priority action, the expected results and the performance indicators for each of the Institute’s operating units, both for technical cooperation actions, by strategic priority, and institutional management for technical cooperation. It also shows the resources allocated for each operating unit and their estimated distribution by strategic priority.
VII.
Allocation, by Strategic Priority, of Regular
Fund Resources for Direct Technical
Cooperation Services
As explained in section “II. Strategic Guidelines for the 2008-2009 biennium,” this proposal focuses the cooperation actions on one priority designed to help reposition agriculture and rural life and the renewal of its institutional framework, and on five strategic priorities for direct technical cooperation. The latter are: Promotion of Trade and the Competitiveness of Agribusinesses; Promotion of the Development of Rural Communities via the Adoption of a Territorial Approach; Promotion of Agricultural Health and Food Safety; Promotion of the Sustainable Management of Natural Resources and the Environment; and Promotion of the Incorporation of Technology and Innovation for the Modernization of Agriculture and Rural Development.
The resources allocated to each of the six Strategic Priorities comprise the amounts earmarked for:
• Hemispheric Technical Cooperation Actions.
• Institutional Funds and Line Items. • Regional Technical Cooperation Actions.
• The national actions programmed by each Office, by Strategic Priority, in accordance with the National Technical Cooperation Agenda agreed upon.
• Activities to provide Technical Support to Technical Cooperation Actions at the national, regional and hemispheric levels.
A breakdown of this information by Strategic Priority, for quota resources of the Regular Fund, appears in Appendix 3.
The resources of the chapter for direct technical cooperation services are distributed in both years as follows: 25.1% for trade and the competitiveness of agribusinesses; 21.6% for technology and innovation; 21.6% for agricultural health and food safety; 15.7% for the development of rural communities; 7.2% for natural resources and the environment; and 8.8% for the repositioning of agriculture and rural life and the renewal of its institutional framework.
Funds were allocated taking into account the agreements reached with the countries for responding to the National and Regional Agendas, and the mandates received from IICA’s governing bodies to address the issues on the Hemispheric Agenda.
Table 19 shows the allocation of the Regular Fund for each of the
Strategic Priorities. Table 20 shows the evolution by Strategic Priority since 2004-2005.
11
VIII. Allocation of Regular Fund Resources by
Major Object of Expenditure
The distribution of the Regular Fund by Major Object of Expenditure (MOE) for the 2008-2009 biennium is as follows:
2008 2009
Major Object of Expenditure US$ x 000 % US$ x
000 %
1. International Professional
Personnel 10,995.9 35.2 10,995.9 35.2 2. Local Professional Personnel
and General Services Personnel 8,114.5 26.0 8,114.5 26.0
Subtotal Personnel 19,110.4 61.1 19,110.4 61.1
3. Training and Technical
Events 929.2 3.0 929.2 3.0
4. Official Travel 1,888.4 6.0 1,888.4 6.0 5. Publications and Materials
and Inputs 1,209.2 4.9 1,209.2 4.9 6. Purchase of Property, Books,
Equipment and Furnishings 911.0 2.9 911.0 2.9 7. General Services 2,889.1 9.2 2,889.1 9.2 8. Performance Contracts and
Transfers 3,511.6 11.2 3,511.6 11.2 9. Other Costs 818.8 2.6 818.8 2.6
Subtotal Operating Costs 12,157.2 38.9 12,157.2 38.9
TOTAL 31,267.63 100.0 31,267.63 100.0
Considering that the Institute is a technical cooperation organization whose main strength is the knowledge of its personnel, the goal of the General Directorate is to achieve a ratio of 60% personnel costs to 40% operating costs. The ratio in 2008 and 2009 is expected to be 61.1% for personnel costs and 38.9% for operating costs.
Table 21 shows the proposed allocation of the Regular Fund by
Major Object of Expenditure for 2008-2009 and information about the amounts approved for the 2007 Program Budget.
Table 22 gives a breakdown for each major object of expenditure
(the items of which they are composed, in monetary and percentage terms) to make it easier to understand the purposes of each one. The cost of Major Object of Expenditure 1: International Professional Personnel includes an increase of 2.7% in 2008 over 2007, but with the same the number of positions (94). This is due to the proposed 3% increase in the international salary scale for that year, to offset part of the decline in salaries since 1994, when the scale was frozen. The cost of Major Object of Expenditure 2: National Professional Personnel and General Services Personnel shows an increase of 8.4% in 2008 over 2007, due to the hiring of 4 more Local Professionals, an increase in local salary scales in US dollars in 2006, and resources equivalent to 3% of the total cost of local personnel to cover variations in salaries in local markets and the dollarization or revaluation of local currencies against the US dollar in a large number of Member States.
Table 23 shows the evolution in the number of personnel financed
with resources from the Regular Fund.
With respect to operating costs, the changes in the allocation of resources for the 2008-2009 biennium, compared to 2007, are as follows:
• Major Objects of Expenditure 3 (Training and Technical Events), 4 (Official Travel), 7 (General Services), 8 (Performance Contracts and Transfers) and 9 (Other Costs) have the same relative importance in 2008 and 2009 as in 2007. The amounts are larger as a result of the increase in miscellaneous income, and in order to maintain purchasing power.
• Major Object of Expenditure 5 (Publications and Materials and Supplies) decreases from 4.7% of the Regular Fund in 2007 to
3.9% in 2008 and 2009. The allocation was reduced to bring it into line with the current structure of expenditures, which reflects lower costs for materials and printed publications.
• Major Object of Expenditure 6 (Purchase of Property, Books, Equipment and Furnishings, equivalent to Chapter IV: Renewal of Infrastructure and Equipment) increases from 2.4% of the Regular Fund in 2007 to 2.9% in 2008 and 2009. In monetary terms, the increase is US$200,500 in 2008 and practically the same amount in 2009. During the 2006-2007 biennium, this object of expenditure was bolstered by the approval of a Special Budget financed with resources from the General Subfund.
Appendix 4 shows the allocation of the Regular Fund by Major
Object of Expenditure for each of the Institute’s Units.
IX.
Use of Quota Contributions
The Institute’s priority activities at the national, regional and hemispheric levels are designed to produce results that benefit the Member States.
Table 24 provides a breakdown of the Institute’s quota budget at the
national level and the proportion that corresponds to each country for regional and hemispheric activities and for Management Costs, General Costs and Provisions and the Renewal of Infrastructure and Equipment in 2008 and 2009. The table shows the cost of participating in the Institute for each country. In some cases, there is a positive difference between the cost of participation and the quota payable. This is because some Member States assist others by making relatively larger contributions.
X. Projection of External Resources and INR
It is estimated that IICA will execute US$110,660,618 in external funds in 2008 and US$109,963,907 in 2009.
In order to cover the incremental costs incurred in the execution of these external resources, IICA expects to receive US$6,571,777 in INR resources in 2008 and US$6,570,758 in 2009.
Appendix 5 gives a breakdown of the projection of external
LIST OF TABLES
Table No. 1 Evolution of the Regular Fund in Nominal Values, 1994-2007 and 2008-2009Table No. 2 Quota Scale of the Member States and Estimated Miscellaneous Income, 2008-2009
Table No. 3 Allocation of the Regular Fund by Chapter, 2006-2007 and 2008-2009 Program Budgets
Table No. 4 Chapter II: Management Costs. Regular Fund: Quotas and Miscellaneous
Table No. 5 Chapter III: General Costs and Provisions. Regular Fund: Quotas and Miscellaneous
Table No. 6 Chapter I: Direct Technical Cooperation Services. Regular Fund: Quotas and Miscellaneous (US$ and Number of Positions)
Table No. 7 Chapter II: Management Costs. Regular Fund: Quotas and Miscellaneous (US$ and Number of Positions)
Table No. 8 Chapter III: General Costs and Provisions. Regular Fund: Quotas and Miscellaneous (US$ and Number of Positions)
Table No. 9 Chapter IV: Renewal of Infrastructure and Equipment. Regular Fund: Quotas and Miscellaneous (US$ and Number of Positions)
Table No. 10 Overall Allocation. Regular Fund: Quotas and Miscellaneous (US$ and Number of Positions)
Table No. 11 Technical Cooperation Units, Programs and Projects by Scope of Action. 2006-2007 and 2008-2009. Regular Fund Table No. 12 Comparison of 2007 and 2008-2009 Program Budgets. Regular Fund
Table No. 13 Comparison of 2002-2003 to 2006-2007 and 2008-2009 Program Budgets. National Level Units. Quota Resources Table No. 14 Technical Cooperation Units at the National Level. Regular Fund: Quotas and Miscellaneous Income
Table No. 15 Technical Cooperation Plans, Programs and Projects at the Regional Level. Regular Fund: Quotas and Miscellaneous Income Table No. 16 Technical Cooperation Units and Programs at the Hemispheric Level. Regular Fund: Quotas and Miscellaneous Income Table No. 17 Allocation of the Regular Fund to Cooperative Projects and Projects in Support of Integration
Table No. 18 Allocation of the Regular Fund to Hemispheric Technical Cooperation Programs
Table No. 19 Chapter I: Direct Technical Cooperation Services. Allocation of the Regular Fund by Strategic Priority
Table No. 20 Strategic Priorities of Direct Technical Cooperation Services. Regular Fund: Quotas and Miscellaneous Income Table No. 21 Regular Fund Resources, by Major Object of Expenditure. 2007 and 2008-2009 Program Budgets
Table No. 22 Structure of the Major Objects of Expenditure. Regular Fund (US$ x 000 and %) Table No. 23 Staff Positions Financed by the Regular Fund. 1992-2009 Program Budgets
Evolution of the Regular Fund in Nominal Values
1994-2007 and 2008-2009 (US$ x 000)
PERIOD QUOTAS MISCELLANEOU
S REGULAR FUND 1994 26.707,5 267,1 26.974,6 1995 27.508,7 275,1 27.783,8 1996 27.508,7 283,4 27.792,1 1997 27.508,7 291,9 27.800,6 1998 27.508,7 2.491,3 30.000,0 1999 27.508,7 2.491,3 30.000,0 2000 27.508,7 2.491,3 30.000,0 2001 27.508,7 2.491,3 30.000,0 2002 27.508,7 2.491,3 30.000,0 2003 27.167,6 2.832,4 30.000,0 2004 27.167,6 2.832,4 30.000,0 2005 27.167,6 2.832,4 30.000,0 2006 27.167,6 2.832,4 30.000,0 2007 27.167,6 2.832,4 30.000,0 2008 27.167,6 4.100,0 31.267,6 2009 27.167,6 4.100,0 31.267,6
Note: The Cuban quota was excluded from the quota resources as of 2003.
Program Budget
AMOUNT %
Antigua and Barbuda 0,02 5.502 0,02 5.502 0 0,0
Argentina 4,90 1.347.925 4,90 1.347.925 0 0,0 Bahamas 0,07 19.256 0,07 19.256 0 0,0 Barbados 0,08 22.007 0,08 22.007 0 0,0 Belize 0,03 8.253 0,03 8.253 0 0,0 Bolivia 0,07 19.256 0,07 19.256 0 0,0 Brazil 8,55 2.351.992 8,55 2.351.992 0 0,0 Canada 12,36 3.400.073 12,36 3.400.073 0 0,0 Chile 0,54 148.547 0,54 148.547 0 0,0 Colombia 0,94 258.582 0,94 258.582 0 0,0 Costa Rica 0,13 35.761 0,13 35.761 0 0,0 Dominica 0,02 5.502 0,02 5.502 0 0,0 Dominican Republic 0,18 49.516 0,18 49.516 0 0,0 Ecuador 0,18 49.516 0,18 49.516 0 0,0 El Salvador 0,07 19.256 0,07 19.256 0 0,0 Grenada 0,03 8.253 0,03 8.253 0 0,0 Guatemala 0,13 35.761 0,13 35.761 0 0,0 Guyana 0,02 5.502 0,02 5.502 0 0,0 Haiti 0,07 19.256 0,07 19.256 0 0,0 Honduras 0,07 19.256 0,07 19.256 0 0,0 Jamaica 0,18 49.516 0,18 49.516 0 0,0 Mexico 6,08 1.672.528 6,08 1.672.528 0 0,0 Nicaragua 0,07 19.256 0,07 19.256 0 0,0 Panama 0,13 35.761 0,13 35.761 0 0,0 Paraguay 0,18 49.516 0,18 49.516 0 0,0 Peru 0,41 112.786 0,41 112.786 0 0,0
Saint Kitts and Nevis 0,02 5.502 0,02 5.502 0 0,0
Saint Lucia 0,03 8.253 0,03 8.253 0 0,0
Saint Vincent and the Grenadines 0,02 5.502 0,02 5.502 0 0,0
Suriname 0,07 19.256 0,07 19.256 0 0,0
Trinidad and Tobago 0,18 49.516 0,18 49.516 0 0,0
United States of America 59,47 16.359.412 59,47 16.359.412 0 0,0
Uruguay 0,26 71.523 0,26 71.523 0 0,0 Venezuela 3,20 880.278 3,20 880.278 0 0,0 SUB TOTAL 98,76 27.167.572 98,76 27.167.572 0 0,0 27.167.572 Cuba 1,24 1,24 TOTAL QUOTAS 100,00 27.167.572 100,00 27.167.572 0 0,0 27.167.572 MISCELLANEOUS INCOME 3 2.832.428 4.100.000 1.267.572 44,8 4.100.000
TOTAL REGULAR FUND 30.000.000 31.267.572 1.267.572 4,2 31.267.572
2/ As recommended by the Executive Committee, the decision regarding the IICA Quota Scale for 2009 is postponed.
3/ Miscellaneous income for 2008 and 2009 includes US$3,600,000 in expected income, and US$500,000 from the Miscellaneous Income Fund.
Table No. 2
IICA
AMOUNT
Program Budget 2008-2009 Quota Scale of the Member States and Estimated Miscellaneous Income
MEMBER STATES 2007 AMOUNT 2009 2 % VARIATION 08/07 IICA
1/ As recommended by the Executive Committee, the current IICA quota scale will be maintained for 2008, pending the decision of the OAS regarding its
% AMOUNT
IICA %
Table No. 3
CHAPTER REGULAR REGULAR REGULAR REGULAR
FUND FUND FUND FUND
CHAPTER I: Direct Technical Cooperation Services 24.497,7 2.789,7 27.287,4 24.693,4 2.789,6 27.483,1 24.290,3 3.587,9 27.878,2 24.290,3 3.587,9 27.878,2 CHAPTER II: Management Costs 1.574,4 42,7 1.617,1 1.378,6 42,8 1.421,4 1.292,5 82,8 1.375,3 1.292,5 82,8 1.375,3
CHAPTER III: General Costs and Provisions 1 1.095,5 0,0 1.095,5 1.095,5 0,0 1.095,5 1.103,2 0,0 1.103,2 1.103,2 0,0 1.103,2 CHAPTER IV: Renewal of Infrastructure and Equipment 2 - - - - - - 481,6 429,4 911,0 481,6 429,4 911,0 TOTAL 27.167,6 2.832,4 30.000,0 27.167,6 2.832,4 30.000,0 27.167,6 4.100,0 31.267,6 27.167,6 4.100,0 31.267,6 1/ Does not include Cuban quota.
2/ Chapter IV: Renewal of Infrastructure and Equipment as of 2008-2009 Program Budget.
MISC. QUOTAS MISC.
Program Budget
2008-2009
QUOTAS MISC. QUOTAS MISC.
Allocation of the Regular Fund by Chapter
2009
2006 2007
2006-2007 and 2008-2009 Program Budgets
(US$ x 000)
QUOTAS
2008
Unit Quotas Miscellaneous Total
Chapter II: Management Costs (US$)
Regular Fund: Quotas and Miscellaneous
Program BudgetTable N° 4 2008 - 2009
2008
Quotas Miscellaneous Total 2009
629.041 20.000 649.041
Office of the Director General 629.041 20.000 649.041
663.477 62.783 726.260
Directorate of Administration and Finance 663.477 62.783 726.260
Total Management Costs 1.292.518 82.783 1.375.301
Note: The 2008 - 2009 Regular Fund comprise the resources contained in this table (Chapter II: Management Costs), and those earmarked for Chapter I (Direct Technical Cooperation Services), Chapter III (General Costs and Provisions) and Chapter IV (Renewal of Infrastructure and Equipment).
1.292.518 82.783 1.375.301
Table N°4: Page 1 of 1 PP-Ci-04 BD CPS
Chapter III: General Costs and Provisions (US$)
Regular Fund: Quotas and Miscellaneous
Program BudgetTable N°5
Quotas Miscellaneous Total
Resources Allocated from the Regular Fund
%
2008 - 2009
2008
Quotas Miscellaneous Total %
2009
Governing Bodies 400.000 0 400.000 36,3% 400.000 0 400.000 36,3%
Insurance 320.000 0 320.000 29,0% 320.000 0 320.000 29,0%
Pensions 262.650 0 262.650 23,8% 262.650 0 262.650 23,8%
OAS Administrative Tribunal 25.000 0 25.000 2,3% 25.000 0 25.000 2,3%
External Audit 95.500 0 95.500 8,7% 95.500 0 95.500 8,7%
1.103.150 0 1.103.150 100,0%
TOTAL:
Note: The 2008 - 2009 Regular Fund comprise the resources contained in this table (Chapter III: General Costs and Provisions), and those earmarked for Chapter I: Direct Technical Cooperation Services, Chapter II: Management Costs and Chapter IV: Renewal of Infrastructure and Equipment.
1.103.150 0 1.103.150 100,0%
Table N° 5: Page 1 of 1 PP-Ci-05 BD CPS
Chapter I: Direct Technical Cooperation Services
Regular Fund: Quotas and Miscellaneous
(US$ and Number of Positions)
Program Budget Table N° 6 2008 - 2009 DG 0 SDG 0 D1 2 D2 15 P6 14 P5 50 P4 5 P3 P2 P1 Class Total 88 PL5 10 PL4 42 PL2 20 PL3 45 PL1 12 Class Total 129 G9 0 G8 16 G6 53 G7 48 G5 30 G4 30 G3 13 G2 8 G1 6 Class Total 204
Summary IPP Summary LPP
Summary GSP Number of Positions
Summary by Object of Expenditure
International Professional Personnel (IP 9.939.147
Local Professional Personnel (LPP) 4.814.237
General Services Personnel (GSP) 2.927.389
Operating Costs (MOE 3 to 9) 10.197.390
Total 27.878.163 35,7% 17,3% 10,5% 36,6% 100,0% US$ % Source of Funds Quota Resources 24.290.312 Miscellaneous Resources 3.587.851 Total 27.878.163 87,1% 100,0% US$ % 12,9% Total 333 Total LPP and GSP SDGA 2 2008 2008 2008 2008 2008
Note: The 2008 - 2009 Regular Fund comprise the resources contained in this table (Chapter I: Direct Technical Cooperation Services ), and those earmarked for Chapter II: Management Costs, Chapter III: General Costs and Provisions and Chapter IV: Renewal of Infrastructure and Equipment.
35,7% 17,3% 10,5% 36,6% 100,0% % 2009 9.939.147 4.814.237 2.927.389 10.197.390 27.878.163 US$ US$ % 2009 87,1% 100,0% 12,9% 24.290.312 3.587.851 27.878.163 2009 0 0 2 15 2 14 50 5 2009 88 333 10 42 45 20 12 129 2009 204 0 16 48 53 30 30 13 8 6 Table N°6: Page 1 of 1 PP-Ci-06 BD CPS
Chapter II: Management Costs
Regular Fund: Quotas and Miscellaneous
(US$ and Number of Positions)
Program Budget Table N° 7 2008 - 2009 DG 1 SDG 1 D1 2 D2 2 P6 0 P5 0 P4 0 P3 P2 P1 Class Total 6 PL5 0 PL4 1 PL2 1 PL3 3 PL1 1 Class Total 6 G9 1 G8 0 G6 3 G7 2 G5 2 G4 3 G3 8 G2 4 G1 0 Class Total 23
Summary IPP Summary LPP
Summary GSP Number of Positions
Summary by Object of Expenditure
International Professional Personnel (IPP 794.064
Local Professional Personnel (LPP) 161.373
General Services Personnel (GSP) 211.511
Operating Costs (MOE 3 to 9) 208.353
Total 1.375.301 57,7% 11,7% 15,4% 15,1% 100,0% US$ % Source of Funds Quota Resources 1.292.518 Miscellaneous Resources 82.783 Total 1.375.301 94,0% 100,0% US$ % 6,0% Total 29 Total LPP and GSP SDGA 0 2008 2008 2008 2008 2008
Note: The 2008 - 2009 Regular Fund comprise the resources contained in this table (Chapter II: Management Costs), and those earmarked for Chapter I: Direct Technical Cooperation Services, Chapter III: General Costs and Provisions and Chapter IV: Renewal Infrastructure and Equipment.
57,7% 11,7% 15,4% 15,1% 100,0% % 2009 794.064 161.373 211.511 208.353 1.375.301 US$ US$ % 2009 94,0% 100,0% 6,0% 1.292.518 82.783 1.375.301 2009 1 1 0 2 2 0 0 0 2009 6 29 0 1 3 1 1 6 2009 23 1 0 2 3 2 3 8 4 0 Table N°7: Page 1 of 1 PP-Ci-07 BD CPS
Chapter III: General Costs and Provisions
Regular Fund: Quotas and Miscellaneous
(US$ and Number of Positions)
Program Budget Table N° 8 2008 - 2009 DG SDG D1 D2 P6 P5 P4 P3 P2 P1 Class Total 0 PL5 PL4 PL2 PL3 PL1 Class Total 0 G9 G8 G6 G7 G5 G4 G3 G2 G1 Class Total 0
Summary IPP Summary LPP
Summary GSP Number of Positions
Summary by Object of Expenditure
International Professional Personnel* 262.650
Local Professional Personnel (LPP) 0
General Services Personnel (GSP) 0
Operating Costs (MOE 3 to 9) 840.500
Total 1.103.150 23,8% 0,0% 0,0% 76,2% 100,0% US$ % Source of Funds Quota Resources 1.103.150 Miscellaneous Resources 0 Total 1.103.150 100,0% 100,0% US$ % 0,0% Total 0 Total LPP and GSP SDGA 2008 2008 2008 2008 2008 23,8% 0,0% 0,0% 76,2% 100,0% % 2009 262.650 0 0 840.500 1.103.150 US$ US$ % 2009 100,0% 100,0% 0,0% 1.103.150 0 1.103.150 2009 2009 0 0 0 2009 0
*/ Corresponds to pensions of former directors and former employees.
Note: The 2008 - 2009 Regular Fund comprise the resources contained in this table (Chapter III: General Costs and Provisions), and those earmarked for Chapter I: Direct Technical Cooperation Services, Chapter II: Management Costs and Chapter IV: Renewal of Infrastructure and Equipment.
Table N°8: Page 1 of 1 PP-Ci-08 BD CPS
Chapter IV: Renewal of Infrastructure and Equipment
Regular Fund: Quotas and Miscellaneous
(US$ and Number of Positions)
Program Budget Table N° 9 2008 - 2009 DG SDG D1 D2 P6 P5 P4 P3 P2 P1 Class Total 0 PL5 PL4 PL2 PL3 PL1 Class Total 0 G9 G8 G6 G7 G5 G4 G3 G2 G1 Class Total 0
Summary IPP Summary LPP
Summary GSP Number of Positions
Summary by Object of Expenditure
International Professional Personnel (IPP 0
Local Professional Personnel (LPP) 0
General Services Personnel (GSP) 0
Operating Costs (MOE 3 to 9) 910.958
Total 910.958 0,0% 0,0% 0,0% 100,0% 100,0% US$ % Source of Funds Quota Resources 481.592 Miscellaneous Resources 429.366 Total 910.958 52,9% 100,0% US$ % 47,1% Total 0 Total LPP and GSP SDGA 2008 2008 2008 2008 2008 0,0% 0,0% 0,0% 100,0% 100,0% % 2009 0 0 0 910.958 910.958 US$ US$ % 2009 52,9% 100,0% 47,1% 481.592 429.366 910.958 2009 2009 0 0 0 2009 0
Note: The 2008 - 2009 Regular Fund comprise the resources contained in this table (Chapter IV: Renewal of
Infrastructure and Equipment), and those earmarked for Chapter I: Direct Technical Cooperation Services, Chapter II: Management Costs and Chapter III: General Costs and Provisions.
Table N°09: Page 1 of 1 PP-Ci-09 BD CPS
Overall Allocation
Regular Fund: Quotas and Miscellaneous
(US$ and Number of Positions)
Program Budget Table N° 10 2008 - 2009 DG 1 SDG 1 D1 4 D2 17 P6 14 P5 50 P4 5 P3 0 P2 0 P1 0 Class Total 94 PL5 10 PL4 43 PL2 21 PL3 48 PL1 13 Class Total 135 G9 1 G8 16 G6 56 G7 50 G5 32 G4 33 G3 21 G2 12 G1 6 Class Total 227
Summary IPP Summary LPP
Summary GSP Number of Positions
Summary by Object of Expenditure
International Professional Personnel (IPP 10.995.861
Local Professional Personnel (LPP) 4.975.610
General Services Personnel (GSP) 3.138.900
Operating Costs (MOE 3 to 9) 12.157.201
Total 31.267.572 35,2% 15,9% 10,0% 38,9% 100,0% US$ % Source of Funds Quota Resources 27.167.572 Miscellaneous Resources 4.100.000 Total 31.267.572 86,9% 100,0% US$ % 13,1% Total 362 Total LPP and GSP SDGA 2 2008 2008 2008 2008 2008 35,2% 15,9% 10,0% 38,9% 100,0% % 2009 10.995.861 4.975.610 3.138.900 12.157.201 31.267.572 US$ US$ % 2009 86,9% 100,0% 13,1% 27.167.572 4.100.000 31.267.572 2009 1 1 2 17 4 14 50 5 0 0 0 2009 94 362 10 43 48 21 13 135 2009 227 1 16 50 56 32 33 21 12 6 Table N°10: Page 1 of 1 PP-Ci-10 BD CPS
Table No. 11 2006 2007 2008 2009 2008-2007 2009-2008 National 15.595,1 15.365,6 16.408,1 16.408,1 1.042,5 0,0 Regional 4.522,3 4.673,0 4.510,8 4.510,8 (162,2) 0,0 Hemispheric 7.169,9 7.444,5 7.846,9 7.846,9 402,4 0,0 TOTAL 27.287,4 27.483,1 28.765,8 28.765,8 1.282,7 0,0 2008-2009 (US$ x 000)
2006-2007 and 2008-2009 Program Budgets Regular Fund
Program Budget
SCOPE OF ACTION APPROVED
Units, Programs and Projects of Technical Cooperation by Scope of Action
Note: Includes the resources allocated to Chapter I and IV of the Technical Cooperation Units, Programs and Projects.
QUOTAS MISCELLANEOUS TOTAL QUOTAS MISCELLANEOUS TOTAL QUOTAS MISCELLANEOUS TOTAL 2008-2007 2009-2008
TECHNICAL COOPERATION UNITS 3 24.693,4 2.789,6 27.483,1 24.748,6 4.017,2 28.765,8 24.748,6 4.017,2 28.765,8 1.282,7 0,0 NATIONAL LEVEL 12.997,1 2.368,5 15.365,6 12.997,1 3.411,0 16.408,1 12.997,1 3.411,0 16.408,1 1.042,5 0,0 REGIONAL LEVEL 4.518,0 20,0 4.538,0 4.330,8 180,0 4.510,8 4.330,8 180,0 4.510,8 -27,2 0,0 HEMISPHERIC LEVEL 7.178,4 401,1 7.579,5 7.420,7 426,2 7.846,9 7.420,7 426,2 7.846,9 267,4 0,0 2.508,8 96,5 2.605,4 2.528,3 130,4 2.658,7 2.528,3 130,4 2.658,7 53,3 0,0 1.224,9 0,0 1.224,9 1.503,2 127,5 1.630,7 1.503,2 127,5 1.630,7 405,8 0,0 1.000,0 0,0 1.000,0 1.000,0 0,0 1.000,0 1.000,0 0,0 1.000,0 0,0 0,0 Institutional Funds and Line Items 348,9 304,6 653,5 308,6 73,4 382,0 308,6 73,4 382,0 -271,5 0,0 2.095,7 0,0 2.095,7 2.080,5 95,0 2.175,5 2.080,5 95,0 2.175,5 79,8 0,0 MANAGEMENT UNITS 4 1.378,6 42,8 1.421,4 1.315,8 82,8 1.398,6 1.315,8 82,8 1.398,6 -22,8 0,0 Office of the Director General 643,0 0,0 643,0 630,9 20,0 650,9 630,9 20,0 650,9 7,9 0,0 Directorate of Administration and Finance 735,6 42,8 778,4 684,9 62,8 747,7 684,9 62,8 747,7 -30,7 0,0 GENERAL COSTS AND PROVISIONS (1) 1.095,5 0,0 1.095,5 1.103,2 0,0 1.103,2 1.103,2 0,0 1.103,2 7,7 0,0
Governing Bodies 400,0 0,0 400,0 400,0 0,0 400,0 400,0 0,0 400,0 0,0 0,0
Insurance 320,0 0,0 320,0 320,0 0,0 320,0 320,0 0,0 320,0 0,0 0,0
Pensions 255,0 0,0 255,0 262,7 0,0 262,7 262,7 0,0 262,7 7,6 0,0
OAS Administrative Tribunal 25,0 0,0 25,0 25,0 0,0 25,0 25,0 0,0 25,0 0,0 0,0
External Audit 95,5 0,0 95,5 95,5 0,0 95,5 95,5 0,0 95,5 0,0 0,0
TOTAL REGULAR FUND 27.167,6 2.832,4 30.000,0 27.167,6 4.100,0 31.267,6 27.167,6 4.100,0 31.267,6 1.267,6 0,0
(2) In 2007, the Regional and Hemispheric Programs have been placed in a different order to facilitate comparison. (3) Includes the resources allocated to Chapters I and IV of these units.
(4) Includes the resources allocated to Chapters II and IV of these units.
VARIATION
Technical Support Units Contribution to CATIE
(US$ x 000)
Hemispheric Technical Cooperation Programs Technical Cooperation Units
UNIT Program Budget Table No. 12 Regular Fund 2008-2009 REGULAR FUND
(1) Does not include the Cuban quota.
Comparison of 2007 and 2008-2009 Program Budgets
2007 2 2008 2009
PP-C 13
2008-2007 2009-2008 NATIONAL LEVEL 11.552,7 12.585,3 12.598,7 12.598,7 12.997,1 12.997,1 12.997,1 12.997,1 0,0 0,0 Argentina 500,0 571,0 571,0 571,0 571,0 571,0 571,0 571,0 0,0 0,0 Bahamas 192,5 236,0 236,0 236,0 236,0 236,0 236,0 236,0 0,0 0,0 Barbados 268,9 370,0 370,0 370,0 370,0 370,0 370,0 370,0 0,0 0,0 Belize 225,0 246,0 246,0 246,0 246,0 246,0 246,0 246,0 0,0 0,0 Bolivia 381,7 402,0 402,0 402,0 402,0 402,0 402,0 402,0 0,0 0,0 Brazil 833,0 833,0 833,0 833,0 833,0 833,0 833,0 833,0 0,0 0,0 Canada 568,5 568,5 568,5 568,5 568,5 568,5 568,5 568,5 0,0 0,0 Chile 413,0 413,0 413,0 413,0 413,0 413,0 413,0 413,0 0,0 0,0 Colombia 450,0 467,0 467,0 467,0 467,0 467,0 467,0 467,0 0,0 0,0 Costa Rica 304,5 333,4 333,4 333,4 333,4 333,4 333,4 333,4 0,0 0,0 Dominican Republic 491,6 491,6 491,6 491,6 491,6 491,6 491,6 491,6 0,0 0,0 Ecuador 450,0 450,0 450,0 450,0 450,0 450,0 450,0 450,0 0,0 0,0 El Salvador 314,5 351,0 351,1 351,1 351,1 351,1 351,1 351,1 0,0 0,0 Guatemala 346,9 377,0 377,1 377,1 377,1 377,1 377,1 377,1 0,0 0,0 Guyana 266,4 326,0 326,0 326,0 326,0 326,0 326,0 326,0 0,0 0,0 Haiti 408,5 408,4 408,4 408,4 408,4 408,4 408,4 408,4 0,0 0,0 Honduras 295,4 337,0 337,0 337,0 337,0 337,0 337,0 337,0 0,0 0,0 Jamaica 392,1 392,1 392,1 392,1 392,1 392,1 392,1 392,1 0,0 0,0 Mexico 600,0 600,0 600,0 600,0 600,0 600,0 600,0 600,0 0,0 0,0 Nicaragua 297,5 351,0 351,0 351,0 351,0 351,0 351,0 351,0 0,0 0,0 OECS 654,5 751,7 751,7 751,7 751,7 751,7 751,7 751,7 0,0 0,0 Panama 311,4 337,0 337,0 337,0 337,0 337,0 337,0 337,0 0,0 0,0 Paraguay 347,0 390,0 390,0 390,0 390,0 390,0 390,0 390,0 0,0 0,0 Peru 448,2 448,2 448,2 448,2 448,2 448,2 448,2 448,2 0,0 0,0 Suriname 188,6 303,0 303,0 303,0 303,0 303,0 303,0 303,0 0,0 0,0
Trinidad and Tobago 311,4 410,0 410,0 410,0 410,0 410,0 410,0 410,0 0,0 0,0
United States of America 444,6 503,7 516,9 516,9 915,3 915,3 915,3 915,3 0,0 0,0
Uruguay 347,0 406,0 406,0 406,0 406,0 406,0 406,0 406,0 0,0 0,0
Venezuela 500,0 511,7 511,7 511,7 511,7 511,7 511,7 511,7 0,0 0,0
Note: Includes the resources allocated to Chapters I and IV of these units.
Quota Resources
UNIT 2002 2003 2004 2005 2007 2008 (US$ x 000) 2008-2009 2006 2009 VARIATION Table No.13Comparison of 2002-2003 to 2006-2007 and 2008-2009 Program Budgets
Program Budget
Units at National Level
Unit Quotas Miscellaneous Total
Technical Cooperation Units at the National Level (US$)
Regular Fund: Quotas and Miscellaneous
Program BudgetTable N° 14 2008 - 2009
2008
Quotas Miscellaneous Total 2009
571.000 99.469 670.469
IICA Office in Argentina 571.000 99.469 670.469 236.000 8.165 244.165
IICA Office in Bahamas 236.000 8.165 244.165
370.000 40.488 410.488
IICA Office in Barbados 370.000 40.488 410.488 246.000 11.078 257.078
IICA Office in Belize 246.000 11.078 257.078
402.000 44.797 446.797
IICA Office in Bolivia 402.000 44.797 446.797 833.000 1.048.510 1.881.510
IICA Office in Brazil 833.000 1.048.510 1.881.510 568.500 29.550 598.050
IICA Office in Canada 568.500 29.550 598.050
413.000 19.168 432.168
IICA Office in Chile 413.000 19.168 432.168
467.000 1.300.000 1.767.000
IICA Office in Colombia 467.000 1.300.000 1.767.000 333.400 47.689 381.089
IICA Office in Costa Rica 333.400 47.689 381.089 491.600 22.059 513.659
IICA Office in Dominican Republic 491.600 22.059 513.659 450.000 112.611 562.611
IICA Office in Ecuador 450.000 112.611 562.611 351.102 71.907 423.009
IICA Office in El Salvador 351.102 71.907 423.009 377.070 37.519 414.589
IICA Office in Guatemala 377.070 37.519 414.589 326.000 14.459 340.459
IICA Office in Guyana 326.000 14.459 340.459
408.400 18.108 426.508
IICA Office in Haiti 408.400 18.108 426.508
337.000 71.548 408.548
IICA Office in Honduras 337.000 71.548 408.548 392.100 13.509 405.609
IICA Office in Jamaica 392.100 13.509 405.609 600.000 123.790 723.790
IICA Office in Mexico 600.000 123.790 723.790 351.000 62.523 413.523
IICA Office in Nicaragua 351.000 62.523 413.523
Table N°14: Page 1 of 2 PP-Ci-14 BD CPS
Includes the resources allocated to Chapters I and IV of these units.
Unit Quotas Miscellaneous Total
Technical Cooperation Units at the National Level (US$)
Regular Fund: Quotas and Miscellaneous
Program BudgetTable N° 14 2008 - 2009
2008
Quotas Miscellaneous Total 2009
751.700 24.315 776.015
IICA Office in OECS 751.700 24.315 776.015
337.000 11.191 348.191
IICA Office in Panama 337.000 11.191 348.191
390.000 19.300 409.300
IICA Office in Paraguay 390.000 19.300 409.300 448.200 30.295 478.495
IICA Office in Peru 448.200 30.295 478.495
303.000 10.866 313.866
IICA Office in Suriname 303.000 10.866 313.866 915.314 31.322 946.636
IICA Office in the United States of America 915.314 31.322 946.636 410.000 23.688 433.688
IICA Office in Trinidad and Tobago 410.000 23.688 433.688 406.000 19.308 425.308
IICA Office in Uruguay 406.000 19.308 425.308 511.700 43.737 555.437
IICA Office in Venezuela 511.700 43.737 555.437
Total Actions National Level 12.997.086 3.410.969 16.408.055 12.997.086 3.410.969 16.408.055
Table N°14: Page 2 of 2 PP-Ci-14 BD CPS
Includes the resources allocated to Chapters I and IV of these units.
Regional Action Quotas Miscellaneous Total
Actions of Technical Cooperation at the Regional Level (US$)
Regular Fund: Quotas and Miscellaneous
Program BudgetTable N° 15
2008
2008 - 2009
Quotas Miscellaneous Total 2009
Central Region 872.600 37.500 910.100 872.600 37.500 910.100
124.518 7.500 132.018 Regional Technical Cooperation Plan in
Policies and Trade in the Central Region
124.518 7.500 132.018
129.835 7.500 137.335 Regional Technical Cooperation Plan in
Technology and Innovation in the Central Region
129.835 7.500 137.335
123.090 7.500 130.590 Regional Technical Cooperation Plan in
Agricultural Health and Food Safety in the Central Region
123.090 7.500 130.590
124.587 7.500 132.087 Regional Technical Cooperation Plan in Rural
Communities in the Central Region
124.587 7.500 132.087
127.118 7.500 134.618 Regional Technical Cooperation Plan for
Agribusiness Development in the Central Region
127.118 7.500 134.618
133.900 0 133.900
Support to the Regional Council for Agricultural Cooperation-CORECA and the Central American Agricultural Council-CAC
133.900 0 133.900
104.552 0 104.552
Regional Cooperative Program for the
Technological Development and Modernization of Coffe Cultivation in Central America, Panama and Dominican Republic-PROMECAFE
104.552 0 104.552
5.000 0 5.000
Support to the System for the Central America Agricultural Technology Integration System - SICTA
5.000 0 5.000
Caribbean Region 1.045.407 37.500 1.082.907 1.045.407 37.500 1.082.907
Table N°15: Page 1 of 5 PP-Ci-15 BD CPS
Includes the resources allocated to Chapters I and IV of these Plans, Programs and Projects.