PREDICTING THE NON-LINEAR SHEAR BEHAVIOUR OF DEEP
BEAMS BASED ON A TWO-PARAMETER KINEMATIC MODEL
Boyan Mihaylov
Structural Engineering, Department of ArGEnCo, University of Liege, Bât. B52, Chemin des Chevreuils, 4000 Liege, Belgium
Abstract
The evaluation of deep transfer girders subjected to extreme loading requires computationally effective methods and tools for predicting their complete pre- and post-peak shear behaviour. This paper discusses such an approach which stems from a two-parameter kinematic theory (2PKT) for the shear strength and deformation capacity of deep beams. The 2PKT includes equations for equilibrium, compatibility of deformations, and constitutive relationships for the mechanisms of shear resistance. In this paper the constitutive relationships of the 2PKT are modified to allow for the computation of the complete response of deep beams. The extended 2PKT approach is validated with tests of deep beams showing excellent results. The test properties are varied to study the effect of concrete strength and amounts of longitudinal and transverse reinforcement on the shear behaviour. It is shown that deep beams with high-strength concrete exhibit brittle snap-back failures. Increasing the amount of longitudinal reinforcement decreases the displacement capacity of deep beams while the opposite trend is observed with the addition of transverse reinforcement. Increased amounts of longitudinal and transverse reinforcement result in increased peak and post-peak resistance.
Keywords: deep beams, shear behaviour, kinematics, displacement capacity, post-peak behaviour, snap-back shear failure
1
Introduction
Deep beams are often used as transfer girders in buildings to support heavy loads from discontinuous columns or shear walls. Several buildings with such girders were severely damaged during the February 2011 earthquake in Christchurch, New Zealand, which produced unforeseen vertical ground accelerations of up to 1.8g. These large accelerations overloaded the transfer girders and one of the affected buildings had to be stabilized urgently in the hours after the earthquake. To evaluate the stability of such structures which have sustained large deformations, the structural engineer needs to estimate the residual shear capacity of the transfer girders. Current models for deep beams however are either focused almost entirely on the shear strength of undamaged members, or are too complex to be used within the limited time available to the structural engineer. The most commonly used approach for shear strength calculations is the strut-and-tie modelling (Schlaich, Schäfer & Jennewein 1987, CSA 2005, CEN 2004) while more complex analyses are usually performed with non-linear finite element models. Some extended strut-and-tie models also account for the non-linear behaviour of the struts and ties (Salem & Maekawa 2006, Eom & Park 2010, Scott, Mander & Bracci 2012). This paper discusses an alternative approach aimed at capturing the complete pre- and post-peak shear behaviour of deep beams in an accurate and time effective manner.
The approach presented here is an extension of a two-parameter kinematic theory (2PKT) for predicting the shear strength and displacement capacity of deep beams (Mihaylov, Bentz & Collins 2013). The 2PKT, which also predicts the deformations patterns in deep beams, is extended by modifying its constitutive relationships in the simplest possible manner. This extended 2PKT will be used to evaluate the effect of different parameters on the shear behaviour of deep beams such as the concrete strength and amounts of longitudinal and transverse reinforcement. A more comprehensive development of this approach can be found elsewhere (Mihaylov 2014).
2
Two-parameter kinematic theory
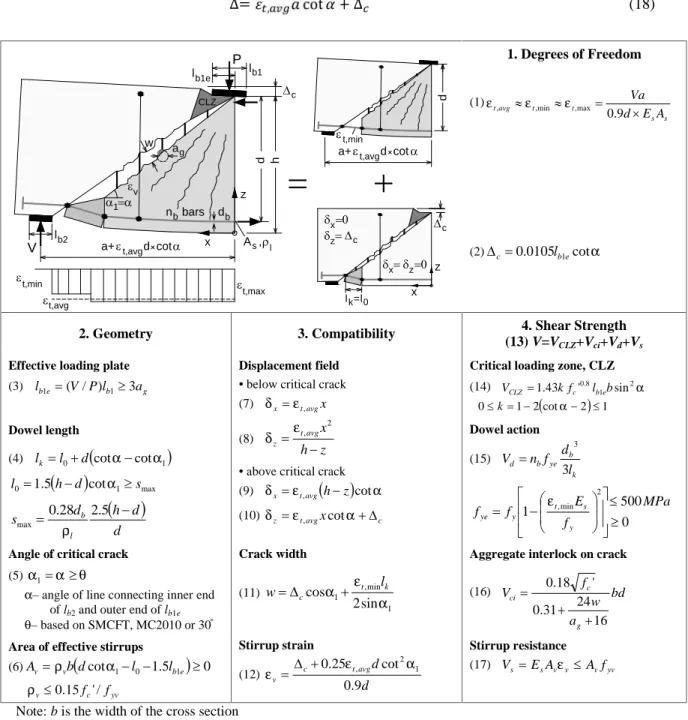
The two-parameter kinematic theory (2PKT) is based on a simple kinematic description of the deformation patterns of diagonally cracked deep beams. Figure 1 shows the kinematics of deep beams and summarizes the equations of the 2PKT. As evident from box 1 in the figure, the complete deformation pattern of a shear span is obtained by the superposition of two deformation patterns: a pattern associated with flexural deformations (top diagram) and a pattern associated with shear deformations along a critical diagonal crack (bottom diagram). The flexural pattern depends on the average strain εt,avgin the bottom longitudinal reinforcement while the shear pattern depends on the
transverse displacementcin the critical loading zone (CLZ) of the beam. These two deformations are
the two kinematic parameters (or degrees of freedom DOFs) of the 2PKT.
As evident from (1), strainεt,avgdepends on the bending moment V.a at the section under the load, the
lever arm of the internal forces in this section z≈0.9d, and the elastic stiffness of the longitudinal reinforcement EsAs. On the other hand, deformationcgiven by (2) depends on the effective width of
the loading plate lb1e and the angleα of the critical diagonal crack in the vicinity of the plate. The
expression for c is derived based on the assumption that the CLZ is at failure under diagonal
compressive stresses. This is equivalent to assuming that the shear failure of the beam is triggered by the crushing of the critical loading zone.
The geometry of the kinematic model, including quantities lb1eand α, can be obtained from box 2 in
Fig. 1. Equation (4) gives the length lkof the heavily damaged zone along the flexural reinforcement at
the bottom of the critical diagonal crack. As evident from the deformation patterns in Fig. 1, the longitudinal reinforcement in this zone is subjected to double curvature bending associated with dowel action of the reinforcing bars. It can also be seen from the diagrams that the transverse reinforcement (stirrups) is not evenly strained along the shear span because the width of the critical crack is not constant. This is taken into account in (6) which provides an estimate of the area of stirrups Avwhich
are activated by the deformations in the shear span.
The equations in box 3 of Fig. 1 are used to calculate the deformations in the shear span as a function of the two DOFs εt,avgandc. Equations (7) and (8) give the displacement field of the beam below the
critical crack where the concrete is modelled as a “fan” of rigid struts. Above the critical crack the concrete is represented by a rigid block whose position is described by (9) and (10). Equations (7)-(10) are used to derive (11) and (12) for the width of the critical diagonal crack w and the strain in the stirrups εv. Deformations w and εvare needed for the calculation of the shear forces transferred across
the critical crack given in box 4 of Fig. 1.
As evident from (13) in box 4, the shear resistance of the beam consists of four components: shear carried in the critical loading zone VCLZ, aggregate interlock shear along the critical crack Vci, shear
carried by the stirrups Vs, and shear resisted by dowel action of the flexural reinforcement Vd.
Similarly toc, the CLZ component (14) is derived based on the assumption that the critical loading
zone is at failure under diagonal compressive stresses. The dowel action component (15) is evaluated by assuming that plastic hinges develop at both ends of the bar-dowels of length lk. This component
depends on the longitudinal strain in the bars-dowelsεt,minwhich is assumed equal to DOFεt,avg. The
remaining two shear strength components Vciand Vsalso depend of the DOFs of the kinematic model
trough the crack width w and stirrup strainεv, respectively.
A convenient procedure for solving the equations of the 2PKT is as follows. The first step is to calculate the geometry of the kinematic model from (3)-(6) and DOFcfrom (2), followed by a choice
of a trial value of DOFεt,avg(say 0.001). The two DOFs are then used to compute w andεvfrom (11)
and (12) which are in turn used to compute shear components Vci and Vs from (16) and (17),
respectively. The other two components of shear resistance VCLZand Vdare evaluated from (14) and
(15), and the shear strength of the beam V is computed from (13). The obtained shear is then used to recalculate DOFεt,avgfrom (1). These calculations are repeated several times untilεt,avgconverges to a
constant value. Note that the iterations require only the recalculation of w,εv, Vd, Vci, and Vswhile all
other quantities remain unchanged. The final values of εt,avg and c can be substituted in (7)-(10) to
compute the displacement field of the shear span at shear failure. The deflection of the shear span (displacement capacity) can be calculated from (10) by substituting x with a:
∆= , cot + ∆ (18) 1. Degrees of Freedom (1) s s t t avg t A E d Va 9 . 0 max , min , , (2)c0.0105lb1ecot
2. Geometry 3. Compatibility 4. Shear Strength
(13) V=VCLZ+Vci+Vd+Vs Effective loading plate
(3) lb1e(V/P)lb13ag Dowel length (4) lkl0d
cotcot1
1 max 0 1.5h d cot s l
d d h d s l b 0.28 2.5 max Angle of critical crack
(5)1
– angle of line connecting inner end
of lb2and outer end of lb1e – based on SMCFT, MC2010 or 30˚ Area of effective stirrups
(6)Avvb
dcot1l01.5lb1e
0 yv c v0.15f /' f Displacement field• below critical crack
(7) xt,avgx (8) z h x avg t z 2 ,
• above critical crack
(9) xt,avg
hz
cot (10)zt,avgxcotc Crack width (11) 1 min , 1 sin 2 cos t k c l w Stirrup strain (12) d d avg t c v 9 . 0 cot 25 . 0 2 1 , Critical loading zone, CLZ
(14) 2 1 8 . 0 sin ' 43 . 1 kf l b VCLZ c be cot 2 1 2 1 0k Dowel action (15) k b ye b d l d f n V 3 3 0 500 1 2 min , MPa f E f f y s t y ye
Aggregate interlock on crack
(16) bd a w f V g c ci 16 24 31 . 0 ' 18 . 0 Stirrup resistance (17) VsEsAvvAvfyv Note: b is the width of the cross section
Fig. 1 2PKT for deep beams under single curvature bending
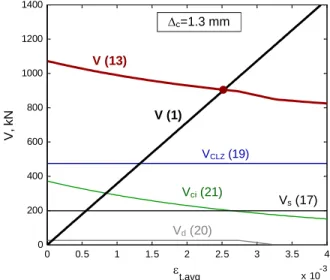
This solution procedure is illustrated graphically in Fig. 2 prepared for a deep beam specimen S1M (Mihaylov, Bentz & Collins 2010). This test specimen was simply supported and subjected to a point load in the middle of the span. The properties of the beam as well as its measured shear strength and deflection at shear failure (displacement capacity) are shown in Table 1. The horizontal axis of Fig. 2
is DOF εt,avg and the vertical axis are the shear forces. As εt,avg increases, the shear obtained from
moment equilibrium condition (1) increases linearly (see black thick line) owing to the linear elastic behaviour of the bottom flexural reinforcement. At the same time, the shear resistance obtained from (13) decreases slightly due to the weakening of the aggregate interlock and dowel action mechanisms (thick red line). The solution of the 2PKT equations lies at the intersection of these two curves where the shear forces are in equilibrium. The ordinate of the intersection point is 972 kN and represents the predicted shear strength of the beam. The experimental-to-predicted shear strength ratio for specimen S1M is therefore 941/972=0.97. The abscissa of the intersection point is 0.00284 which, when
P b1 l b1e l b2 l V c d h g a w v b d b n bars s A t,min t,max t,avg a+ d cott,avg CLZ x z 1 a+ d cott,avg t,min d x z c x z x z k l =l0 c l ,
substituted in (18) together with c obtained from (2), produces a deflection of 8.43 mm. This
graphical representation of the solution of the 2PKT equations is similar to that used by Ruiz and Muttoni 2008 for predicting the punching shear strength of reinforced concrete slabs.
Table 1
Summary of tests of deep beams (Mihaylov, Bentz & Collins 2010)
Beam a/d b d h a V/P l fc v Vexp Vpred* exp pred*
(mm) (mm) (mm) (mm) (%) (MPa) (%) (kN) (kN) (mm) (mm)
S1M 1.55 400 1095 1200 1700 0.5 0.70 33.0 0.10 941.0 976.3 7.7 8.3 S1C 1.55 400 1095 1200 1700 0.5 0.70 33.0 0.10 943.0 976.3 8.4 8.3 S0M 1.55 400 1095 1200 1700 0.5 0.70 34.2 0 721.0 827.5 6.4 7.4 S0C 1.55 400 1095 1200 1700 0.5 0.70 34.2 0 1162.0 827.5 10.9 7.4 For all beams: lb1=300 mm; lb2=150 mm; nb=6; ag=20 mm; fy=652 MPa; fyv=490 MPa
*
obtained with extended 2PKT approach
Fig. 2 Solution of the equations of the 2PKT - specimen S1M
3
Model for complete shear behaviour of deep beams
The 2PKT can be extended to capture not only the peak response of deep beams, but the entire load-displacement response following the development of diagonal cracks. A detailed formulation of this extended approach called a five-spring model can be found elsewhere (Mihaylov 2014). In this model the four mechanisms of shear resistance of the 2PKT are represented by four parallel non-linear springs. The fifth spring of the model is connected in series to the four springs and represents the flexural reinforcement. This spring accounts for tension stiffening effects and yielding of the reinforcement. In addition, the model includes a simple tri-linear representation of the load-displacement response prior to the propagation of diagonal cracks. The current paper presents a simplified approach for extending the 2PKT which neglects some of the effects taken into account in the five-spring model. The response of deep beams will be calculated under an increasing displacement in the critical loading zonec. The 2PKT will be extended by modifying (14), (15), and
(16) for shear components VCLZ, Vd, and Vci.
Expression (14) gives the peak shear resistance of the critical loading zone. As the goal here is to study the complete response of the beam, this equation needs to be replaced by an expression which captures the entire behaviour of the CLZ. A complete model of the CLZ has been proposed elsewhere (Mihyalov 2014) and has resulted in the following relationship between VCLZand DOFc:
= [ (Δ )] sin (19) 0 0.5 1 1.5 2 2.5 3 3.5 4 x 10⁻³ 0 200 400 600 800 1000 1200 1400 t,avg V, k N VCLZ(14) Vci(16) Vd(15) Vs(17) V (1) V (13) c=2.13 mm (2)
where = (Δ /3 ) tan . The relationship ( ) is obtained on the basis of an appropriate stress-strain relationship for the concrete under uniaxial compression (Popovic 1970). Strainεmaxis the compressive strain in the concrete while σavgis the stress obtained by averaging the
stresses from zero strain up to εmax. Because of this averaging, the CLZ is predicted to have a
somewhat less brittle behaviour than a concrete cylinder under uniaxial compression. In order to model the dowel action behaviour, (15) is modified as follows:
= ∆ ≤ 1 − , (20)
The first part of this expression represents the linear elastic behaviour of the bars-dowels which are modelled as fixed-fixed beams of length lkunder a transverse displacementc. As explained earlier,
the second part of this expression accounts for the formation of plastic hinges at the ends of the bars-dowels.
Finally, (16) is replaced by a new expression to model the complete behaviour of the aggregate interlock mechanism (Mihaylov 2014):
= 0.18 (21)
where 0.18vci is the average aggregate interlock shear stress transferred across the critical diagonal
crack. Stress vciis evaluated based on a contact density model proposed by Li, Maekawa & Okamura
1989. According to this model vciis a function of the width of the crack w and the slip on the crack s.
Since the 2PKT does not include an expression for s, such expression is derived from the bottom deformation pattern in Fig. 1:
= Δ sin (22)
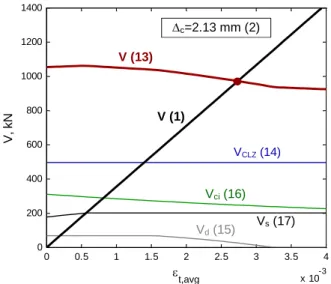
The solution of the set of equations of the extended 2PKT can be presented in the same format as that of the original 2PKT, see Fig. 3. Specimen S1M is solved underc of 1.3 mm which is smaller than
the displacement capacity of the CLZc= 2.13 mm obtained from (2). As before, the solution of the
equations corresponds to the point of intersection of the thick black and red lines. The abscissa of this
point is εt,avg=0.00253 and the ordinate is V = 904 kN. The value of the deflection obtained from
(18) is 7.12 mm.
Fig. 3 Solution to the equations of the extended 2PKT – specimen S1M
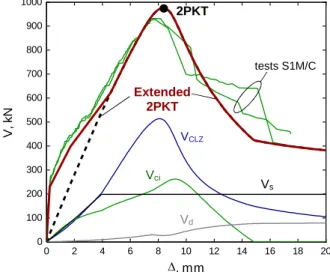
The calculations illustrated in Fig. 3 were repeated for different values of DOF c to compute the
complete V-response of specimen S1M. The result of these calculations is shown in Fig. 4 together with the experimentally obtained response of the specimen. Also shown in the plot is the envelope of the response of specimen S1C which was identical to S1M but was subjected to reversed cyclic loading. It can be seen that the extended 2PKT captures well the pre- and post- peak shear behaviour after the development of diagonal cracks. The 2PKT curve is combined with a tri-linear curve for the
0 0.5 1 1.5 2 2.5 3 3.5 4 x 10⁻³ 0 200 400 600 800 1000 1200 1400 t,avg V, k N VCLZ(19) Vci(21) Vd(20) Vs(17) V (1) V (13) c=1.3 mm
initial response of the beam which has been formulated elsewhere (Mihaylov 2014). It is important to note that the peak shear resistance of the beam occurs at approximately the same displacement as that of the critical loading zone VCLZ(≈ 8.5 mm). This confirms the assumption made in the 2PKT that
the failure of the CLZ triggers the shear failure of the beam. The stirrups are predicted to yield atof about 4 mm and maintain a constant shear resistance Vs afterwards. The aggregate interlock
mechanism Vcireaches a maximum soon after the failure of the beam and vanishes at of about 15
mm when the critical diagonal crack is very wide. According to this analysis the dowel action Vdhad
an effect mainly on the post-peak behaviour of specimen S1M. The prediction of the original 2PKT is indicated with a solid dot in Fig. 3 and agrees very well with the peak response predicted by the extended 2PKT. As the 2PKT approach uses only two degrees of freedom, the complete load-displacement analysis of a beam such as specimen S1M takes only several seconds on a typical PC.
Fig. 4 Predicted and measured load-displacement responses – specimen S1M
4
Parametric studies
3.1 Effect of longitudinal reinforcement ratio
The extended 2PKT approach is used to study the effect of different variables on the load-displacement response of deep beams. The first variable considered here is the ratio of longitudinal reinforcementl=As/bd. The analysis is performed based on specimen S1M by varyinglfrom 0.5%
to 2%. The number of bottom longitudinal bars is kept the same as in S1M (nb=6) and the diameter of
the bars is varied from 22 mm to 43 mm (U.S. bars #7 to #14).
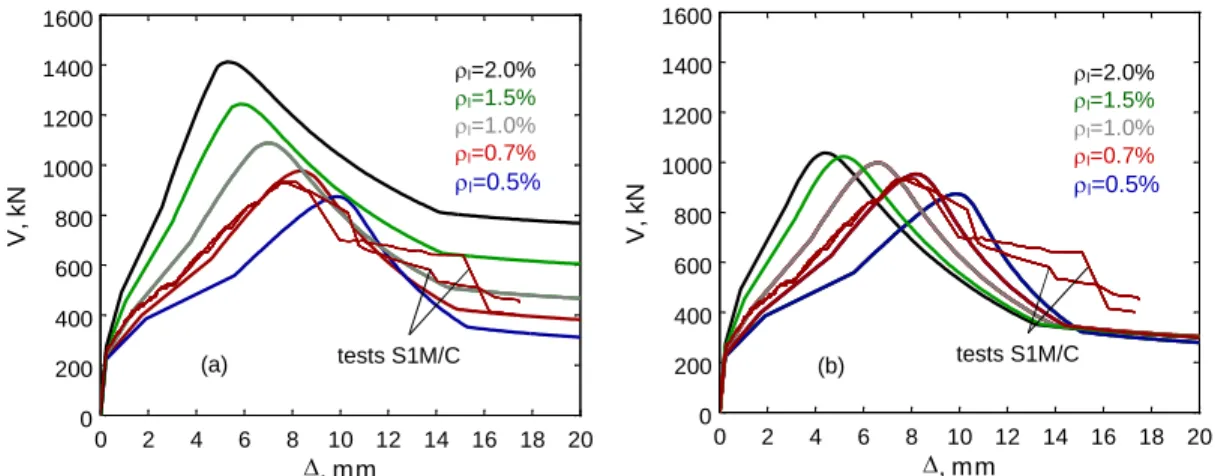
The predicted load-displacement response of the set of beams is shown in Fig. 6a. It can be seen that increasing amounts of flexural reinforcement result in a significant increase of cracked stiffness, shear strength, and post-peak resistance. For example, the beam withl=2.0% is predicted to be 1.6 times
stronger than that withl=0.5% while its displacement at peak load is 1.8 times smaller. Beams with
larger amounts of flexural reinforcement develop smaller flexural strains εt,avg and therefore smaller
deflections under a given load (first term of (18)). The reduced strains εt,avg also result in narrower
diagonal cracks (first term of (11)) and therefore larger aggregate interlock stresses vci transferred
across the cracks. The increased interlock resistance Vcitogether with larger dowel action forces Vdare
the reasons for the increased shear strengths. The relative magnitude of Vci and Vd can be seen by
comparing Fig. 6a) and 6b) where the latter plot is prepared by setting Vdin (20) equal to zero. It can
be seen that the dowel action has negligible effect on the beams withl=0.5% and 0.7% but becomes
significant for the beams with larger reinforcement ratios and larger bar diameters. It should also be noted that the increased resistance of the beams at large displacements (larger than about 14 mm) is entirely a result of the increased dowel action forces.
0 2 4 6 8 10 12 14 16 18 20 0 100 200 300 400 500 600 700 800 900 1000 , mm V, k N VCLZ Vci Vd Vs 2PKT Extended 2PKT tests S1M/C
Fig. 6 Effect of longitudinal reinforcement ratio: a) with the effect of dowel action; b) without the effect of dowel action
3.2 Effect of concrete strength
As modern construction features stronger and stronger concrete, it is also of interest to investigate how the concrete compressive strength fc affects the shear behaviour of deep beams. Such an analysis is
performed again on the basis of specimen S1M by varying fcfrom 20 MPa to 90 MPa, see Fig. 7.
Fig. 7 Effect of concrete compressive strength
As evident from the figure, the concrete strength has a relatively negligible effect on the cracked stiffness of the members but significantly affects the load-bearing capacity and post-peak response. Since the shear behaviour of deep beams is dominated by the diagonal compression in the CLZ, it is not surprising that increased concrete compressive strengths result in increased shear strengths. High-strength concretes behave almost linearly with a sudden drop of resistance and this is reflected in the response of the beams with fc=70 MPa and 90 MPa. It can be seen that these beams are predicted to
exhibit a snap-back post-peak behaviour characterized by decreasing deflections. If the beam with fc=90 MPa is tested under controlled displacements, the resistance of the beam would drop suddenly
from 1622 kN at=12.4 mm to 815 kN at=12.5 mm. The snap-back effect in deep beams has also been reported by Kaneco and Mihashi 2006 and can be explained by considering the two deformation patterns of the 2PKT in Fig. 1. The flexural pattern is associated with a flexible elastic load-bearing mechanism while the shear pattern is associated with a stiff and brittle mechanism. As the two mechanisms work essentially in series, the energy stored in the flexible mechanism is released suddenly upon the failure of the brittle mechanism.
0 2 4 6 8 10 12 14 16 18 20 0 200 400 600 800 1000 1200 1400 1600 , mm V, k N l=2.0% l=1.5% l=1.0% l=0.7% l=0.5% tests S1M/C (a) 0 2 4 6 8 10 12 14 16 18 20 0 200 400 600 800 1000 1200 1400 1600 , mm V, k N l=2.0% l=1.5% l=1.0% l=0.7% l=0.5% tests S1M/C (b) 0 2 4 6 8 10 12 14 16 18 20 0 200 400 600 800 1000 1200 1400 1600 1800 , mm V, k N fc=90 MPa fc=70 MPa fc=50 MPa fc=33 MPa fc=20 MPa tests S1M/C
3.3 Effect of transverse reinforcement ratio
Transverse reinforcement is very effective in enhancing the shear behaviour of slender beams but its effectiveness decreases with the shear-span-to-depth ratio a/d. The influence of the stirrup ratiovon
the behaviour of deep beams is studied in Fig. 8 with the help of specimens S0M/C and S1M/C with an a/d ratio of 1.55 (Mihaylov, Bentz & Collins 2010). Specimens S0M/C were almost identical to S1M/C but had no transverse reinforcement (see Table 1). It can be noticed from the two thin blue curves that the monotonically loaded S0M was significantly weaker than the cyclically loaded S0C. Experimental observations have shown that the critical loading zone of the former specimen was significantly smaller than that of the latter. This difference has been attributed to random variations in the path of the critical diagonal cracks in the vicinity of the load (Mihaylov, Bentz & Collins 2010). To simulate possible variations in the size of the CLZ, the 2PKT analyses are performed with scaled effective widths of the loading plate lb1e. It can be seen that analyses with effective widths of 0.8lb1e
and 2lb1e(dashed blue lines) capture well the behaviour of specimens S0M and S0C, respectively. By
comparing the thin blue and red experimental lines it can be concluded that the addition of only 0.1% of transverse reinforcement in specimens S1M/C eliminated the scatter in the measured load-displacement responses.
The red, grey, green, and black curves in Fig. 8 show the predicted behaviour of beams with transverse reinforcement ratios varying from 0.1% to 1% with a constant increment of 0.3%. These curves show that v has a relatively small effect on the displacement at peak load but results in a significant
increase of shear strength and post-peak resistance. The effect on the shear strength decays and eventually vanishes asvincreases. Members with very large amounts of stirrups do not fail along a
critical diagonal crack but with crushing of the concrete along steep sections near the load (sliding shear failure). In the 2PKT this is taken into accounted in an approximate manner by limiting the reinforcement ratio to 0.15fc/fyv(see (6)).
Fig. 8 Predicted and measured load-displacement responses – specimen S0M/C and S1M/C
5
Conclusions
This paper presented a rational kinematics-based approach for predicting the complete pre- and post-peak shear behaviour of deep beams. The approach is an extension of a two-parameter kinematic theory (2PKT) for the shear strength and deformation capacity of deep beams (Mihaylov, Bentz & Collins 2013). The extended 2PKT is computationally effective as it uses only two degrees of freedom to describe the deformation patterns of a deep beam. Comparisons with experimental results showed that the computational effectiveness is combined with high accuracy in predicting the complete shear response, including the residual resistance after large imposed deformations.
The extended 2PKT was used to perform parametric studies in order to study the effect of the concrete strength and amounts of longitudinal and transverse reinforcement on the behaviour of deep beams. It
0 2 4 6 8 10 12 14 16 18 20 0 200 400 600 800 1000 1200 1400 1600 1800 , mm V, k N v=1.0% v=0.7% v=0.4% v=0.1% v=0 2lb1e lb1e 0.8lb1e test S0M S0C S1M/C
was shown that members with high-strength concrete have high shear resistance but can also exhibit very brittle snap-back failures. Increasing the amount of longitudinal and transverse reinforcement increases the peak and post-peak resistance while it has different effect on the displacement capacity. The longitudinal reinforcement decreases the displacement capacity while the transverse reinforcement increases it. Deep beams with very large amounts of transverse reinforcement fail by sliding shear failure which is approximately accounted for in the proposed approach.
References
Barbachyn, S.M., Kurama, Y.C., Novak, L.C. (2012): Analytical evaluation of diagonally reinforced concrete coupling beams under lateral loads. ACI Structural Journal, Vol. 109, No. 4, pp. 497-507.
Bentz, E.C., Vecchio, F.J. and Collins, M.P. (2006): Simplified modified compression field theory for calculating shear strength of reinforced concrete elements. ACI Structural Journal, Vol. 103, No. 4, pp. 614-624.
CSA Committee A23.3. (2005): Design of concrete structures, Canadian Standards Association, Mississauga, Ontario, Canada, 214 pp.
Eom, T.S., Park, H.G. (2010): Secant stiffness method for inelastic design of strut-and-tie model. ACI Structural Journal, Vol. 107, No. 6, pp. 689-698.
European Committee for Standardization, CEN, EN 1992-1-1 Eurocode 2 (2004): Design of concrete structures- Part 1-1: General rules and rules for buildings, Brussels, Belgium, 225 pp.
Fédération Internationale du Béton (fib) (2013): Model code 2010 for concrete structures, Ernst & Sohn, pp. 434.
Kaneko, Y., Mihashi, H. (2006): Shear softening characteristics of reinforced concrete deep beams. Finite Element Analysis of RC Structures, American Concrete Institute, SP-237-14, pp. 205-225.
Li, B., Maekawa, K., Okamura, H. (1989): Contact density model for stress transfer across cracks in concrete. J. Faculty Eng., The University of Tokyo (B), Vol. 40, No. 1, pp. 9–52.
Mihaylov, B.I., Bentz, E.C., Collins, M.P. (2010): Behavior of large deep beam subjected to monotonic and reversed cyclic shear. ACI Structural Journal, Vol. 107, No. 6, pp. 726-734. Mihaylov, B.I., Bentz, E.C., Collins, M.P. (2013): Two-parameter kinematic theory for shear behavior
of deep beams. ACI Structural Journal, Vol. 110, No. 3, pp. 447-456.
Mihaylov, B.I.: Five-spring model for complete shear behaviour of deep beams. fib Structural Concrete, accepted for publication in August 2014.
Popovics, S. (1970): A review of stress-strain relationships for concrete. ACI Journal, Vol. 67, No. 3, pp. 243-248.
Ruiz, M.F., Muttoni, A. (2009): Applications of critical shear crack theory to punching of reinforced concrete slabs with transverse reinforcement. ACI Structural Journal, Vol. 106, No. 4, pp. 485-494.
Salem H.M., Maekawa, K. (2006): Computer-aided analysis of reinforced concrete using a refined nonlinear strut and tie model approach. Journal of Advanced Concrete Technology, Vol. 4, No. 2, pp. 325-336.
Schlaich, J., Schäfer, K., Jennewein, M. (1987): Toward a consistent design of structural concrete. PCI Journal, Vol. 32, No. 3, pp. 74-150.
Scott, R.M., Mander, J.B., Bracci, J.M. (2012): Compatibility strut-and-tie modeling: Part I-Formulation. ACI Structural Journal, Vol. 109, No. 5, pp. 635-644.