The dissociative electroionization of C
2H
2, C
2D
2and C
2HD.
Investigation of the [C
2H(D)]
+and [H(D)]
+dissociation channels.
The (D)H-C
2H(D) binding energy
M. Davister, R. Locht
Département de Chimie Générale et de Chimie Physique, Institut de Chimie, Bât. B6, Université de Liège, Sart-Tilman par B-4000 Liège 1, Belgium
Abstract
The dissociative electroionization of C2H2 in the H+ and C2H+ dissociation channels has been
extensively investigated in C2H2 and C2D2. The kinetic energy distributions and ionization efficiency curves of
both species were examined in detail. The H+(D+) ion shows its lowest onset energy at 18.93 ± 0.2 eV, whereas the C2H+ is produced at 17.30 ± 0.11 eV. For the H+-producing channel, the kinetic energy (KE) versus
appearance energy (AE) diagram is obtained, extensively discussed and the bond dissociation energy D(H-C2H)
= 5.33 + 0.23 eV is estimated. This value is compared and discussed with respect to the values found in the literature. Predissociation and dissociative autoionization are the dominant H+-producing mechanisms. At high electron energies doubly ionized states of C2H2 are involved. For C2H
+
, beside the threshold at 17.30 + 0.11 eV a new onset at 18.27 + 0.10 eV is observed. These thresholds are discussed. The formation of the doubly ionized species C2H2+, observed in the mass spectrum of C2H2, is investigated. The ionization efficiency of the doubly
ionized molecular ion is observed for the first time in C2HD isotopic species.
1. Introduction
Owing to its importance in many fields, the ionization of acetylene has been investigated by most of the techniques available today. However, much less effort has been invested in the study of the dissociative ionization of this molecule.
Most of the data available on the dissociative ionization of C2H2 are related to the formation of the C2H +
fragment ion. The production of the ethynyl ion has been investigated by electron impact [1-6], dipole(e-, e-) spectroscopy [7], photoionization [8-13] and ion impact [14].
Though the two most recent measurements performed by electron impact [6] and by photoionization [11] agree, the value of the lowest onset for the appearance of the most abundant fragment ion in the C2H2 mass
spectrum ranges from 16.72 ± 0.1 eV [14] to 17.45 ± 0.1 eV [5]. Little or no translational energy is expected to be carried away by the C2H+ ion produced by dissociative ionization of C2H2. It should carry only 1/26 of the
available excess kinetic energy involved in the process. However, this quantity has never been measured directly. Recently, few of these investigations were dedicated to the examination of the formation of C2H + with the
specific aim to measure its onset energy and evaluate its heat of formation, the ionization energy and the heat of formation of the ethynyl neutral radical [9,11].
Much less attention has been paid to the formation of H+ from C2H2. Kusch et al. [1] investigated the
proton production from acetylene by the unimolecular dissociation of C2H2 induced by electron impact. The
photoion branching ratio for H+-production from C2H2 has been measured by (e-, e-+ion) coincidence
spectroscopy [7]. The collision induced dissociation of C2H2 in the H+ -producing channel has been studied by
Yamaoka et al. [4]. Threshold energies were measured in the two former studies. However, no transla-tional energy distributions of H+ were measured.
Several groups dedicated their work to the dissociative excitation of C2H2 by electron impact [15-17].
The atomic H* (through Balmer α, β and γ emissions) has been investigated and onset energies were determined in the dissociative excitation function. Only Ogawa et al. [17] were able to perform translational energy measurements as a function of the impinging electron energy and to give an interpretation of the observed thresholds.
The only dissociative photoionization work, dedicated to the investigation of the H+ formation from C2H2, has been published by Shiromura et al. [18]. The photoionization efficiency curve of H+ was measured by
using synchrotron radiation. An onset energy has been measured with the aim of estimating the dissociation energy of the H-C2H bond. In this work also the H+ translational energy has not been measured.
During the last five years, a new interest arose about the H-C2H binding energy. Beside the
photoionization work of Botter et al. [8] and Dibeler et al. [9] and the high temperature mass spectrometric work of Wyatt and Stafford [19], more recent mass spectrometric and spectroscopic work has been dedicated to evaluate this molecular parameter [20-24]. Curtiss and Pople [25] investigated this question by quantum mechanical calculations.
The aim of this work is to investigate the production of C2H +
and H+ from C2H2 by electroionization
mass spectrometry together with the ion translational energy analysis of the fragment ions. The study of the same dissociation channels in the isotopically labelled molecules C2HD and C2D2 will be useful to estimate the
internal energy carried by the neutral and/or the ionized polyatomic fragments. The H-C2H bond dissociation
energy could be discussed in more detail. In this work the results about the doubly ionized molecular ion C2HD2+
will also be presented. Doubly ionized states participate in the production of most of the fragment ions, at high electron impact energy.
2. Experimental
The experimental setup used in the present study has been described earlier [26], Only the prominent features will be mentioned here.
The ions produced in a Nier-type ion source by the impact of energy-controlled electrons are allowed to drift out of the ion chamber, are focussed on the ion source exit hole, energy-analyzed with a retarding lens and mass-selected in a quadrupole mass spectrometer. The ion current, collected on a 17-stage Cu-Be electron multiplier, is continuously scanned as a function of either the electron energy at fixed retarding potential VR or
the retarding potential at fixed impinging electron energy Ee. Both signals are electronically differentiated. The whole experiment is interfaced with a minicomputer [27] controlling the most important experimental parameters.
The non-deuterated acetylene, of 99.997% purity, purchased from Messer Griesheim in a high pressure cylinder, was mixed with 1% acetone. This mixture was used without further purification. Acetylene-d2 and
acetylene-d1 were purchased from Merck, Sharp & Dohme. These samples, exempt from acetone, of one liter at
1 aim, of 99 and 93 at% respectively, were also used without further purification.
Great care has been taken to keep the background mass spectrum as low as possible. Prolongated bake-out of the vacuum chamber is regularly practiced to keep the residual pressure at abbake-out 2 X 10⁻⁸ Torr. The sample is introduced at a pressure of 10-6 Torr.
The maximum of the C2H+2 ion energy distribution is used as the zero-energy calibration point for the
translational energy scale. The same reference has been used during the recording of the ionization efficiency curves of the fragment ions at different retarding potential settings.
For the electron energy scale calibration, the first adiabatic ionization energy of N2 at 15.581 eV [28]
and the first appearance energy of N+ at 24.294 eV [28], have been used in this part of the work, no m/e
interference existing between N+ or N2+ and H+ or C2H +. The linear extrapolation method, as described
previously [26], is used to determine the threshold energies.
3. Data acquisition and handling. Error estimation
For each fragment ion, at each retarding potential or electron energy setting, the first differentiated ionization efficiency curve or retarding potential curve is recorded and averaged over 5-70 hours (80-1200 scans), depending on the ion intensity. This procedure is repeated at least five times to ensure reproducibility and to estimate the error on the threshold energy determinations. The curves presented in the next section are the average of these at least five independent experiments. The threshold energies and translational energies reported in the following sections are averaged values of these independent measurements. The quoted errors and drawn error bars represent the standard deviation.
In the ion kinetic energy versus appearance energy diagrams, linear regressions are fitted to the data. This method provides two parameters, important in this work, i.e. the slope and the extrapolation to zero kinetic
energy. The correlation coefficient, usually calculated on the linear regression, provides an estimate of the validity of the fit. It does by no means give any estimate of the error on the two parameters of the straight line.
Recently several methods have been described for the calculation of the error on the extrapolation and the slope [29-32]. It is assumed that [30] (i) the experimental error essentially occurs in only one dimension, e.g. the "y" direction (i.e. the appearance energy), (ii) the errors are normally distributed (Gaussian distribution) and (iii) the errors in the "y" dimension are independent of the "X"values (i.e. the retarding potential). In the present experiment, this means that the error on the appearance energy (AE) is independent of the value of the retarding potential setting VR. This assumption is valid over a wide range of VR. However, for high VR values, the
signal-to-noise ratio decreases dramatically and the AE is measured with much less accuracy. In this range this assumption is more questionable.
With these assumptions, defining the correlation coefficient r,
of the fit of the linear regression y = ax+ b to the experimental data, it has been proved [ 30] that the standard deviations σa on the slope "a" and σb on the extrapolation "b" are given by the expressions
When the experimental values of "a" and "b" have to be compared with their respectively expected values, the confidence limit (fixed at 95%) is calculated by using the Student's significance test [31], i.e.
where F(t) is tabulated [33] as a function of then n-2 degrees of freedom of the linear regression.
4. Experimental results
4.1. The double ionization of C2H2
As will be seen in the following sections, particularly for high impinging electron energies, almost only the doubly ionized states of C2H2 will account for the dissociative ionization processes observed in several
reaction channels. Therefore the ionization efficiency of C2H22+ has been carefully investigated. Owing to the
interference of m/ e = 13 or 14 (CH+ or CD+ ) with m/e = 13 or 14 (C2H2 2+
or C2D2 2+
) the double ionization has been investigated by using C2HD.
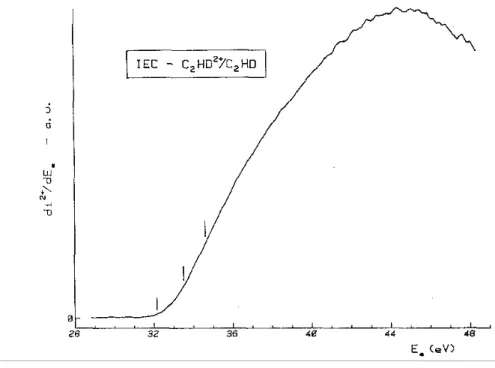
The first differentiated ionization efficiency curve of C2HD is displayed in Fig. 1 where the vertical bars
locate the double ionization energies at 32.2 ± 0.2, 33.5 ± 0.1 and 34.6 ± 0.3 eV. No ionization energy has been detected for higher electron energies presumably because the doubly ionized states are essentially dissociative at these energies.
4.2. The H+(D +) dissociation channel
The measurements on this dissociation channel were performed using both C2H2 and C2D2 for
essentially two reasons. First, any confusion has to be avoided between H + from C2H2 and H+ originating from
residual H2O in the vacuum vessel in spite of all precautions mentioned in Section 2. H+ from H2O has a large
cross section whereas H+/C2H2 has a fairly low intensity. Confusion has also to be avoided with H + from acetone
which is absent in the C2D2 sample. Secondly, the iso-topic substitution of H by D often generates a measurable
isotope effect observed in the kinetic energy versus appearance energy diagrams. This observation gives information about the dynamics of the considered dissociation channel [ 34,35 ].
Fig. 1. The first differentiated ionization efficiency curve of C2HD2+ /C2HD recorded between 28 and 49 eV. Vertical bars locate the average onset energies.
4.2. The H+(D +) dissociation channel
The measurements on this dissociation channel were performed using both C2H2 and C2D2 for
essentially two reasons. First, any confusion has to be avoided between H + from C2H2 and H+ originating from
residual H2O in the vacuum vessel in spite of all precautions mentioned in Section 2. H+ from H2O has a large
cross section whereas H+/C2H2 has a fairly low intensity. Confusion has also to be avoided with H +
from acetone which is absent in the C2D2 sample. Secondly, the iso-topic substitution of H by D often generates a measurable
isotope effect observed in the kinetic energy versus appearance energy diagrams. This observation gives information about the dynamics of the considered dissociation channel [ 34,35 ].
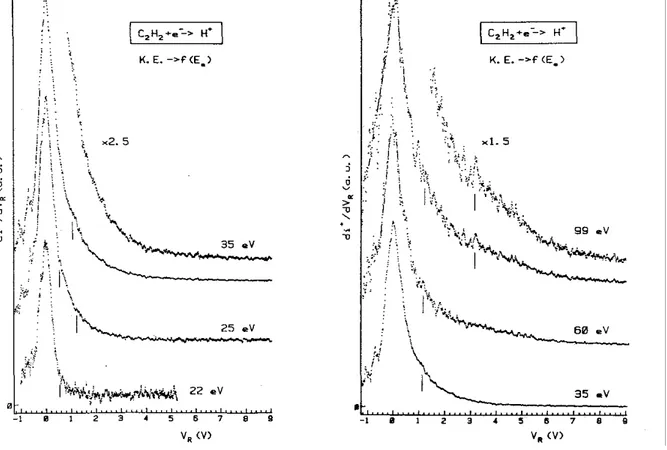
Kinetic energy distributions of H+, as given by the first differentiated retarding potential curve, are represented in Fig. 2 for different impinging electron energies ranging from 22 to 99 eV.
The translational energy distribution of H+ shows three components. A fairly sharp peak corresponds to H+ ions carrying thermal energy only. However, at 22 eV a higher translational energy contribution is already present at about 0.2 eV. Within reasonable time, it was not possible to measure H + kinetic energy distributions below 22 eV, i.e. closer to the lowest threshold. The intensity of the contribution at 0.2 eV ion energy increases with the electron energy. For 25 eV electrons a shoulder (better observed up from 35 eV electron energy) shows up for 1.2 eV protons. For electron energies higher than 50 eV, e.g. 60 and 99 eV electron energy, a broad distribution peaking at around 3 eV and spreading to ion energies higher than 10 eV, is observed.
The kinetic energy distributions observed for D+ as a function of the electron energy show no marked differences with those observed for H+ and are therefore not reproduced here.
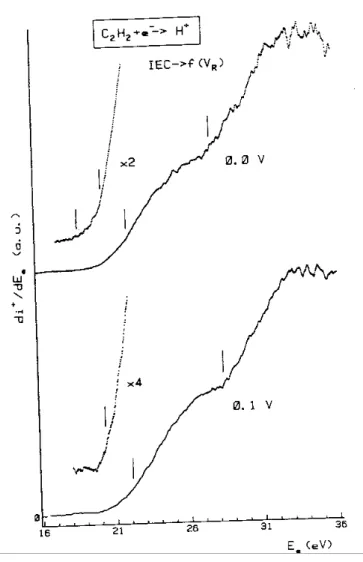
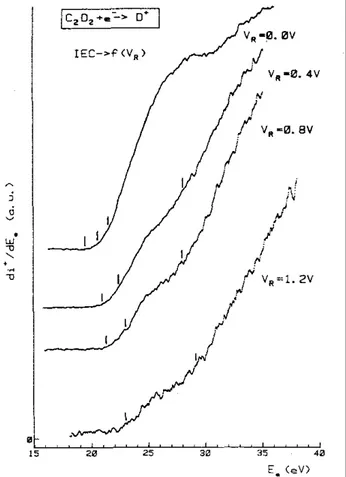
Averaged first differentiated ionization efficiency curves of H + are recorded for different retarding potential settings, ranging from 0.0 to 10.0 V. Samples of these curves are displayed in Figs. 3 and 4. The first differentiated ionization efficiency curve recorded at 0.0 V retarding field shows four threshold energies (see Fig. 3), i.e. at 18.8 ± 0.2, 20.3 ± 0.4, 21.4 ± 0.4 and 27.8 ± 0.2 eV. From Fig. 3 it is obvious that the first onset energy of H+ at 18.8 ± .2 eV is detected only when no retarding field is applied, showing these protons being strictly thermal.
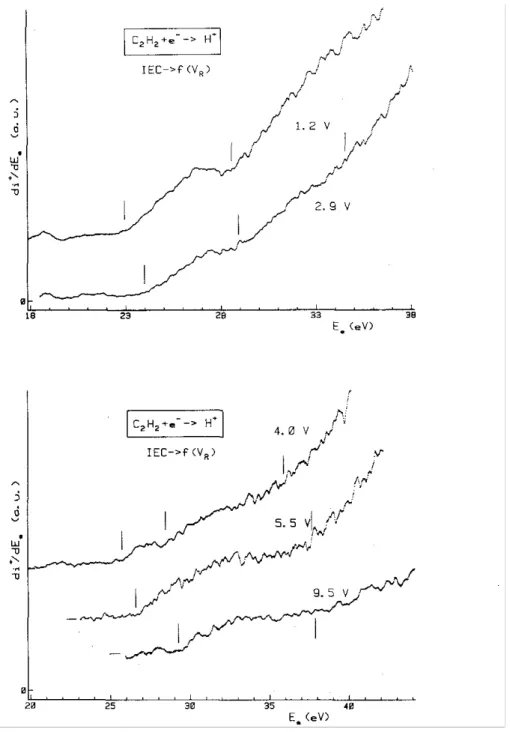
Figs. 3 and 4 also show how the onset energies shift with increasing retarding fields. The result of the systematic measurement of the appearance energies (AE) as a function of the retarding potential settings (VR),
Section 3). The vertical lines at 23.5 ± 0.3, 25.6 ± 0.2, 28.4 ± 0.2 and 37.4 ± 0.5 eV are drawn at the calculated average energy value, including all measured onsets.
The first differentiated ionization efficiency curve of D+ from C2D2 has been recorded at different
retarding potential settings at VR = 0.0-1.2 V by 0.1 V steps, as shown in Fig. 6. Appearance energies are
measured at 19.3 ± 0.1,20.5 ± 0.2 and 21.4 ± 0.2eV. At VR = 0.3V an onset at 28.3 ± 0.2 eV becomes easy to
observe. The result of the measurements of the onset energies at different retarding potential settings is shown in Fig. 7 where the corresponding appearance energies of H+ have been included for comparison.
Fig. 2. The first differentiated retarding potential curves of H+ /C2H2 as observed at different impinging electron energies ranging from 22 to 99 eV. Vertical lines locate distributions maxima.
4.3. The C2H + (C2D +) dissociation channel
The C2H
+
and C2D +
ions have been investigated in C2H2 and C2D2 respectively. The ion translational
energy and the first differentiated ionization efficiency curves of both ions have been recorded.
The kinetic energy distribution of C2H + (or C2D+) is identical to the thermal distribution observed for
C2H2+ (or C2D2+ ) at electron energies scanned between 18 and 99 eV. This implies that the C2H+ ions carry less
than 10 meV translational energy. If kinetic energy is involved in the dissociation process producing C2H +
(or C2D
+
), the ion would carry only 1/26 (or 1/14) of the total available translational energy. To measure this quantity, it would be more appropriate to measure the kinetic energy of the neutral H atom, e.g. after ionization.
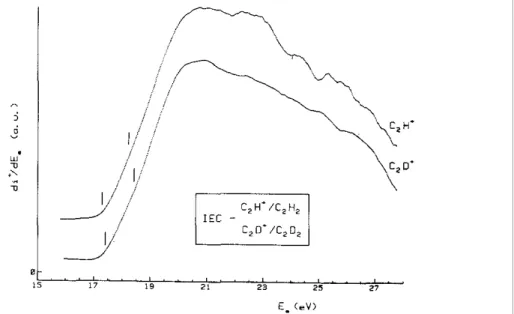
The first differentiated ionization efficiency curves of C2H+ and C2D+, measured without application of
a retarding field, are reproduced in Fig. 8. The two curves show slight differences in shape. These could be ascribed to the isotopic substitution. In the ionization efficiency of the C2H + ion, two threshold energies are
measured: at 17.30 ± 0.08 and 18.27 ± 0.11 eV. The corresponding ion in C2D2 appears at 17.38 ± 0.11 and
Fig. 3. A sample of first differentiated ionization efficiency curves of H+/C2H2 for 0.0 V and 0.1 V retarding potential setting. The absence of the threshold at 18.8 eV for VR = 0.1 V is clearly shown.
4.4. The C2H2+ dissociation channel
The mass spectrum of C2H2 recorded with 99 eV electrons shows a number of doubly ionized species.
Beside C2H22+ ,already mentioned as being identified and analyzed in C2HD, C2H2+, CH2+ and C2+ are detected.
The most intense and measurable species is C2H 2+
: its first differentiated ionization efficiency curve could be measured with a fairly good signal-to-noise ratio. Fig. 9 shows the average curve obtained from 12 different experiments. For this ion also no translational energy has been observed.
5. Discussion
For ease and clarity in the following discussion, all the data used in this work to calculate threshold energies for dissociative excitation and dissociative ionization processes giving rise to C2H+ and H+ are gathered
in Table 1.
The C2H2 molecule belongs to the D∞h symmetry group and the electronic configuration of its ground vibronic state X1Σg+ is given by
Three ionic states are observed in the He(I) photoelec-tron spectrum. The adiabatic ionization energies are measured at 11.403 eV for the X2Πu state, 16.297 eV for the A2 Σ g
+
state and 18.391 eV for the B 2 Σ u +
[43]. The He(II)-photoelectron spectrum shows two more bands with a vertical ionization energy at 23.6 and at 27.6 eV [44] successively. The threshold pho-toelectron spectrum obtained by using synchrotron radiation [45] shows the existence of Rydberg states autoionizing to the C2H2
+
(X2Πu) state over an extended energy range outside of the Franck-Condon region corresponding to the direct ionizing transition. A structureless autoionizing state starting at 21 eV is also clearly observed.
5.1. The double ionization of C2H2 (C2D2 and C2HD)
For the reason mentioned earlier, the first differentiated ionization efficiency curve of C2H22+ could only
be investigated in C2HD. To our knowledge, this is the first time that the ionization efficiency (and its first
derivative) has been recorded for C2H2 2+
. To a very good approximation, the first derivative (see Fig. 1) of the electroionization efficiency is comparable to the photoionization efficiency [46]. Three double ionization energies are measured at 32.2 ± 0.2,33.5 ± 0.1 and 34.6 ± 0.3 eV successively.
The earlier determinations of the double ionization energies have been provided by indirect methods, i.e. double charge transfer spectroscopy [47,48] and single electron transfer reactions [49]. By photoionization, the double ionization of C2H2 has mainly been investigated through the dissociation of doubly ionized states
[50,51] by using the photoion-photoion coincidence technique. Auger electron spectra of C2H2, involving doubly
ionized states, have also been observed [52,53]. Several theoretical calculations have been devoted to the study of C2H2
2+
[48,49,54-57]. Both experimental and theoretical results related to C2H2 2+
are summarized in Table 2. Excepting the work of Appell et al. [47], most experimental data agree within experimental error. The first double ionization energy at 32.2 ± 0.2 eV can unambiguously be ascribed to the ground 2-hole (1πu
-2
)3Σg -state.
In the present work a second double ionization energy has been measured at 33.5 ± 0.1 eV. Appell et al. [47] observed their lowest double ionization energy of C2H22+ at 33.7 ± 0.5 eV, whereas Andrews et al. [48] and
Appling et al. [49] do not mention any ionization energy in the 33-34 eV range. The theoretical description of C2H2
2+
shows (see Table 2) the existence of two states, derived from the same (1πu -2
) electronic configuration as the ground state, i.e. 1∆g and 1Σg
+
first and second excited state of C2H2 2+
respectively. The energy separation of these two states is estimated to be of about 0.6 eV [51,56,57] and not resolved in the present experiment. From the theoretical predictions of Ohrendorf et al. [57] the 1∆g state could be assigned to the 33.5 eVonset.
The third double ionization energy is determined at 34.6 ± 0.3 eV. The other experiments observed doubly ionized states at higher energies only, i.e. above 38 eV. However, all theoretical calculations predict a 3Πu (and/or 1Πu) state below 38 eV (see Table 2) derived from the 3σg-1 1πu-1configuration. From the theoretical
work of Ohrendorf et al. [57] the 34.6 eV onset could be assigned to the 1Σg (1πu-2) state, calculated at 34.6 eV
(see Table 2).
The study of the different dissociation channels of C2H22+ could help to (i) locate in energy and (ii)
identify the symmetry of the involved C2H2 doubly ionized states.
No double ionization energy is observed above 35 eV in the first differentiated ionization efficiency curve. This could be ascribed to the combined effect of three different causes: (i) the fairly high density of states in this energy range (see Table 2), (ii) the threshold law related to the double ionization phenomena (succession of straight lines) and finally (iii) the lifetime with respect to dissociation of the higher excited states of C2H22+ .
5.2. The H+(D +) dissociative ionization channel
Except when otherwise stated, H + and D + will be discussed together in the following discussion. The first onset of H+ is determined at 18.83 ± 0.23 eV whereas for D+ it has been observed at 19.2 + 0.2 eV (see Figs. 3 and 4). In C2H2 this onset corresponds to only one point in the kinetic energy (KE) versus
appearance energy (AE) diagram. This implies that the H+ ions are only produced without initial kinetic energy at this threshold energy. In C2D2 the first onset is observed between 0.0 and 0.2 eV translational energy,
corresponding to 0.21 eV total kinetic energy involved in the production process. Taking into account this amount, the onset for D+ produced with RE = 0.0 eV would be at 19.2( ± 0.2) - 0.2 eV= 19.0 ± 0.2 eV. This energy agrees within experimental error, with the onset of H+ /C2H2. However, the difference in the KE versus
AE diagram at this energy would mean that H+ and D+ could be produced by the same dissociative ionization process through a mechanism which should be rather sensitive to isotopic substitution.
The agreement between the two onsets also indicates that the H+ detected at 18.83 eV is produced by the dissociative ionization of C2H2. The proton production could be suspected to come from H2O where it is
measured at about the same energy, i.e. 18.7 eV. However, the KE versus AE diagram related to this species extends from 0.0 to 1.2 eV translational energy [58]. The observation of D + at the same energy as H + would
also exclude acetone as a possible perturbing proton source at 18.8 eV.
The present electron impact results could only be compared with those obtained by the same method by Kuschetal. [1] who observed the lowest onset of H+ at 21.7 ± 1.0 eV. In their more recent photoionization work, Shiromuraetal. [18] determined the lowest H+ appearance energy at 19.35 ± 0.05 eV. This value is surprisingly higher than that obtained by electron impact. However, for the threshold determination, the authors mention difficulties with the background, due to the contribution of second order light.
In the dissociative excitation by electron impact, Balmer-β emission has been observed by Beenakker and De Heer [15]. The lowest threshold is determined at 20.6 ± 1.0 eV. Pang et al. [16] measured the first onset for Lyman-β emission at 16.3 eV whereas for the Lyman- β line the threshold is measured at 21.0 eV. In these experiments the translational energy has not been measured. In the excitation function of H* (n = 4) Ogawa et al. [17] mentioned the first onset at 20.8 ± 1.0 eV and related this energy with hydrogen atoms carrying 0-2 eV translational energy. All these data have to be related with higher energy proton-producing processes.
To calculate the lowest threshold energy for the H + production from C2H2, i.e. through the reaction
one needs the value of the dissociation energy D(H-C2H).
The present experiment provides (i) the transla-tional energy, i.e. KE = 0.0 eV, (ii) the threshold energy taken to be 18.93 ± 0.20 eV, i.e. the average between 18.83 eV, observed for H+ and 19.03 eV corresponding to D+ without KE. At the onset the radical C2H (X2Σ+) is supposed to be formed without internal energy.
Subtracting the ionization energy of H (see Table 1) from the above-mentioned onset, the dissociation energy D(H-C2H) = 5.33 ± 0.20 eV is obtained. This value has to be compared with earlier values gathered in Table 3.
Both fragments, in their ground electronic state specified in reaction (1), correlate with a 2Σ+ state of
C2H2+ only [37]. In the energy range of interest the C2H2+ (B 2Σu+) state is available for being populated by
Franck-Condon transition from the neutral molecular ground state. On the other hand, the lower-lying A 2Σg+ (or
A 2Ag in the C2h symmetry) could converge to the dissociation limit at 18.9 eV. However, at 18.9 eV the C2H2+
(B 2Σu +
) state exhibits a complex vibrational structure analyzed by Reutt et al. [43]. In C2D2 the corresponding
state shows a more complex structure and the vibrational envelope differs drastically from that observed in C3H2
[43]. On the other hand, the photoelectron spectrum of the A 2Σ g+ state extends from 16.297 to 18.2 eV. A first examination clearly shows that the B 2Σu
+
photoelectron band does not show the regular Franck-Condon profile for the intensity distribution in the vibrational structure. Line shapes are erratic and the intensities are randomly distributed. Also in this respect, marked differences are observed between C2H2
+
and C2D2 +
. These observations are strong indications for the presence of a predissociation as the most probable mechanism for H+(D + ) production at 18.9 eV. Reutt et al. [43] investigated the decay of the C2H+2 (B) state. They suggest a
strong multimode vibronic coupling between the B 2Σu +
and the A 2Ag surfaces, as described by Köppel et al.
[59]. A strong coupling between the B state and the continuum of the A state could be expected.
The explanation of the isotope effect observed on D + would need a precise description of the B 2Σu +
and the A 2Ag hypersurfaces in the vicinity of the dissociation limit. It could be suggested that the predissociation
of C2H+2 (C2D2+) B 2Σu+ occurs by tunneling through a barrier [60]. In that case, for an equal dissociation
lifetime, the D+-ρroducing level lies higher, with respect to the dissociation limit, than the H+-producing level. This would give rise to D+ ions carrying a larger amount of translational energy.
The second onset of H+ is observed at 20.3 ± 0.4 eV and its KE versus AE diagram is accounted for by the straight line (2) in Fig. 5. The correlation coefficient for this linear regression being 0.994, the extrapolation at KE = 0.0 eV ( with the expected slope 25 /26 = 0.96 ) is 19.82 ± 0.08 eV and the slope is 0.34 ± 0.01. For D +, the corresponding onset is observed at 20.5 ± 0.2 eV and its KE versus AE diagram is shown in Fig. 7. A vertical line extending up to 0.3 eV translational energy is followed by a straight line with a slope of 0.9 ± 0.1 and extrapolating to 20.4 ± 0.12 eV. The errors on both parameters are fairly large because the correlation coefficient
is only 0.86.
The appearance energy at 19.82 ± 0.08 eV would correlate with the photoionization onset at 19.35 ± 0.05 eV [18]. However, the protons at 19.8 eV are known to carry no translational energy. The average threshold, measured for H*(n = 4) atoms production by dissociative excitation by electron impact [15-17] is 20.7 ± 1.2 eV. If the "core-ion model" is valid [61], the corresponding dissociative electroionization onset would be measured at 20.7 (± 1.2) +0.85=21.55 ± 1.2 eV (see data in Table 1 ) which is at the boundary of the error limits. For these H*(n = 4) atoms, Ogawa etal. [17] measured translational energies 0.0-2.0 eV as deduced from the Doppler profile of the Balmer-/BETA lines. In the present experiment protons belonging to the likely corresponding threshold carry 0.0-1.0 eV translational energy.
Fig. 4. A sample of first differentiated ionization efficiency curves of H+ /C2H2 as observed for retarding potential settings ranging from 1.2 to .9.5 V. Vertical bars locate the average onset energies.
Fig. 5. The KE versus AE diagram of H + /C2H2 obtained for 17-42 eV electron energy. The encircled numbers are used for the discussion (see text). The length of the error bars is equal to the standard deviation.
Fig. 6. A sample of first differentiated ionization efficiency curves of D + /C2D2 for retarding potential settings ranging from 0.0 to 1.2 V. Vertical bars locate the threshold energies.
Fig. 7. The KE versus AE diagram for D + /C2D2 obtained between 0.0 and 1.2 V retarding potential. The encircled numbers refer to the same processes observed for H+/C2H2. Open circles refer to H+ and full dots are related to D + . The length of the error bars is equal to the standard deviation.
Fig. 8. The first differentiated ionization efficiency curve of C2H+ /C2H2 and of C2D + /C2D2 as observed without retarding field. The vertical bars are located at the average onset energies.
Table 1: Dissociation (D), ionization (IE), excitation (EE) energies and electron affinities (EA) (eV) of C2H2, C2H, C2, CH, H2, C and H used in this worka
D(C2H-H)=5.33 ±0.20 b EE(CH,a4Σ-)=0.72d D(HC-CH)=9.88C EE(CH,A 2∆)=2.87d D(C-H) = 3.465 d EE(C,1D) = 1.264 e D(H-H) =4.476d EE(C,1S)= 2.684 e D(H-C2)=4.85±0.31 f EE(H, n = 2) = 10.210e IE(H) = 13.598 c EE(H, n = 3) = 12.087e IE(C) = 11.264e EE(H, n = 4) = 12.748e IE(C) = 10.64 s EA(C2H)=2.969 ± 0.010i IE(C2) = 12.15" a 1 eV = 23.060 kcal mol-1 = 8065.73 cm-1. b
As measured in this work: see discussion in Section 5.4.
c
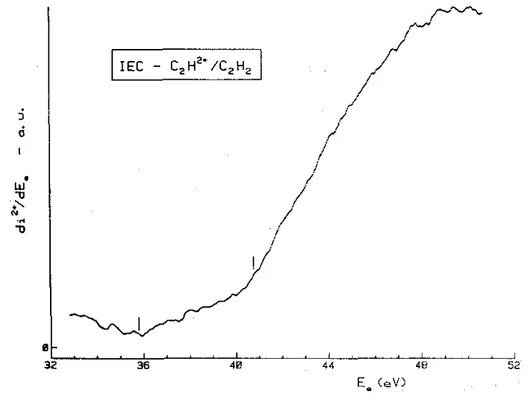
Fig. 9. The first differentiated ionization efficiency curve of C2H2 + /C2H2 as observed without retarding potential. Vertical bars locate onset energies.
Table 2: Experimentally measured and theoretically predicted double ionization energies (eV) of C2H3
Experimental results
This work DCT SETR DCT
(EI) (Ref. [47] ) (Ref. [49] ) (Ref. [48] )
32.2 ± 0.2 - 32.7 32.7 ± 0.3 33.5 ± 0.1 33.7 ± 0.5 - - 34.6 ± 0.3 - - 37.9 ± 0.4 38.5 ± 0.7 - - - - 39.6 ± 0.5 45.5 ± 1.0 - - Theoretical predictions
Ref. [56] Ref. [57] 3 Ref. [48] a Ref. [51]
32.82 (1∆g) 32.70(3Σg-) 32.7 (3Σg-) 32.0 (3Σg-) 33.37 (1Σg+) 33.97 (1∆g) 33.8('∆g-(1Σg+) 32.9 (1∆g)
36.63 (1Πg) 34.59 (1Σg+) 37.8 (3Πu) 33.5(1Σg+) 37.05 (3Πu 38.10 (3Πu) 38.7 (1Πu) 37.1 (3Πu) 37.67 (1Πu) 39.00 (1Πu) 40.0 (3Πg) 37.8 (1Πu) 38.16 (1Πu) 39.50 (3Πg) 40.8 (1Πg) 38.7 (3Πg) 38.86 (3Πg) 41.00 (1Πg) 44.2-45.0 39.2-39.7 39.53 (lΠg) 44.70 (1Σg+) 3Σu+,3Πu, 1Σg+ (1,3Σu,3∆u)
41.3-43.9 40.2 (1Πg)
(1Σg+) 44.5 (1∆u)
EI: electron impact mass spectrometry. DCT: double charge transfer spectroscopy. SETR: single electron transfer reaction.
Taking the average onset at KE(H+ /D+ ) = 0.0 eV for both isotopic species, the energy difference between the two first thresholds is 20.1( ± 0.3) -18.9( ± 0.1) = 1.2 ± 0.4 eV. This energy difference could be ascribed to the vibronic excitation of the C2H radical.
Several quantum mechanical calculations were devoted to this species. So and Richards [62] obtained the first excited state at 1.23 eV above the ground state. Shih et al. [63,64] determined the first excited state at 0.96 eV using an ab initio configuration interaction method [ 63 ] or 0.5 eV using an ab initio multireference double excitation method [64]. For the same state Hillier et al. [65] calculated an excitation energy of 0.67 eV. Using a different calculation method, i.e. an ab initio at Hartree-Fock level, Largo and Barrientos determined the first excitation energy to be between 0.11 and 0.37 eV. Koures and Harding [67] made a large scale MCSCF/MRSDCI calculation and predicted a vertical A 2Π-X 2Σ+ excitation energy of 0.67 eV. All calculations
agree to predict the first excited state having a 2Π symmetry. Graham et al. [68] reported the optical (3500-10000 Å) and ESR spectra of C2H excited species in a solid argon matrix. They observed a vibronic
excited state at 1.23 eV (9920 cm-1) above the ground state, in very good agreement with the earliest theoretical predictions [ 62,63 ]. Later, the same author [69] made aFTIR study of D and 13C substituted C2H, produced by
vacuum UV photolysis of acetylene. The A 2Π-X 2Σ+ transition is reported in this work at 4020 cm-1 (0.498 eV). No explanation is provided for the discrepancy and/or the earlier observation at 9920 cm-1. Carrick et al. [70] investigated the gas phase C2H by color center laser spectroscopy and measured the A
2Π excitation energy at
3692 cm-1 (0.458 eV). Although there is a discrepancy between the theoretical predictions and the experimental observations, it could be suggested that in the present determination, at 20.1 eV the reaction
would be involved.
The slope observed for the straight line (2) related to this process is 0.34 + 0.01, whereas the expected slope is given by the ratio mC2H/mC2H2 = 25/26 = 0.96. This large difference has to be ascribed to the partitioning
of the total excess energy, with respect to the dissociation energy level, between translational energy of the two fragments and internal energy of C2H. If in reaction (2) the neutral radical C2H is formed in its vibrational
ground level at the threshold, at 22.8 eV electron energy it carries 1.0 eV translational energy and 1.8 eV internal energy. This would mean that C2H could be excited up to e.g. υ = 4 of its stretching mode v1=3610 cm
-1
(0.45eV) [70].
If the dissociation process in C2D2 at 20.5 eV runs over an identical mechanism, the expected isotope
effect on the C2D radical should be a lowering of the slope [34-36]. In fact, the slope is 0.9 ± 0.2, close to the
expected slope of 26/28 = 0.93. No internal energy is carried by the C2D radical when reaction (2) takes place in
C2D2. Both fragments in their specified electronic state could only be correlated with a C2H2+ (2Π) state. The
only known 2Π state correlates with C2H+ (3Π) + H(2Sg) fragments, as will be mentioned in Section 5.3, and
corresponds to the C2H2 +
(X2Πu) state. Furthermore, in C2H +
2 the B 2Σu+
photoelectron band spreads from 18.2 to 20.1 eV where the vibrational structure suddenly disappears [43]. This observation could suggest that reaction (2) would occur through a predissociation mechanism. Though the signal is fairly low for C2D2, the B 2Σu+
photoelectron band vanishes smoothly for higher energies, i.e. at about 20.3 eV. This difference in aspect of the photoelectron bands could be related to the unexpected isotope effect for D+. A more accurate explanation would need a more precise description of the hypersurfaces near the dissociation limit.
On the other hand, as stated by Reutt et al. [43], by changing the geometry from D∞h → C2h, the B 2Σu+
correlates with a 2A1 state. The vibronic coupling between the B 2
A1,A 2
A1 and the X 2
A1, states would lead to
the perturbations observed in the photoelectron bands and could also give rise to predissociation.
The straight lines (3) in both KE versus AE diagrams related to H+ (see Fig. 5) and D+ (see Fig. 7) are quite different. The threshold energies at KE(H+ / D+) = 0.0 eV are 21.4 ± 0.4 eV and 21.46 ± 0.22 eV respectively. The linear regressions calculated on the experimental data provide a slope of 0.22 ± 0.02 and 0.37 ± 0.01 with correlation coefficients of 0.96 and 0-998 for H+ and D+ respectively.
This threshold at 21.45 eV would better fit with the lowest dissociative excitation onsets, i.e. at 20.6 ± 1.0 [15],21.0 ± 1.0eV [16] and 20.8 ± 1.0eV [17] (see data in Table 1). The only dissociative electroioniza-tion result of Kusch et al. [1] at 21.7 ± 1.0 eV is in very good agreement with the present threshold energy. However, the protons (deuterons) involved in this process carry only 0.0-0.5 eV translational energy. As already mentioned Ogawa et al. [17] measured H* (n = 4) atoms carrying 0.0-2.0 eV kinetic energy.
Table 3 : Experimental methods and the obtained bond dissociation energies D(H-C2H) (eV)
The energy difference between this threshold and the lowest appearance energy of H+ is 21.4(± 0.3) - 18.9(± 0.2) = 2.5 ± 0.5 eV. This amount is still too low to involve the dissociation of the C2-H bond (see Table
1). This energy should correspond to the vibrortic excitation of the ethynyl radical. The only experimental evidence reported on the existence of a second excited state of C2H is the spectroscopic study of this radical
trapped in a solid Ar-matrix [68]. A band system starts at 3405 Å (3.64 eV) and is tentatively ascribed to a B 2 Σ -X2 Σ transition. By quantum mechanical calculations, the nearest doublet above the 2Π state is predicted to be a
2
A' at 4.68 eV above the X 2Σ+ [64] or a 2Σ+ at 7.32 eV [67] above the ground state. At lower energy, the same calculations show the existence of several quartet states, e.g. a 4Σ+ and a 4A" at 3.3 eV and 3.5 eV respectively
[64] or a 4Σ+ , 4∆ and 4Σ- at 4.94 eV, 6.22 eV and 6.91 eV respectively. Consequently, it seems to be reasonable to ascribe the onset at 21.4 eV to the reaction
Both fragments correlate only with a C2H+2 quartet state.
In the energy range of 21.5 eV, the He(II)-photo-electron spectrum shows no ionization cross section. The dissociation channel opened at this energy should run over an autoionizing state. The threshold photoe-lectron spectrum of C2H2, recorded with dispersed synchrotron radiation [45] clearly shows a structureless band
starting at 21.0 eV and showing a maximum at about 22.5 eV. This state could be a member of a Ryd-berg series converging to the C2H2
+
(C) state, and which could have a singlet or triplet multiplicity. Its autoionization could populate a C2H2+(4Σ+) state, outside the Franck-Condon region from the C2H2 ground state, which dissociates at
Between 23.5 and 27.0 eV electron energy, the KE versus AE diagram is related to high energy protons distributed between 3.5 and 6.0 eV translational energy. This diagram clearly indicates the opening of two H+ -producing channels, i.e. at 23.5 ± 0.3 eV and at 25.6 + 0.2 eV successively. Both vertical lines converge to the straightline (4) extrapolating to 19.6 ± 0.2 eV for KE(H+) = 0.0 eV with a slope of 0.81 ± 0.02 as obtained by
calculating the linear regression on only five data points.
The extrapolation energy of 19.6 ± 0.2 eV is in fairly good agreement with the extrapolated appearance energy of 19.82 ± 0.08 eV obtained earlier. These facts indicate unambiguously that at 23.5 eV and at 25.6 eV the same dissociation level is involved in the processes observed at these energies.
The slope of 0.81 seems to be lower than the expected value of 0.96. With a confidence limit fixed at 95% the slope should be included in the interval of 0.75-0.87. A partial excess energy conversion into internal energy of the C2H radical should occur. However, only five data points define the linear regression.
In this electron energy range Kusch et al. [1] observed also a new dissociative electroionization process with an onset at 25.6 ± 1.0 eV, in very good agreement with the present result. Cooper et al. [7] measured an appearance energy of 27.0 ± 1.0 eV for H+. By the investigation of the Balmer-Remission and the Doppler profile of the emission line, Ogawa et al. [17] observed an onset at about 30.0 eV for H* (n = 4) atoms carrying 3-5 eV translational energy. Pang et al. [ 16] observed a threshold at 30.0 eV for the Lyman-β emission from dissociative excitation of C2H2. It is very likely that these latter onsets have to be related with higher energy
proton-producing processes.
From the present measurements, it follows that the dissociative ionization process involved at 23.5 and 25.6 eV has to be
where the two partners of the dissociation have to be in the same electronic state as for reaction (2).
The threshold at 23.5+0.3 eV corresponds to the vertical ionization energy of the last valence orbital 2σg
of C2H2. The C2H2+(C2Σ+g) state is observed in the He(Π) photoelectron spectrum at 23.5 eV [44,71]. The
X-ray-excited valence-electron spectra [72-74] show an intense band for a vertical ionization energy of 23.5 eV and is ascribed to the 2σg ionization [72]. Using the same technique, vertical ionization energies are observed at 26.6,
28.0, 29.9, 31.2 and 33.4 eV successively [ 72 ]. These bands are assigned to satellite lines. At least one of these lines, e.g. at 26.6 eV, could be correlated with the ionic state of C2H2 giving rise to the dissociative ionization
process observed at 25.6 ± 0.2 eV. Quantum mechanical calculations showed that the 26.6 eV line has to be ascribed essentially to a 2Σg+ state with (2σu)-1( 1πu) -1(1πg)l configuration.
The probable dissociation mechanism involved in reaction (4) would be the predissociation of the C2H2 +
(C 2Σg+) up from 23.5 eV and of a second 2Σg+ up from 25.6 eV. The predissociating state could only be the 2Π state which converges to the 19.6 eV dissociation level.
The vertical straight line (5) extends from 0.0 to 10.0 eV translational energy and is related to the threshold observed at 28.4 ± 0.2 eV. At this energy, protons carrying at least 10.0 eV kinetic energy are produced by a process involving (26/25) x 10.0 = 10.4 eV total excess energy. The dissociation level would at least lie at 28.4 - 10.4 = 18.0 eV when no internal energy is considered. This value is 0.8 eV lower than the lowest appearance energy measured for H + . Therefore, the protons with their onset at 28.4 eV are suspected to be produced, at least partially, by dissociative ionization of an impurity, e.g. acetone, water present in the background or H2 produced by thermolysis of C2H2 on the electron emitting filament. The two latter proton
sources can be discarded on the basis of the following arguments.
Though H + /H2 has an appearance energy at 18.0 eV, its KE versus AE diagram has been investigated
in detail by Köllmann [75]. Protons of 3.0-8.0 eV translational energy have been observed and the diagram is a straight line with a slope of 0.5. Vertical lines are observed at 23.5+0.7, 26.6 ± 0.5 and 27.7 ± 0.6 eV extending
at most up to 4.0 eV kinetic energy.
As already mentioned, H+/H2O has been investigated by Appell and Durup [58]. For energies of
27.0-31.5 eV a straight line is observed between 1.0 and 4.2 eV kinetic energy. This straight line is characterized by a slope of 0.67 and extrapolates at 25.5 ± 0.5 eV.
The only remaining, and most probable proton source, is acetone. As far as we know, the H + formation from acetone has not been investigated. However, using thermodynamical cycles one is able to calculate an onset at 18.2 ± 0.2 eV for the dissociative ionization process
Furthermore, the observation of D + /C2D2 would allow us to observe D +
ions at 28 eV produced by dissociative ionization of C2D2 only. The C2D2 samples are acetone-free. As shown in Fig. 7, D+ ions were
observed at 28.3 ± 0.2 eV between 0.2 and 1.2 eV kinetic energy. Therefore, it has to be concluded that a dissociative ionization process, producing H+, takes place at 28.3 eV at the expense of C2H2. The threshold at
29.0 ± 1.0 eV determined by Cooper et al. [7] could be related to the present observation. The onsets measured by Ogawa et al. [17] and Pang et al. [16] for dissociative excitation processes involving H*-atoms are still too high, lying at about 30.0 eV or higher in energy.
The total excess energy involved in the D+-producing process at 28.3 eV is given by (28/26) x 1.2= 1.3 eV total kinetic energy. Subtracting this quantity from the measured appearance energy at 28.3 ± 0.2 eV, the threshold of 27.0 ± 0.2 eV is obtained for KE(D+) = 0.0 eV. The onset energy, closest to the observed appearance energy, is calculated for the reaction
for which the onset is calculated at 26.94 eV using the data listed in Table 1.
In the earlier mentioned X-ray-excited valence-electron spectra a vertical onset is observed at 28.0 eV [ 73 ]. It should be assigned to a 2Σg+ state for which a repulsive potential is calculated along the symmetric C-C stretch coordinate. Furthermore, the 2Σg+ state in the D∞h symmetry group could correlate with the products of
reaction (5), i.e. 2Π + 3P fragments.
After an energy gap of 4 eV, the KE versus AE diagram could exhibit (see Fig. 5) four groups of protons: (i) those carrying at most 3.2 eV kinetic energy (vertical tail) appearing at 34.2 ± 0.4 eV, (ii) protons for which the excess translational energy shows a linear dependence on the impinging electronic energy, (iii) H+ ions carrying at least 6.0 eV kinetic energy and appearing at 37.4 ± 0.5 eV and (iv) those ions carrying up to 10.0 eV kinetic energy. The straight line (6) extending from 3.2 to 6.0 eV translational energy has a slope of 0.92 ± 0.1 and extrapolates to 31.1 ± 0.5 eV. These observations are all located at or above the lowest double ionization energy of C2H2 ( see Section 5.1).
The first vertical line at 34.2 ± 0.4 eV is in fairly good agreement with the double ionization energy of 34.6 ± 0.4 eV determined in this work (see Section 5.1). The second vertical line starts at 37.4± 0.5 eV and has not been observed as double ionization energy in the C2H2+ ionization efficiency curve. This is likely because the
involved doubly ionized state is not stable against dissociation in the Franck-Condon region. However, by double charge transfer spectroscopy, Andrews et al. [48] observed a doubly ionized state at 37.9 ± 0.4 eV.
In their PEPIPICO work on C2H2, Thissen et al. [ 51 ] mention "an increase in the slope of the ion pair
H+ + C2H+ yield at about 36 eV". The same authors measured a translational energy of 3.3 ± 1.0 eV at 34.8 eV
photon energy. This measurement compares well with the present observation of 3.2 eV. However, 3.7 ± 0.5 eV kinetic energy is measured at 38 eV photon energy [51] whereas 6.0 eV kinetic energy is measured in the present work. In the dissociative excitation work of Ogawa et al. [17], H* (n = 4) atoms carrying 6-8 eV translational energy are observed at an onset lying between 35 and 40 eV. Altogether the data for H+ carrying up to 6 eV
The calculation of the lowest threshold for the proton production at the expense of acetylene through
involves the knowledge of the ionization energies of the C2H radical. Only one direct measurement of this
quantity has been reported by Wyatt and Stafford [19] at 11.6 ± 0.5 eV. Taking D(H-C2H) = 5.33 ± 0.2 eV, as
determined in this work (see Section 5.2), the onset of reaction (6) would be at 30.5 ±0.7 eV. Most of the theoretical calculations agree to assign the 3Π symmetry to the C2H+ ground state. Only one known experimental
work reported the observation of C2H+ in its first excited 3Σ- state at about 1 eV above the around 3Π state [76].
Theoretical predictions determined the 3Σ- state to be at about 0.33 eV [66,78], 0.77 eV [77] or 1.53 eV [67] above the ground state. Excluding this latter value and taking 0.5 ± 0.2 eV for the X 3Π-3Σ- excitation energy, the onset for reaction (6), involving C2H
+
(3Σ-), would lie at 31.0 ± 0.9 eV. Taking into account the boundaries of the error range, calculated and extrapolated thresholds could be compared.
If reaction (6) is assigned to (i) the onset at 34.2 + 0.4 eV, (ii) the straight line (6) and (iii) is partially involved at 37.4 eV, the reaction products are only correlated with a (3Π/3Σ-) state. However, 34.2 eV would very likely correspond to a C2H2
2+
(1Σ+) state (see Section 5.1), whereas at 37.4 eV a 3Πu state should be involved (see Table 2). The 3Πu hypersur-face would be repulsive in the C2H+ + H+ reaction coordinate, in agreement with the
theoretical predictions [51], and should cross the 1Σ+ state to predis-sociate this state. Thissen et al. [51] calculated such crossings, but for large C-H internuclear distances. Concerning the straight line observed for 3.2-6.0 eV protons, the repulsive 3Πu state could be involved. If so, the slope of the 3Π-potential surface in the Franck-Condon region should be steeper than theoretically predicted [51].
Beside the process (6), involving doubly ionized states of C2H2, it has to be mentioned that up from
34.2 and 37.4 eV the reaction
could take place, for which the threshold is calculated at 30.4/31.6 eV (for data see Table 1).
For the protons carrying at least 10 eV translational energy, an appearance energy of 37.4(± 0.5) - 10.4 = 27.0 ± 0.4 eV is obtained for KE(H+) = 0.0 eV. This onset is in very good agreement with the threshold energy of the process (5), i.e.
already calculated at 26.94 eV.
In both this reaction and process (7) C2H +
2 super-excited ionic states are involved lying in the double
ionization continuum.
5.3. The C2H+(C2D +) dissociative ionization channel
As mentioned in Section 4.3, the dissociative ionization efficiency in the C2H+ (C2D+) channel could
only be observed when no retarding field is applied to the ion beam. For the experimental setup used in this work this should mean that less than 10 meV transla-tional energy is carried by the ionized fragment.
The first measured onset for C2H +
is at 17.30 ± 0.08 eV and for C2D +
at 17.38 ± 0.11 eV. For comparison with earlier electron impact measurements, C2H
+
appearance energies were determined at 17.8 ± 0.2 eV [1], 17.3 eV [2], 17.2 ± 0.2 eV [4], 17.45 ± 0.1 eV [5] and 17.35 ± 0.05 eV [6]. However, Plessis and Marmet [6] measured one threshold at 17.82 ± 0.06 eV. They chose the energy at 16.7 ± 0.1 eV as appearance energy and for the other energies ' 'it is unclear what processes are responsible ... ". One ion impact workofMaier [14]
mentions the onset for C2H+ production at 16.72 ± 0.12 eV.
By photoionization mass spectrometry, Botter et al. [8] investigated C2H+ and C2D+ and measured the
onset energies at 17.22 and 17.34 eV respectively. Dibeler et al. [9] determined the heat of formation of the ethynyl ion and evaluated the threshold at 0 K, i.e. 17.36 ± 0.01 eV for C2H
+
and 17.44 ± 0.01 eV for C2D +
. More recently Hayaishi et al. [12] and Ono and Ng [11] reported the C2H+ threshold energy at 16.8 ± 0.1 and
16.79 ± 0.03 eV respectively. In the C2H+ ion yield curve presented by the latter authors, a very sharp increase
should be mentioned at 17.22 eV (72 nm). In the photoion yield curve presented by the former group, this increase is measured at 17.3 eV (71.7 nm).
Although there is good agreement between both photoionization experiments for the threshold energy, a very large discrepancy between the relative cross sections of the processes at 16.8 and 17.3 eV has to be emphasized. With respect to the ion intensity at 70 nm, the maximum intensity ratio for the process at 16.8 eV is about 5/16 [12] and 1/100 [11]. Compared to the electron impact result this ratio is much higher than observed by Marmet and Plessis [6] who need an amplification factor of 5000 to observe the threshold at 16.7 ± 0.1 eV. On the other hand, the only other observation of this onset is provided by a charge transfer (ion impact) experiment which is a non-Franck-Condon process [14]. Autoionization can be discarded in this latter process.
By He(I) photoion-photoelectron spectroscopy, Eland [13] observed the first coincidence signal in the TOF-mass spectrum corresponding to C2H
+
for an ionization energy of 17.3 eV. In a threshold photoelectron-photoion coincidence (TPEPICO) experiment Norwood and Ng [79] measured the onset for C2H
+
formation at 17.29 ± 0.06 eV. This result would confirm the absence of any participation of autoionization at and below 17.3 eV photon energy in the production of C2H+ ions. Servais [80] recently measured the He(I)
photoion-photoelectron coincidence spectrum between 16.3 and 21.2 eV for mass-selected C2H+ ions, characterized by a
flight time equal to that of C2H+2. The onset for the C2H+ coincidence signal is determined at 17.3 eV. Below this
energy the signal oscillates about the baseline.
The lowest energetic process would produce both C2H +
and H in their ground state, i.e.
The calculation of the appearance energy of C2H +
through (8) would need the knowledge of (i) the ionization energy of the ethynyl radical and (ii) the H-C2H bond dissociation energy. From the present work the
translational energy carried by C2H+ at threshold is known to be less than 10 meV. This means that the maximum
excess energy which could be involved in reaction (8) would be 260 meV. Beside an unknown amount of internal energy, this is the maximum uncertainty in the energy balance. Supposing C2H+ to be produced without internal energy, taking the direct experimental ionization energy IE(C2H) =11.6 ± 0.5 eV and the dissociation
energy D(H-C2H) = 5.33 ± 0.20 eV as evaluated in this work, an appearance energy AE(C2H+ ) = 16.9 ± 0.7 eV
is calculated. This onset is in very good agreement with the photoionization value [11]. The electron impact values all agree within the error limit.
The C2H2+ ionic states correlated with the products of reaction (8) are 2Πu and 4Πu. The 2Πu state has to
be identified as being the C2H +
2 (X 2Πu
) state observed by photoelectron spectroscopy at 11.403 eV [43]. Furthermore, this spectrum shows that this ionic state is populated up to 12.3 eV in the Franck-Condon region. The threshold photoelectron spectrum [45] clearly shows that autoionization is able to populate the same state continuously up to the ionization energy of the C2H2
+
(A 2Ag) state at 16.297 eV [43]. The onset energy of 16.9
eV ≤ AE ≤ 17.3 eV lies in the complex structured A 2Ag state. The appearance mechanism of C2H+ at this energy
probably runs over the predisso-ciation path of the A 2Ag by the X 2Πu
state. Below this energy range the very weak C2H+ ion current is likely produced by a non-Franck-Condon mechanism, i.e. charge transfer and
collision-induced processes. These would exclude autoionization phenomena as an intermediate.
A second appearance energy has been measured in the ionization efficiency curve of C2H +
and C2D +
at 18.27 ± 0.10 and 18.45 ± 0.26 eV respectively. This onset has not been reported earlier; although in the photoionization efficiency curves published by Botter et al. [8] and Hayaishi et al. [12] an unambiguous increase
in the cross section is observed at about 68 nm (18.2 eV).
The energy difference between the two successive appearance energies is 1.0 ± 0.2 eV. The electronic excitation of the C2H
+
ion in its first excited 3 Σ- state is estimated experimentally and by ab initio calculations to be at 0.7-1.0 eV above the 3Π ground state [67,76-78]. Furthermore, the onset at 18.27 eV (or 18.45 eV) lies just below or at the level of the third ionization energy of 18.391 eV for the C2H2+(B 2Σu+ ) [43]. This would
probably indicate that higher vibrational levels of the A 2Ag state and/or the B 2Σu+ state of C2H2+ are
predissociated, i.e. by the process
5.4. The C2H2+ dissociative ionization channel
The first differentiated ionization efficiency curve of C2H2+ (see Fig. 9) clearly shows two onsets, i.e. at
35.8 ± 0.5 and 40.8 ± 0.4 eV. This ion being only observed without applying a retarding field to the ion beam, it carries less than 10 meV kinetic energy at the onsets. Only one previous electron impact study on acetylene reported the measurement of the threshold energy of C2H
2+
at 40.2 ± 0.5 eV [6]. This value is in very good agreement with the second onset determined in the present work.
To attempt an assignment to these onset energies, the double ionization energy of C2H has to be known.
Rabrenovic et al. [81] measured the ionization energy of the C2H+ ion by the charge stripping technique and
determined IE(C2H+) = 20.4 ± 0.5 eV. Taking the IE(C2H) = 11.6 ± 0.5 eV, as determined by Wyatt and Stafford
[19], the double ionization energy of C2H could be estimated to be 32.0 ±1.0 eV. This value looks likely when it
is compared with the result of IE (double ion.) = 32.5 ±1.4 eV obtained by applying the rule of IE (double ion.) =2.8 IE (single ion.) [82]. Adding the dissociation energy of H-C2H, one would obtain a threshold energy for the
reaction
where the C2H2+ ion could be a 2Π or a 4Σ- state with (2σ)2(1π)3(3σ)°or(2σ)2(1π)2 (3σ)1 electronic configuration
respectively. This is derived from the 3Π ground state configuration of C2H+, i.e. (2σ)2 (1π)3 (3σ)1 and the (2σ)2 (1π)2 (3σ)2 3Σ- configuration of the first excited state [78]. Considering C2H2+ as the isoelectronic species of C2+,
theoretical calculations predict the 4Σ- to be the ground state. Using D(H-C2H) = 5.33 ± 0.23 eV, obtained in this
work, the appearance energy of process (10) would level at 37.3 ± 1.2 eV. This value has to be compared with the experimental value of 35.8 ± 0.5 eV.
The second appearance energy measured at 40.8 ± 0.4 eV would be assigned to the production of C2H2+
in a vibronic excited state at about 5.0 ± 0.9 eV above the ground state. Comparing C2H 2+
with its isoelectronic species C2+, the 2Σ- and 4Π states have been observed [76] and calculated [83,84] at about 5 eV above the ground
state. If the ground state produced at35.8eV is a 4Σ- state, very likely the 4Π state could be produced at 40.8 eV.
Acknowledgement
This work has been supported by the Fonds de la Recherche Fondamentale Collective (FRFC) and by the Belgian Government through an Action de Recherche Concertée (ARC). One of us (M.D.) is indebted to the Belgian Government for a grant in the frame of the ARC contract. Useful discussions with Professor B. Leyh and Dr. Chr. Servais are gratefully acknowledged.
References
[1] P. Kusch, A. Hustrulid and J.T. Tate, Phys. Rev. 52 (1937) 843.
[2] F.H. Field, J.L. Franklin and F.W. Lampe, J. Am. Chem. Soc. 79 (1957) 2665. [3] J. Momigny and E. Derouane, Advan. Mass Spectrom. 4 (1967) 607. [4] H. Yamaoka, P. Dong and J. Dump, J. Chem. Phys. 51 (1969) 3465. [5] I.H. Suzuki and K. Maeda, Advan. Mass Spectrom. 7 (1978) 182.
[6] P. Plessis and P. Marmet, Intern. J. Mass Spectrom. Ion Processes 70 (1986) 23. [7] G. Cooper, T. Ibuki, Y. lida and CE. Brion, Chem. Phys. 125 (1988) 307.
[8] R. Botter, V.H. Dibeler, J.A. Walker and H.M. Rosenstock, J. Chem. Phys. 44 (1966) 1271. [9] V.H. Dibeler, J.A. Walker and K.E. McCuIIoh, J. Chem. Phys. 59 (1973) 2264.
[10] V.H. Dibeler and J,A. Walker, Intern. J. Mass Spectrom. Ion Phys. 11 (1973) 49. [11] Y. Ono and C.Y. Ng, J. Chem. Phys. 74 (1981 ) 6985.
[12] T. Hayaishi, S. Iwata, M. Sasanuma, E. Ishiguro, Y. Morioka, Y. Iida and M.Nakamura,J. Phys.B 15 (1982) 79. [13] J.H.D. Eland, Intern. J. Mass. Spectrom. Ion Phys. 31 (1979) 161.
[14] W.B. Maier, J. Chem. Phys. 42 (1965) 1790.
[15] C.I.M. Beenakker and F.J. De Heer, Chem. Phys. 6 (1974) 291.
[16] K.D. Pang, J.M. Ajello, B. Franklin and D.E. Shemansky, J. Chem. Phys. 86(1987) 2750. [17] T. Ogawa, H. Tomura, K. Nakashima and H. Kawazumi, J. Chem. Phys. 88 (1988) 4263. [18] H. Shiromura, Y. Achiba, K. Kimura and Y.T. Lee, J. Phys. Chem. 91 (1987) 17. [19] J.R. Wyatt and F.E. Stafford, J. Phys. Chem. 76 (1972) 1913.
[20] P.G. Green, J.L. Kinsey and R.W. Field, J. Chem. Phys. 91 (1989) 5160. [21] J. Segall, R. Lavi, Y. Wen and C. Wittig, J. Phys. Chem. 93 (1989)7287.
[22] K.M. Ervin, S. Gronert, S.E. Barlow, M.K. Gilles, A.G. Harrison, V.M. Bierbaum, C.H. DePuy, W.C. Lineberger and G.B. Ellison, J. Am. Chem. Soc. 112 (1990) 5750.
[23] M. Iraqi, A. Petrank, M. Peres and C. Lifshitz, Intern. J. Mass Spectrom. Ion Processes 100 (1990) 679. [24] I. Dotan, M. Iraqi and C. Lifshitz, Intern. J. Mass Spectrom. Ion Processes 124 (1993) R21.
[25] A. Curtiss and J.A. Pople, J. Chem. Phys. 91 (1989) 2420.
[26] R. Locht and J. Schopman, Intern. J. Mass Spectrom. Ion Phys.15 (1974) 361.
[27] C. Servais, R. Locht and J. Momigny, Intern. J. Mass Spectrom. Ion Processes 71 (1986) 179. [28] A. Lofthus and P.H. Krupenie, J. Phys. Chem. Ref. Data 6 (1977) 113.
[29] J. Higbie, Am. J. Phys. 59 (1991) 184.
[30] J.N. Miller, Spectry. Intern. 3 (3) (1991) 42; 3 (4) (1991) 41; 3 (5) (1991) 43. [31] M.A. Heald, Am. J. Phys. 60 (1992) 11,
[33] R.C. Weast, CR.C. handbook of chemistry and physics (CRC Press, Boca Raton, 1984) p. Al 13. [34] R. Locht, J.L. Olivier and J. Momigny, Chem. Phys. 43 (1979) 425.
[35] R. Locht, Ch. Servais, M. Ligot, M. Davister and J. Momigny, Chem. Phys. 125 (1988) 425. [36] R. Locht, Ch. Servais, M. Ligot, F. Derwa and J. Momigny, Chem. Phys. 123 (1988) 443.
[37] G. Herzberg, Molecular spectra and molecular structure, Vol. 3. Electronic spectra of polyatomic molecules (Van Nostrand, Princeton, 1967).
[38] G. Herzberg, Molecular spectra and molecular structure, Vol. 2. Spectra of diatomic molecules (Van Nostrand, Princeton, 1967). [39] CE. Moore, Atomic energy levels, Vol. 1, NSRDS-NBS Circular467 (USGPO, Washington, 1949).
[40] R.S. Urdahl, Y. Bao and W.H. Jackson, Chem. Phys. Letters 178 (1991) 425.
[41] K.P. Huber and G. Herzberg, Molecular spectra and molecular structure, Vol. 4. Constants of diatomic molecules (Van Nostrand Reinhold, New York, 1979).
[42] V.H. Dibeler and S.K. Liston, J. Chem. Phys. 47 (1967) 4548.
[43] J.E. Reutt, S. Wang, J.E. Pollard, D.J. Trevor, Y.T. Lee and D.A. Shirley, J. Chem, Phys. 69 (1978) 1504. [44] R.G. Cavell and D.A. Allison, J. Chem. Phys. 69 (1978) 159.
[45] R. Locht, K. Hottmann and H. Baumgärtel, to be published.
[46] R. Locht, M. Davister, W. Denzer, H.W. Jochims and H. Baumgärtel, Chem. Phys. 138 (1989) 433. [47] J. Appell, J. Dump, F.C. Fehsenfeld and P. Fournier, J. Phys. B 7(1974)406.
[48] S.R. Andrews, F.M. Harris and D.E. Parry, Chem. Phys. 166 (1992) 69.
[49] J.R. Appling, B.E. Jones, L.E. Abbey, D.E. Bostwick and T.F. Moran, Org. Mass Spectrom. 18 (1983) 282. [50] J.H.D.Eland, F.S.Wort, P.Lablanquie and I.Nenner, Z.Physik D4 (1986) 31.
[51] R. Thissen, J. Delwiche, J.M. Robbe, D. Duflot, J.P. Flament and J.H.D. El and, J. Chem. Phys. 99 (1993) 6590. [52] M. Thompson, P.A. Hewitt and D.S. Wooliscroft, Anal. Chem. 48(1976) 1336.
[53] R.R. Rye, T.E. Madey, J.E. Houston and P.H. Holloway, J. Chem. Phys. 69(1978) 1504. [54] J.A. Pople, MJ. Frisch, K. Raghavachari and P. von R. Schleyer, J. Comput. Chem. 3 ( 1982) 468.
[55] G.W. Burdick, G.C. Shields, J.R. Appling and T.F. Moran, Intern. J. Mass Spectrom. Ion Processes 64 (1985) 315. [56] C.M. Liegener, Chem. Phys. 92 (1985) 97.
[57] E.M.L. Ohrendorf, F. Tarantelli and L.S. Cederbaum, J. Chem. Phys. 92 (1990) 2984. [58] J. Appell and J. Dump, Intern. J. Mass Spectrom. Ion Phys. 10 (1972/73) 247. [59] H. Köppel, W. Domcke and L.S. Cederbaum, Adv. Chem. Phys. 57 (1984) 59.
[60] E. Illenberger and J. Momigny, An introduction to elementary processes induced by ionization (Springer, New York, 1991). [61] K.C. Smyth, J.A. Schiavone and R.S. Freund, J. Chem. Phys. 59 (1973) 5225.
[62] S.P. So and W.G. Richards, J. Chem. Soc. Faraday Trans. II 71 (1975) 660. [63] S. Shih, S.D. Peyerimhoff and R.J. Buenker, J. Mol. Spectry. 64 (1977) 167. [64] S.ShihandS.D.Peyerimhoff, J.Mol. Spectry. 74 (1979) 124.
[65] I.H. Hillier, J. Kendrick and M.H.Guest,Mol.Phys. 30 (1979) 1133. [66] A. Largo and C. Barrientos, Chem. Phys. 138 (1989) 291. [67] A.G. Koures and L.B. Harding, J. Phys. Chem. 95 (1991) 1035.
[68] W.R.M. Graham, K.I. Dismuke and W. Weltner, J. Chem. Phys. 60 (1974) 3817. [69] R.A. Shepherd and W.R.M. Graham, J. Chem. Phys. 86 (1987) 2600.
[70] P.G. Carrick, A.J. Merer and R.F. Curl Jr., J. Chem. Phys. 78 (1983) 3652. [71] G. Bieri and L. Åsbrink, J. Electron Spectry. Relat. Phenom. 20 (1980) 149. [72] S. Svensson, E. Zdansky, U. Gelius and H. Ågren, Phys. Rev. A 37 (1988) 4730.
[73] J. Muller, R. Arneberg, H. Ågren, R. Manne, P.Å. Malmquist, S. Svensson and U. Gelius, J. Chem. Phys. 77 ( 1982) 4895. [74] S. Svensson, P.Å. Malmquist, M.Y. Adam, P. Lablanquie, P. Morin and I. Nenner, Chem. Phys. Letters 111 ( 1984) 574. [75] K.Köllmann, J.Phys.B 11 (1978) 339.
[76] A. O'Keefe, R. Derai and M.T. Bowers, Chem. Phys. 91 (1984) 161. [77] K. Hashimoto, S. Iwata and Y. Osamura, Chem. Phys. Letters 174 (1990) 649. [78] W. Koch and G. Frenking, J. Chem. Phys. 93 (1990) 8021.
[79] K.Norwood and C.Y.Ng, J. Chem. Phys. 91 (1989) 2898. [80] Ch. Servais, Ph.D. Thesis, Université de Liège (1994).
[81] M. Rabrenovic, C.G. Herbert, C.J. Proctor and J.H. Beynon, Intern. J. Mass Spectrom. Ion Phys. 47 (1983) 125. [ 82] B.P. Tsai and J.H.D. Eland, Intern. J. Mass Spectrom. Ion Phys. 36 (1980) 143.
[83] C. Petrongolo, PJ. Bruna, S.D. Peyerimhoff and R.J. Buenker, J. Chem. Phys. 74 (1981) 4594.
[84] P. Rosmus, H.J. Werner, E.A. Reinsch and M. Larsson, J. Electron Spectry. Relat. Phenom. 41 (1986) 289. [85] H. Okabe and V.H. Dibeler, J. Chem. Phys. 59 (1973) 2430.
[86] Y. Chen, D.M. Jonas, CE. Hamilton, P.G. Green, J.L. Kinsey and R.W. Field, Ber. Bunsenges. Physik. Chem. 92 (1988) 329. [87] M. Fuji, A. Haijima and M. Ito, Chem. Phys. Letters 150 (1988) 380.
[88] P. Frank and Th. Just, Comb. Flame 38 (1980) 231.
[89] B.K. Janousek and J.I. Brauman, J. Chem. Phys. 71 (1979) 2057. [90] A.M. Wodtke and Y.T. Lee, J. Phys. Chem. 89 (1985) 4744.