Investigating eggs hatchability in indigenous
chicken system with smallholder farms in Kenya in
a participatory research using analysis of variation
Ndegwa J. M , Mead R , Norrish P , Shephered D. D , Kimani C. W1, Wachira A. M1, Siamba D. N1.: The University of Reading, International and Rural Development Department (IRDD) and School of Applied Statistics PO Box 237 Reading, RG6 6AR, Reading, UK.
1: Kenya Agricultural Research Institute, National Animal Husbandry Research Centre, P.O Box 25, Naivasha, Kenya.
Corresponding author: Joseph M Ndegwa. Email: [email protected]
Original submitted in on 16th April 2014. Published online at www.m.elewa.org on 31st August 2014. http://dx.doi.org/10.4314/jab.v80i1.6
ABSTRACT
Objective: The aim of this farmer participatory research was to investigate the treatment effects of housing, vaccination, deworming and feed supplementation on production characteristics of indigenous chicken in different farms in Kenya.
Methodology and results: The research involved 200 farmers in five regions in three counties (Laikipia, Nyandarua and Nakuru). Four villages were selected per region and10 farms in each village. The selection of farms was based on farmer’s willingness to participate. Training and sensitisation meetings, introduction of intervention options, implementation by farmers, and monitoring and evaluation were carried out. The project was monitored over a span of five, 3-months long period. This paper has dwelt on the inferential statistical analysis of production characteristics hatchability, using variation analysis. The data used was from 107 and 121 farms recorded in three consecutive typical hen-cycles. The production characteristic hatchability was obtained as percentage of the eggs hatched over the eggs set for each hen that had records for each cycle. The mean hatchability values in the 20 villages ranged from 62 – 76% and frequency distribution of individual values had a range of 20 – 100 percent. The analysis of variation has produced evidence for no cycle effect on hatchability while showing large enough variations within and between farms and consequently between regions. Lack of cycle effects on hatchability could possibly be associated with the fact that the characteristic was more or less man-controlled. The regression analysis provided evidence that a number of variables in four different combinations influenced hatchability levels in different regions.
Conclusion and application of results: The results of the analysis indicate that there is strong evidence that farmers’ actions, (management), animal behaviour (indigenous chicken hens genetic potential) and environment (regions) all have some influence on the performance of indigenous chicken flocks. This study also provides empirical evidence that farmer participatory research is a development concept that has great potential in supporting innovation and technology development and transfer for poverty alleviation and livelihoods enhancing of rural poor people.
Keywords: Indigenous chicken system; Eggs hatchability; Smallholder farmers; Participation; Analysis of variation; Kenya
Journal of Applied Biosciences 80:7000 – 7013
INTRODUCTION
In Africa, majority of the population is poor and live in rural areas eking out a living from subsistence farming to meet household food requirements (Ndegwa et al., 2001a). According to Blair (2000) and Al-Sultan (2000), the largest proportion of the poor is mainly composed of women who engage in subsistence agricultural activities as they struggle to survive and feed their families under often very hostile environments (Ndegwa et al., 2000, 1999, 1998a, 1997; Gueye, 2000a). According to FAO (2011), the agriculture sector is underperforming in many developing countries, and one of the key reasons is that women do not have equal access to the resources and opportunities they need to be more productive. FAO (2011) also recommends promoting gender equality and empowering women (Millennium Development Goal Schedule 3) in agriculture to win, sustainably, the fight against hunger and extreme poverty (MDG1). Indigenous chickens play a very significant role in rural livelihoods and in Kenya, and indeed in sub-Saharan Africa (Ndegwa et al., 2001b, 2001c). They comprise over 70% of total poultry populations (Stotz, 1983)). Indigenous chicken are kept and reared by over 90% of rural households in small flocks of about 20 birds (Mbugua, 1990; MOLD, 1990; Stotz, 1983). They produce about 50% of the total eggs and over 80% of the poultry meat produced in many countries in sub-Saharan Africa (Ndegwa et al., 1998a). Hence, there exists a potential for a local resource like indigenous chickens to turn around the lives in rural areas who also calls for an infrastructural and institutional support in research and development activities aimed at improving productivity at farm level. However, indigenous
chicken system has generally been characterised by low productivity due to among other factors, poor management, inadequate and poor feeding regime, poor (or lack) of disease control measures, poor hygiene, inappropriate housing, negative attitudes, lack of technical knowledge and lack of institutional support in terms of policy and infrastructure (Ndegwa and Kimani, 1998b). Proper harnessing of local resources of the poor people and their involvement in the research process can help bring about development of sustainable livelihoods and contribute to the fight on poverty alleviation in rural areas where the majority of the poor live (Ndegwa, 2006 and 2013; Gonsalves et al., 2005). Fanworth, et al., (2013) emphasise the fact that empowering women is key to poverty reduction as well as a key driver to agricultural productivity. Gonsalves,et al., (2005) write about new challenges to agricultural research and development that include shifting focus to less favourable environments, strengthening capacity of local farming communities to continuously learn and experiment ways of improving their agricultural livelihoods, research and development are no longer exclusive domain of scientist and that local stakeholders provide inputs to processes that find sustainable solutions. Okali. et al. (1994) suggest a possibility of both farmers and researchers being involved at any or all points along a continuum of levels of participation. However, there exists little published peer-reviewed material regarding how benefits of participatory research are achieved in practice (Blackstock et al., 2007). This paper explores and explains importance of participatory research in practical terms.
METHODOLOGY
This farmer participatory research was carried out between 1996 and 1999 to evaluate effects of improved management practices on performance of indigenous chickens at farm level and the consequences for farmer participation in the implementation of the research activities. The study involved selection of location (5 regions and 4 villages per region as shown in Box 1), selection of farms based on farmer’s willingness to participate (10 farms selected per village), training and sensitisation
meetings (selected farmers and their neighbours plus frontline extension personnel), introduction of intervention options (see Box 2), implementation by farmers, and monitoring and evaluation. The farmers used their own local inputs in implementing the project interventions and recorded various project activities and outputs including some aspects of management and production. The project was monitored over a span of five, 3-months long periods.
Box 2: Indigenous chicken project improved intervention options and how they were adapted by farmers
1. Housing:
- majority of farmers had adopted housing interventions designed to provide shelter from heat, wind cold, rain, thieves, and predators; provide adequate ventilation , lighting and space for birds, feeders, drinkers, nests, resting rafts and for people getting in and out with ease, easy to clean and disinfect to prevent diseases, internal and external parasite infestation. Features included:
- Roofing (farmers used materials such as iron sheet, plastic sheeting, reeds (‘makuti’) and grass) - Walls (had to be smooth – mainly mud, some timber, others rafters)
- Floor (dry and smooth and had to be kept clean – mostly earthen, some raised timber, a few were cemented)
- Chicken run (provided scavenging area to glean feeds and exercise – farmers used chicken wire, chain link, offcut timber or droppers)
- Chick pen (high priority for chicks rearing up to 8 weeks, and which contributed to relatively very low mortality levels of 5 -20% compared to over 80% normally reported for ordinary systems(Ndegwa et. al., 1999) – most were portable made from timber, tin, wire mesh, intertwined rafters, and reeds baskets)
2. Feeding:
- Recommendation on feeding was for a free-choice system comprising both scavenging and supplementation
- almost all farmers supplemented their chicken flocks using mostly local materials (cereal grains – maize, sorghum, millet, wheat, oats, barley; boiled potatoes tubers and peelings, sweet potatoes (Ipomeo batata), cassava (Tapioca), arrow roots, beetroots, carrots; pumpkins, boiled grain and leafy amaranthus (‘terere’), green vegetables, leafy weeds, grasses; fullfat oiseeds – sunflower, rapeseed,‘thawani’ (rapeseed family), croton megalocapus (‘mukinduri’), groundnuts; cooked legume
Box 1 Regions and villages
1. Laikipia Ngarua – low potential semi-arid, poor infrastructure and frequent livestock theft incidences. Selected villages (with average farm sizes) were, 1 - Kinamba (2 acres); 2 - Sipili (2.5 acres); 3 - Cheleta (10 acres); 4 - Ol Moran (1 acre).
2. Ol Kalou – low to high potential and cold with frequent frost and water logging incidences. Has impassable road network for transportation during wet seasons. The selected villages were: 1) Ol Kalou South with average farm size of 2.5 acres; 2) Passenga with 5 acres as the average farm size; 3) Mirangine with average farm size of 2 acres and 4) Kaibaga with average farm size of 1 acre. 3. Bahati – high potential with adequate rainfall and good soils for agricultural activities, with land size ranging from 5 to 0.25 acres per household and relatively good road network and market opportunities. The selected villages (with average farm sizes) were, 1) Kabazi (1.5 acres); 2) Munanda (2 acres holdings); 3) Scheme (3 acres); 4) Wanyororo (0.5 acres).
4. Njoro –high to medium potential with good to poor road network and market opportunities. The selected villages (with average farm sizes) were, 1) Piave (2.5 acres); 2) Gichobo (5 acres); 3) - Njokerio (0.25 acres); 4) Likia (1.5 acres).
5. Naivasha – low potential, porous volcanic soils of high infiltration. Good to poor road network especially during wet periods villages (with average farm sizes) were: 1) Karate (1.5 acres); 2) Maraigushu (2.5 acres); 3) Karai (5 acres); 4) Mirera (1 acres).
seeds and leafy parts – peas, beans; leuceana, cariandra, and sesbania; in-season fruits - avocados, plums, mangoes, pineapple, bananas; mineral sources - ground egg shells, ash, common salt)
- a few farmers bought external materials to feed their birds (compounded feeds, fishmeal, maize bran, cotton seed meal, soya meal, sunflower meal, bone meal, limestone, common salt, mineral and vitamin premix)
- scavenging was practiced by all farmers mainly within ‘runs’ or enclosures during cropping and around the homestead and farm when there was no crop
- Clean and relatively cool water was also provided by all farmers in a variety of containers 3. Health management:
- To prevent and treat diseases some farmers used either or both conventional and traditional strategies:-
- Almost all farmers used traditional medication and some did not use any conventional methods. - Conventional medication included:
a) Vaccination against Newcastle disease; b) Drugs for respiratory, gut and other problems;
c) Control and treatment of endo-parasites – helminths using dewormers d) Control and treatment of ecto-parasites - mites, fleas and lice using powders
- traditional medication was done using a variety of materials e.g. Aloe spp.(‘mugwanugu’, ‘thukurui’), hot pepper, garlic, Mexican marigold (‘mubangi’), stinging nettle (‘thabai’), neem, pumpkin leaves, pyrethrum, black soot(‘carbon’), hot ashes;
- Other strategies included maintaining clean chicken houses and use of disinfectants such as ‘kerol’ or magadi soda and spraying walls with acaricides.
4. Hatching and Brooding:
- this was a strategy to produce replacement and incremental flocks rather than buying replacement day-old chicks from a commercial hatchery as is the case with commercial poultry systems. - The strategy also focused on minimising flock mortality associated with unimproved systems. Hatching (synchronised and consecutive) involved use of a cock: hen ration of 1:10 to maximise fertility, proper nests (dry, clean, good litter material, quiet, with less light, isolated).
- Synchronised hatching – several hens let to get broody and provided incubation eggs at the same time.
- Consecutive hatching - a broody hen provided with incubation eggs immediately chicks are hatched repeatedly for up to 5 times.
- These strategies ensured farmers got many chicks at once hence increasing flock size several fold within a short period of time.
- Only a few farmers, though were able to apply synchronised and consecutive hatching Brooding aimed at preventing chick mortalities by providing good management:
- Separating chicks from mature birds – special chick housing (portable baskets, pens, isolated chick area).
- Feeding good quality feed – high energy and protein, well ground - clean cool drinking water
- Protection against cold, predators, diseases, 5. Breeding:
-aimed at improving genetic potential of indigenous chickens - maintaining of cock: hen ratio of 1:10,
- selecting high performers (eggs and growth) and good features (large body size, sturdy) - avoiding inbreeding (removal of cocks after six months and exchanging with others farmers) Intervention options were based on a training manual by Ndegwa et al., 1998b
This paper focuses on the use of inferential statistics, or quantitative analysis of the production characteristic - hatchability. The data used was from
107 and 121 farms recorded in three consecutive typical hen-cycles. Hatchability was obtained as percentage of the eggs hatched over the eggs set for
each hen that had records for each cycle. The statistical analysis investigates effects of farm, cycle or hen on hatchability in all the 20 villages described in Box 1 using analysis of mean squares variation. The basic unit of analysis was either the farm or hen within a farm. The outcome of the analysis provides an understanding of the behaviour of the farms in response to internal and external influences in terms of eggs hatchability. The analysis included the use of general linear model (GLM) procedures of the SAS that fitted farm, hen and cycle combinations to assess and compare levels of variation. The mean
squares were ranked in ascending order and plotted against their ranks to produce cumulative distributions whose patterns were investigated for their differences and effects of variations. The mean squares patterns were expected to follow a chi-square distribution with a skew to the left and having a large proportion of mean squares values in the middle. The methodology also involved use of regression analysis to investigate the treatment and flock demography dynamic effects the hatchability characteristics.
RESULTS AND DISCUSSION
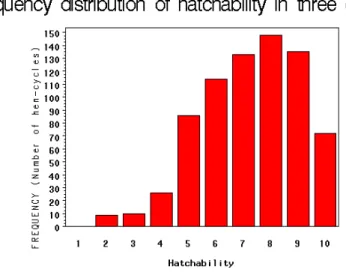
Hatchability: The production characteristic hatchability was obtained as percentage of the eggs hatched over the eggs set for each hen that had records for each cycle as illustrated in Ndegwa, (2013). The values for hatchability for each hen in each cycle and the cycle averages were used for statistical analysis. Table 1 gives mean hatchability and mean number of eggs set per hen in each of the 20 villages averaged over three hen-cycles. The mean hatchability values in the 20 villages ranged from 62 – 76 percent, which is narrower, compared
with the range of about 20 – 100 percent in the hatchability frequency distribution shown in Fig 1. This difference is reasonable and expected because a sample of mean values has small variation within it while a sample of individual values would have more variation and hence a larger range as observed with the frequency distribution of the hatchability values. These hatchability values compare well with results from other authors investigating this characteristic among indigenous chicken (Abiola et al., 2008; Asuquo, et al., 1992)
Table1: Mean hatchability and mean eggs set averaged over 3 cycles in 20 villages.
Region Village Mean Hatchability (%) Mean eggs set/hen
1 1 76 10.7 1 2 67 10.7 1 3 70 10.8 1 4 74 10.9 2 1 70 10.5 2 2 70 11.1 2 3 64 10.8 2 4 72 9.9 3 1 62 11.3 3 2 74 10.9 3 3 75 10.0 3 4 67 10.4 4 1 66 10.7 4 2 69 9.8 4 3 66 10.2 4 4 62 10.0 5 1 75 10.3 5 2 71 10.3 5 3 65 10.1 5 4 68 10.4
Analysis of variation in hatchability: A comparison of mean hatchability between farms was carried out using an analysis of variance (ANOVA) or mean square analysis to determine whether there was any real variation. This was done fitting combinations of the three factors farm, cycle and hen with hen being always nested within farm, to investigate variation between the hen within farm, between farm and
between cycles. The mean squares (MS) values produced for hen, farm, cycle and error were then used to investigate relative sizes of different components of variations. The MS were obtained by fitting three models using a combination of the three entities to hatchability values for each village separately and hence 20 sets of analyses were made in each case for the, 1) within and between farms
mean squares and (2) farm, cycle, hen, and error mean squares. Having analyses for the twenty separate villages enables us to examine the consistency of any farm effects and the distribution of mean squares. The farm variations are particularly
important for examination as this determines whether regression analysis should be done or not. Regression analysis is not feasible if there is no consistency.
Figure 1: Hatchability frequency distribution (The models were:
1) Hatch = farm to get type I between farm MS and between farm MS
2) Hatch = farm + cycle + hen to obtain type I farm and type III hen MS
3) hatch= farm + hen + cycle to obtain type I farm and type III cycle MS
The type III hen and cycle MS were obtained when each of them was fitted as the last term and allows for the variations of the terms before it in the fitting. The investigation of the mean squares started with comparison of two terms; between farm and within farm. The MS were obtained from the fitting of model 1 and are shown in Tables 2 for each of the villages in all the five regions. A village-by-village examination
of the mean squares and their significance levels shows that there were only six out of twenty villages with an F-ratio of less than one, while eight villages out of the fourteen with an F–ratio of more than one had significant F values. There is therefore, enough evidence provided by these between and within farm MS, to suggest that there is more variation between the farms than there is within the farms. This could be associated with different management practices and genetic differences of hens in different farms. Hens within same farms were under similar management practices and probably with small genetic differences due to a high inbreeding likelihood, which might have reduced variations associated with the hens’ genetic makeup.
Table 2: Between and within farm mean squares, hatchability range and F-ratios among farms Region Village Between farm Mean Squares
(df)1
Within farm Mean Squares (df) F – ratio2 Hatchability range 1 1 460 (7) 155 (49) 2.97* 57 – 87 1 2 225 (6) 352 (33) 0.64 57 – 79 1 3 214 (4) 175 (22) 1.22 67 – 90 1 4 542 (4) 140 (25) 3.88* 50 – 80 2 1 1153 (5) 232 (21) 4.97** 47 – 89 2 2 1074 (5) 341 (47) 3.15* 54 – 84 2 3 1245 (5) 420 (29) 2.96* 36 – 93 2 4 592 (4) 328 (28) 1.80 64 – 87 3 1 508 (4) 384 (28) 1.32 37 – 69 3 2 247 (5) 225 (38) 1.10 69 – 83 3 3 347 (7) 233 (36) 1.49 64 – 89 3 4 634 (7) 204 (34) 3.11* 47 – 82
4 1 196 (5) 239 (23) 0.82 57 – 80 4 2 1020 (5) 288 (15) 3.45* 43 – 93 4 3 276 (5) 459 (20) 0.6 51 – 78 4 4 14 (2) 210 (30) 0.06 61 – 63 5 1 304 (8) 341 (31) 0.89 66 – 92 5 2 544 (7) 209 (44) 2.60* 59 – 90 5 3 321 (5) 339 (26) 0.95 50 – 73 5 4 401 (4) 366 (30) 1.10 61 – 79
NB: Fitting model 1, hatch=farm for between and within farm MS, 1(df): degrees of freedom; 2F-ratio: values with asterisk are significant
The above village-by-village comparison of the MS is followed by development of cumulative frequency
distributions. This is done by first ranking the MS in an ascending order as provided in Table 3
Table 3: Ranking of between and within farm mean squares of the 20 villages in an ascending order Ranking Between Farm Mean Squares Within Farm Mean Squares
1 14 140 2 196 155 3 214 175 4 225 204 5 247 209 6 276 210 7 304 225 8 321 232 9 347 233 10 401 239 11 460 288 12 508 328 13 542 339 14 544 341 15 592 341 16 634 352 17 1020 366 18 1074 384 19 1153 420 20 1245 459
Normally, if both the between and the within sets of MS had the same number of degrees of freedom in every village, then the ordered MS would be expected to conform to a chi-square (X2) distribution. If the degrees of freedom were large, the distribution would be tailed to the right with a small number of large MS values at the end. However, if the degrees of freedom were small, the distribution would be tailed to the left with a small number of small MS values at the beginning. In this study case, there
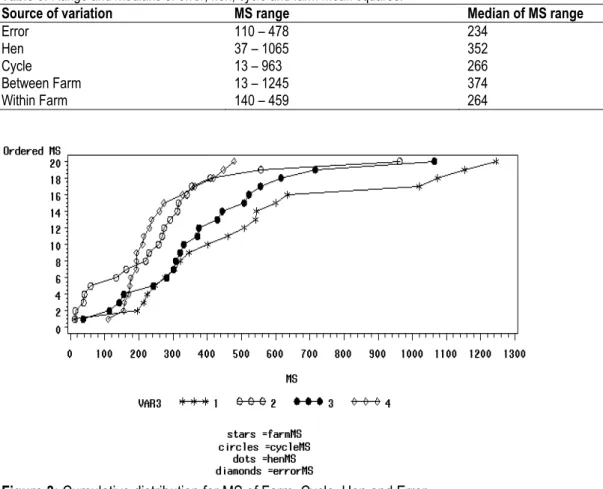
would be several chi-square distributions as the degrees of freedom were different for each village. Again, with large degrees of freedom, the distribution was more symmetrical and close to a straight line. Another way of comparing the variations is by using the method of cumulative frequency distributions of the two sets of MS (between and within farms). This is done by plotting the ranked order of the MS of all the 20 villages with their respective MS values as shown in Fig2.
Figure 2: Cumulative distribution of between and within farm mean squares This diagram shows a clearer picture of the
differences of the MS values of the two sets. The within farm distribution is more symmetrical because it has a large number of the degrees of freedom while the between-farm MS distribution is less so due to the small number of degrees of freedom. Hence, between farm MS distribution has two tails, the left one for extreme large values and the right one is for extreme small values. Comparing these two cumulative distributions, the between farm MS are clearly larger than the within farm MS which indicates that there is less variation among hens in a farm and more variation from farm to farm in the hatchability values. The differences were not as apparent looking at the MS values in each village alone, which shows the importance of using the cumulative distribution method. The within farm variation has several components – error, hen and cycle. The analysis of variation then proceeded by comparing the farm, hen, cycle and error MS in the 20 villages. The farm, cycle, hen and error mean squares investigation was
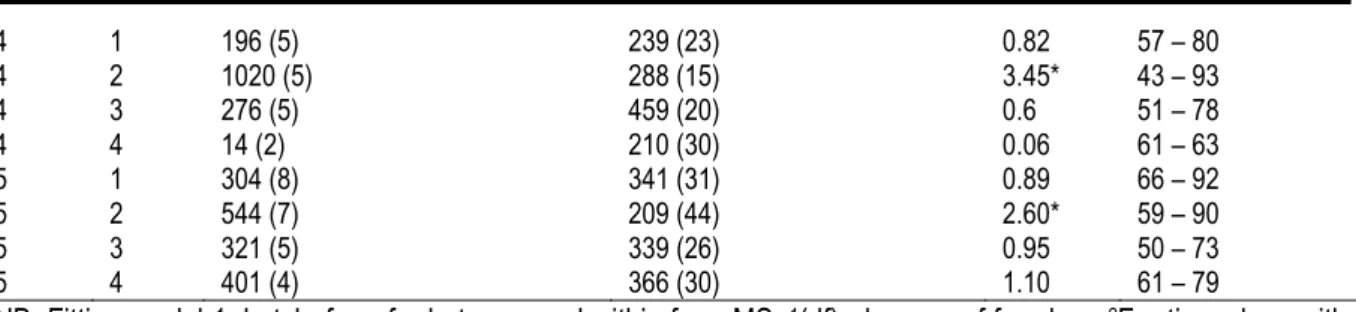
done by fitting models 2 and 3 respectively to obtain type I farm MS, type III hen MS and type III cycle MS. The error term MS was obtained from each of the three models. The four types of MS in 20 villages are shown in Table 4. The investigation of these mean squares was the same as the one used in the ‘between and within’ mean squares to compare variations among the villages on the effect of farm, cycle and hen on hatchability. Looking at the F-ratios for the farm term, 14 villages had F-ratios with a value greater than one, eight of which were significant. With the hen MS, twelve villages had an F-ratio of more than one and four of these are significant. In the case of the cycle MS, half of the villages had an F-ratio of more than one but only one of them is significant. A summary of the MS characteristics given in Table 5 shows the range and the median of each of the mean squares. Evidence provided by the MS range and median values shows that the variation between cycles is not consistently larger than the error.
Table 4: Hatchability mean square values for farm, cycle, hen and error with respective F- ratios
Region Village Farm1 Cycle Hen Residual
MS Df F-ratio MS df F-ratio MS df F-ratio MS df
1 1 460 7 2.95* 230 2 1.47 143 13 0.91 156 34 1 2 225 6 0.82 292 2 1.07 522 8 1.91 273 23 1 3 214 5 1.11 41 2 0.21 156 6 0.81 193 14 1 4 542 4 4.93* 14 2 0.13 242 7 2.2 110 16 2 1 1153 5 4.43** 355 2 1.36 114 4 0.44 260 15 2 2 1074 5 4.69** 557 2 2.41 616 12 2.67* 231 33 2 3 1245 5 2.6* 313 2 0.65 302 7 0.63 478 20 2 4 600 4 1.83 409 2 1.25 308 6 0.94 327 20 3 1 508 4 2.63* 963 2 4.99* 716 8 3.71* 193 18 3 2 247 5 1.57 220 2 1.40 430 9 2.74* 157 27 3 3 347 7 1.64 39 2 0.18 376 7 1.78 211 27 3 4 634 7 3.66* 264 2 1.53 321 7 1.85 173 25 4 1 196 5 1.01 316 2 1.64 372 5 1.93 193 16 4 3 276 5 0.66 258 2 0.62 556 9 1.33 418 9 4 4 13 2 0.08 134 2 0.79 332 8 1.95 170 20 5 1 304 8 1.28 274 2 1.16 508 13 2.14* 237 16 5 2 544 7 3.09* 13 2 0.07 282 17 0.10 176 25 5 3 321 5 0.72 59 2 0.13 37 5 0.08 448 19 5 4 401 4 1.10 163 2 0.45 444 7 1.22 364 21
The cumulative distribution of the four mean squares given by Fig 3 shows the closeness between the cycle and the error MS as the two MS distributions are intertwined, confirming that the cycle variations are not larger than the error. There are only 2 degrees of freedom for the cycle and therefore more variability. The observation for the closeness between the cycle variations, error and within farm variations, inevitably led to a decision to exclude the
cycles factor from further investigation of effects on hatchability. Another set of MS for the farm, hen and error was obtained by fitting model hatch = farm + hen, excluding the cycles. Table 6 (gives a summary of these MS in terms of their ranges and medians. The range values remain as before but the medians have changed slightly, with error and hen MS decreasing and farm MS increasing.
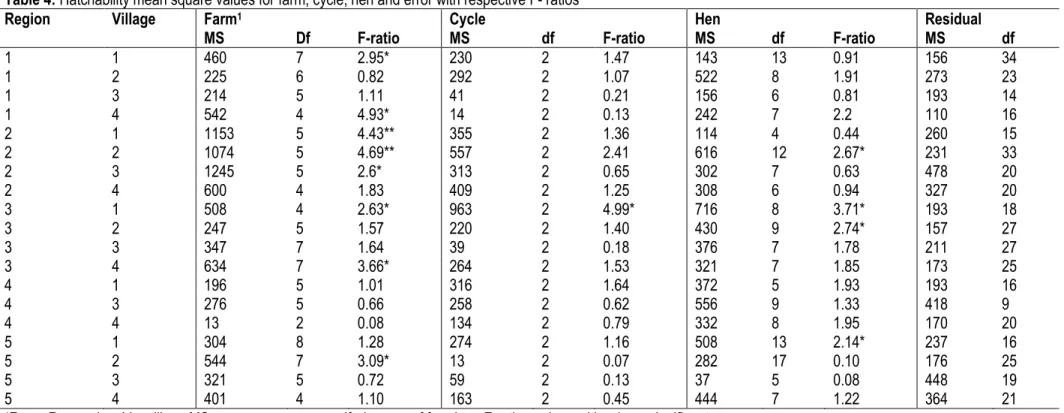
Table 5: Range and medians of error, hen, cycle and farm mean squares.
Source of variation MS range Median of MS range
Error 110 – 478 234
Hen 37 – 1065 352
Cycle 13 – 963 266
Between Farm 13 – 1245 374
Within Farm 140 – 459 264
Figure 3: Cumulative distribution for MS of Farm, Cycle, Hen and Error
The farm and hen medians are larger than the error median while the median of the farm is larger than that of the hen MS. The hen variation is larger than random and therefore shows a consistent variation due to management. Fig 4 provides a cumulative distribution of these MS. There are distinct differences in the level and pattern of the three types of mean squares suggesting differences in hatchability between the farms and among the hens within farms. There was more variation between the farms than there were between the hens indicating farm effects on hatchability were more important than the effects of hen differences. The difference between farm and hen though, is smaller than between hens and error. Management had an influence on the hatchability outcome as was the genetic differences between hens. This is in line with observations by others authors that genetics, environment, management (eggs handling) and egg weight) influence hatchability of chicken eggs (Albrecht, H. N. (2011); Asuquo, et al., 1992; Onagbesan et al., 2007; Van dan Brand et al., 2004; Abiola et al., 2008)
Table 6: Range and medians of error, hen and farm mean squares.
Source of variation MS range Median of MS range
Error 99 – 463 237
Hen 37 – 1065 345
Figure 4: Ordered mean squares plotted against cumulative Farm, Hen and Error mean squares A summary of the Overall hatchability MS in each
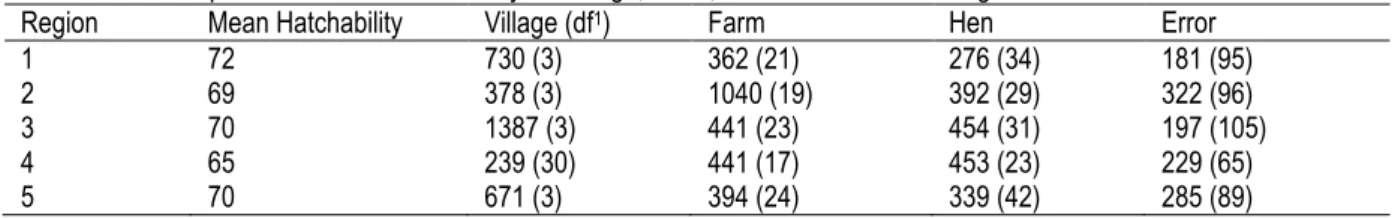
region was also determined for village, farm and hen differences and effects, excluding the cycles. These are shown together with mean hatchability in Table 7. The three variations of village, farm and hen were all larger than the error. The summary provides a further evidence for existence of a farm and hen effect on hatchability. The mean squares in the five regions for
farm, hen and error excluding the MS of village and cycle are also shown in Table 8. The hen and error MS remain unchanged as in the previous table but the farm MS have gone up except in region 2 and 4. There were regional differences in the variations affecting hatchability resulting in different mean hatchability
Table 7: Mean squares and mean hatchability for Village, Farm, Hen and Error in five regions.
Region Mean Hatchability Village (df1) Farm Hen Error
1 72 730 (3) 362 (21) 276 (34) 181 (95)
2 69 378 (3) 1040 (19) 392 (29) 322 (96)
3 70 1387 (3) 441 (23) 454 (31) 197 (105)
4 65 239 (30) 441 (17) 453 (23) 229 (65)
5 70 671 (3) 394 (24) 339 (42) 285 (89)
Table 8: Farm, Hen and Error Mean squares and mean hatchability in 5 regions.
Region Mean Hatchability Farm Hen Error
1 72 408 (24) 276 (34) 181 (95) 2 69 950 (22) 392 (29) 322 (96) 3 70 550 (26) 454 (31) 197 (105) 4 65 410 (20) 453 (23) 229 (65) 5 70 440 (27) 339 (42) 285 (89) CONCLUSIONS
In conclusion, the mean hatchability values in twenty villages ranged from 62 – 76 percent while the individual hatch values in each farm had a wider range of 36 – 96 percent in all the 20 villages. The analysis of variation has shown there is an effect of both farm and hen on hatchability. Different farms had different periods and frequency of application of the four treatments interventions as well as different flock demography dynamic characteristics, which might all have had some influence on the observed hatchability levels. Other authors (Albrecht, H. N.
(2011); Asuquo, et al., 1992; Onagbesan et al., 2007; Van dan Brand et al., 2004 and Abiola et al., 2008) have similar observations on factors influencing hatchability. Mean hatchability values of all farms in each of the five regions are therefore used in regression analysis (Ndegwa, 2006, 2013) to investigate which of these factors had what kind of influence on the hatchability. The analysis of variation has produced evidence for no cycle effect on hatchability while showing large enough variations within and between farms and consequently between
regions. A further regression analysis (Ndegwa, 2006) on the other hand, provided evidence that a number of variables in four different combinations influenced hatchability levels in different regions. Housing was an important factor in region 2 (Ol Kalou) which, as indicated above, happens to be one of the coldest areas in Kenya and hence housing is required to improve on hatchability. The region had also the lowest hatchability levels. Vaccination against Newcastle disease was certainly an important factor influencing hatchability except in regions 4 and 5. Supplementation seemed to have some small effect on hatchability in regions 1 and 4 though not convincingly so, while deworming seemed only to have some effect in region 2 but again this was not convincing. The analysis of variation has produced evidence for no cycle effect on hatchability while showing large enough variations within and between farms and consequently between regions. Lack of cycle effects on hatchability could possibly be associated with the fact that the characteristic was more or less man-controlled. The results of this study
analysis indicate that there is strong evidence that farmers’ actions, (management), animal behaviour (indigenous chicken hens genetic potential) and environment (regions) all have some influence on the performance of indigenous chicken flocks. This study also provides empirical evidence that farmer participatory research is a development concept that has great potential in supporting innovation and technology development and transfer for poverty alleviation and livelihoods enhancing of rural poor people (Gonsalves et al., 2005).There are some commonalities in the concepts and modalities of carrying out both on-station experimentation and farmer participatory research including on-farm experimentation. However, there are also very distinct and significant differences between the two (Okali, et al., 1994). There is therefore the need for the development of strategies that would maximise opportunities offered by these approaches to create and enhance sustainable livelihoods among poor rural people, especially women.
ACKNOWLEDGEMENT
I would like to thank my supervisors, Professor Roger Mead at the school of Applied Statistics, University of Reading UK. , Dr Patricia Norrish and Derek Shepherd at the department of International and Rural Development (IRDD). I would also thank the Director, Kenya Agricultural Research Institute and the Centre Director, KARI, Naivasha, and the staff at both the headquarter and Naivasha, for their support and execution of this farmer participatory study. Special thanks to my former colleagues, Catherine
Kimani and Dr Donald Siamba for their contribution. Many other colleagues at KARI and all the extension friends in all the locations we visited are greatly acknowledged for their contributions and enthusiasm led by Gathu Munga. The staff at the Ministry of Livestock Development Headquarters Nairobi, Mr J. Kiptarus and Mrs C. Ngunjiri for their cooperation and partnership in many poultry activities across our country Kenya.
REFERENCES
Abiola, S.S., Meshioye, O.O., Oyerinde, B.O. and Bamgbose, A.M. (2008). Effect of egg size on hatchability of broiler chicks. Arch. Zootech., 57 (217): 83-86.
Albrecht, H.N. (2011). Reproductive soundness and egg quality in chickens selected for low and high antibody response, M.Sc. Thesis, Faculty of the Virginia Polytechnic Institute and State University, Blacksburg, V.A: 5-32.
Asuquo, B. O., Okon, B. and Eking, A. A., (1992). Quality parameters of Isa Brown and Nigerian local chicken eggs. Nigerian Journal of Animal Production, 19” 1-5.
Dolberg, F., 2008. Poultry production for livelihood improvement and poverty alleviation. O. Thieme and D Pillings, eds. Poultry in the 21st century: Avian influenza and beyond. Proceedings of International Poultry
Conference held 5– 7 November, Bangkok, FAO Animal Production and Health Proceedings, No. 9.
Fanworth, C., Sudell, M., Nzioki, A., Shivutse, V. and Dan, M., 2013 (eds).Transforming gender relations in agriculture in Sub-Saharan Africa. Swedish International Agricultural Network Initiative (SIAN), Stockhom Environmental Institute, Sweden.
FAO, 2008. Poultry in he 21st century: Avian influenza and beyond. O. Thieme and D Pillings eds.
Proceedings of International Poultry
Conference held 5 – 7 November, Bangkok, FAO Animal Production and Health
Proceedings, No. 9. Rome FAO. (Available at ftp://ftp.fao.org/docrep/fao/011/i0323e/i0323e. pdf).
FAO, 2010. Smallholder poultry production: Livelihoods, food security and socio-cultulral significance. K. N. Kryger, K. A. Thonsen, M. A. Whyte and
M. Dissing.(available at
www.fao.org/docrep/013/al.674e/al674e00.pdf )
FAO, 2011. Women in Agriculture – Closing the gender gap for development. The state of food and agriculture 2010 – 2011. FAO of UN, Rome, Italy http://www.fao.org/publication/sofa/2010-11/en.
Gonsalves, J., Becker, T., Braun, A., Camplan, D., Chavev, H., Fajber, E., Kapiriri, M., Rivacamirade, J., Vernooy, M. (edts) 2005. Participatory research and development for sustainable agriculture and natural resource
management: A sourcebook Vol 1:
Understanding research and development.
International Potato Centre – Users’
Perspectives with Agricultural Research and
Development, Laguna, Philippines and
International Development Research Centre, Ottawa, Canada.
Gueye, E. F., 2000. The role of family poultry in poverty alleviation, food security and the promotion of gender equality in rural Africa. Outlook on Agriculture. Vol 29. No 2: 129 – 136.
Kitalyi, A. J. 1998. Village chicken production system in rural Africa: Household food security and gender issues.FAO Animal Production and Health Paper, 142. Rome, FAO (available at ww.fao.org/docrep/003/w8989e/w8989e00.ht m)
Mbugua, P. N., 1990. Rural smallholder poultry production in Kenya. In: Proceedings of A
seminar onSmallholder Rural Poultry
Production 9 - 10th October 1990, Pg 113 – 115, Thessaloniki, Greece: FAO, Rome. MoLD, 1990. Ministry of Livestock Development, Kenya.
Animal Production Division, Annual Report, 1990, Nairobi: MoLD.
Ndegwa, J. M., 1992a. Digestibility and Metabolic Energy determination of ground and unground sesame(Sesamum indicum) seeds in broiler diets. Msc Thesis, 1992, Wageningen Agricultural University, Wageningen, The Netherlands.
Ndegwa, J. M. 1992b. Use of sesame seeds (Sesamum indicum) in broiler feeds. Proceedings, World Poultry Congress - Young professionals program. October 1992. Amsterdam, The Netherlands.
Ndegwa, J. M., Mbugua, H. C. W.,Owango, M. O. and Mburu, B. M. (eds) 1994. Proceedings of second Poultry Research Priority setting Workshop. Naivasha, 15 – 16 November. Kenya Agricultural Research Institute. Kenya. Ndegwa, J. M. and Kimani, C. W., 1997. Rural poultry
production in Kenya: Research and
development strategies. In: Proceedings of 5th Kenya Agricultural Research Institute (KARI) scientific conference, October, 1996. KARI, Nairobi.
Ndegwa, J. M., Tchombe, T., Kabuage, L. W., Mukkibi-Muka, G. and Kosgey, I. S., 1998a. Improvement of indigenous poultry production in Sub-Saharan Africa. A paper presented at the International Course on Intensive Poultry Production held at the Centre for International
Agricultural Development Co-operation
(CINADCO) Kibbutz Shefayim, 4 March - 1 April 1998. P.O. Box 7011, Tel-Aviv, Israel. Ndegwa, J. M., Kimani, C. W., Siamba, D. N., 1998b. A
Rural Poultry Production Manual. In:
Proceedings of rural poultry production workshop. August, 1998. Kakamega: Kenya Agricultural Research Institute. Kenya. Ndegwa, J. M., Kimani, C. W., Siamba, D. N., Mburu, B.
M., Mukisira, E. A. and de Jong, R., 1999. Characteristics of rural poultry production in different agroecological zones in Kenya. In Proceedings of the 6th biennial Kenya
Agricultural Research Institute (KARI) scientific conference 9 - 13 November 1998, pp 540 - 547. Nairobi, Kenya. KARI.
Ndegwa, J. M., Norrish, P. Mead, R., Kimani, C. W., Wachira, A. M., 2000. A research process and methodology focusing on indigenous Kenyan chickens. A paper presented at the Symposium of the International Network for Family Poultry Development (INFPD) at the XXI World’s Poultry Congress. 20 – 24 August, 2000. Montreal, Canada. Available at http//www.fao.org//ag/againfo/subjects/en/infd/
documents/newsletters/Infd111.pdf and
http://www.fao.org/docrep/019/aq634e/aq634e .pdf - The Bangladesh model and other experiences in family poultry development. International Network for Family Poultry Development (INFPD) May-July 2002 and published in Global Journal of Agricultural Research Vol 1 No 2 pp 14 – 28.
Ndegwa, J. M., Norrish, P. Mead, R., Kimani, C. W.,
Wachira, A. M.2001a. The growth
performance of indigenous Kenyan chicken fed diets containing different levels of protein during rearing. Tropical Animal Health and Production, 33 (5), 441-448.
Ndegwa, J. M ., D. D. Shephered1, Norrish, P.1 Mead, R., Kimani, C. W., Wachira, A. M. , Siamba D. N. and Githinji, M. M., 2001b. Participatory strategic approach to development of improved indigenous poultry systems in East Africa. A paper presented at the International Development Conference, Rotorua, New Zealand, 2 – 6 April 2001 and availlable at http://www.fao.org/docrep/019/aq634e/aq634e .pdf - The Bangladesh model and other experiences in family poultry development.
International Network for Family Poultry Development (INFPD) May-July 2002. Ndegwa, J. M, Norrish, P. Mead, R., Kimani, C. W.,
Wachira, A. M., Githinji, M.M., 2001c. Role of family poultry (scavanger poultry) production in sustainable livelihoods and poverty eradication – the case of Wanjiku. A
development story presented at the
International Development Conference,
Rotorua, New Zealand, 2 – 6 April 2001c. Unpublished.
Ndegwa, J. M, Norrish, P. Mead, R., Kimani, C. W., Wachira, A. M., 2002. Hatching characteristics of eggs artificially incubated from six reciprocal crosses of indigenous Kenyan chickens. Tropical Agriculture (Trinidad),Vol. 9 No 1. Ndegwa, J. M, Norrish, P. Mead, R., Kimani, C. W.,
Wachira, A. M.,2005. Growth characteristics of indigenous chickens lines and a cross with Rhode Island Red in Kenya. Tropical Agriculture (Trinidad)) Vol 82 No 1
Ndegwa, J. M., 2006. Participatory research approaches in development of improved management practices in indigenous chicken production system with smallholder farmers in Kenya. PhD. Thesis, University of Reading, UK.
Ndegwa, J. M, Norrish, P. Mead, R., D. D. Shephered, Kimani, C. W., Wachira, A. M., 2012. Growth characteristics of six reciprocal crosses of Kenyan indigenous chickens Journal of Agricultural Science Vol 4 No 6.Pp 160-170. Ndegwa, J. M. 2013 (ed). Improving indigenous chicken
production in Kenya a livelihood strategy. LAP LambertAcademic Publishing https://www.lap-publishing.com/
Okali, C., Sumberg, J. and Farringto, J., 1994 (eds). Farmer participatory research. Rhetoric and reality.Intermediate Technology publications London, UK: Overseas Development Institute. Okong’o , Kabuage, L., Mbugua, P. N. and Ndegwa, J.
M., 1998. The effect of cooking grain amaranth(Amaranthus hypochodriacus) on its utilisation by broiler and indigenous chickens. In Proceedings of Rural Poultry Workshop. Kakamega, July 1998. Kenya
Onagbesan, O. Bruggeman, V., Desmit, L. Debonne, M. Witters, A. Tona, K. Everaert, N. and Decuypere, E: (2007). Gas exchange during storage and incubation of avianeggs: effects on embryogenesis, hatchability, click quality and post – hatch growth. World Poultry Science Journal 63: 557 – 573
Pica-Ciamarra, V. and Dhawan, M. 2010. Small-scale poultry farming and poverty reduction in South Asia: From good good practices to good poilicies in Bangladesh, Bhutamn and India.
New Delhi, South Asia pro-poor Livestock
policy Programmes (available at
http//:sapplpp.org/lessonslearnt/smallscale- poultry-farming-and-poverty-reduction-in-south-asia)
SA PPLPP, 2011. Proceedings of the Workshop in Bangladesh on “Implementation of the National Livestock Development Policy (2007) and National Livestock Development Policy (2008): Impact on Small-scale Livestock
Rearers” (available at
http//:sapplpp.org/files/repository/information-hub/workshop%20proceedings20%28Babglad esh%205thApril%202011.pdf .
Siamba, D. N., Ndegwa, J. M. Kimani, C. W. and Mburu, B. M., 1998. Ethno-Veterinary practices among the Kikuyu in the Rift Valley Province in Kenya. In Proceedings of Rural Poultry Workshop. Kakamega, July 1998. Kenya Agricultural Research Institute (KARI) Kenya. Sonaiya, E. B. 1990. Rural Poultry in Africa.
Proceedings of the International Workshop, Obafemi Awolowo University, Ile-Ife, Nigeria, 13 – 16 November 1998. Ile-Ife, Nigeria, Thelia House Ltd.
Stotz, D., 1983. Production techniques and economics of small holders livestock production systems in Kenya. In: Farm management handbook of Kenya vol. 4. Pp 95 – 106. Ministry of Agriculture, Nairobi.
Thieme, O., Sonaiya, E. B., Alders, R., Saleque M. A. and De Besi, C., 2014. Family poultyr development – Issues, Opportunities and Constraints. Animal Production and Health
Working Paper No. 2. Rome
(http//:www.fao.org/docrep/i019/i595e/i3595e. pdf).
Tuitoek, J. K., Chemjor, W., Ndegwa, J. M. and Ottaro, J. M., 1999. Morphological characteristics and protein requirements of indigenous Kenyan chicken. In Proceedings of the 6th biennial Kenya Agricultural Research Institute (KARI) scientific conference
Van dan Brand, H., Parmentier, H.K. and Kemp, B. (2004). Selection for antibody response against sheep red blood cells and layer age affect egg quality. British Poultry Science, 45: 787-792.