UNIVERSITÉ DE MONTRÉAL
ON-LINE STEADY-STATE DATA RECONCILIATION FOR ADVANCED COST ANALYSIS IN THE PULP AND PAPER INDUSTRY
MILAN KORBEL
DÉPARTEMENT DE GÉNIE CHIMIQUE ÉCOLE POLYTECHNIQUE DE MONTRÉAL
THÈSE PRÉSENTÉE EN VUE DE L’OBTENTION DU DIPLÔME DE PHILOSOPHIAE DOCTOR
(GÉNIE CHIMIQUE) DÉCEMBRE 2011
UNIVERSITÉ DE MONTRÉAL
ÉCOLE POLYTECHNIQUE DE MONTRÉAL
Cette thèse intitulée:
ON-LINE STEADY-STATE DATA RECONCILIATION FOR ADVANCED COST ANALYSIS IN THE PULP AND PAPER INDUSTRY
présentée par : KORBEL Milan
en vue de l’obtention du diplôme de : Philosophiae Doctor a été dûment accepté par le jury d’examen constitué de : M. PERRIER Michel, Ph.D., président
M. STUART Paul, Ph.D., membre et directeur de recherche M. FRADETTE Louis, Ph.D., membre
DEDICATION
“Since all measurements and observations are nothing more than
approximations to the truth, the same must be true of all calculations resting
upon them, and the highest aim of all computations made concerning concrete
phenomena must be to approximate, as nearly as practicable, to the truth. But
this can be accomplished in no other way than by a suitable combination of
more observations than the number absolutely requisite for the determination
of the unknown quantities.”
ACKNOWLEDGEMENTS
First of all, I would like to thank Professor Paul Stuart for all his valuable advices, guidance and tireless support during these years. Jogging together and speaking about science and hypothesis will always make me remember and smile. I am very grateful for all your endless support in many difficult times.
I would like to thank Taiwen Jiang and Larry Wasik for their tremendous help with understanding many important and difficult issues concerning my project. A very big thank you goes out to Bernard Lupien and Jean Bigelow for their invaluable assistance and advices.
I am indebted to my many of my fellow students and colleagues to support me and to endlessly discuss our various project topics. This was special and enriching life experience learning the wide spectrum of our research domains and giving me with many great friendships. Special thank goes to Louis Patrick, Jean-Christophe, Jose, Matty, Virginie Martin and Jean-Martin for their kind friendships and our close collaboration. And of course, I would like to specially thank Agnès who solve many of my administrative problems during these years. There are so important and so easily forgotten by me.
A very special thank you goes out to my “mama Québécois”, who always supported me during all these happy years but also when things were not going as they should. Thank you Catherine, you are a real friend.
A samozrejme, že ďakujem mojím rodičom Ĺudmile a Milanovi, a taktiež mojej milovaanej sestričke Monika doma na Slovensku, že mi uľahčili možnosť isť do Kanady a spraviť si doktorát tisícky kilometrov vzdialený od nich. Ďakujem za celé tieto roky podpory a pochopenia.
And last but not least big thank you goes to Agathe, whose love, trust, honesty and support were always the deepest source of my inspirations.
RÉSUMÉ
L’industrie nord-américaine des pâtes et papiers fait présentement face à plusieurs défis pour survivre dans le contexte actuel. Dans cette optique, le fait de pouvoir comprendre les marges de chacun des produits devient indispensable afin de déterminer un prix de vente optimal et de montrer la vraie rentabilité de la production. Cependant, les systèmes et les pratiques de comptabilité actuels basés sur des recettes prédéterminées ne fournissent qu’une estimation
ad-hoc de ces valeurs, et ne peuvent alors seulement servir que de point de repère pour l’évaluation
de la performance. Par ailleurs, l’implantation des systèmes de gestion de l’information dans les entreprises papetières a permis une meilleure compréhension de la dynamique des procédés et des affaires. Ceci a d’ailleurs permis le développement de méthodes avancées qui les assistent dans le contrôle des coûts et donc dans l’amélioration de la rentabilité. Ces systèmes sont d’une importance capitale pour les producteurs de produits de commodité tels que les usines de papier journal, où de faibles coûts de production sont essentiels pour la survie des entreprises.
Cette thèse a pour objectif de développer une méthodologie permettant une analyse en ligne des coûts manufacturiers pour l’évaluation des coûts marginaux réels, et d’utiliser cette information pour la prise de décision au niveau tactique et stratégique. Cette méthode utilise des données de procédés en temps réel et de coûts provenant du système de gestion de l’information de l’usine. De plus, l’information obtenue peut être exploitée au niveau stratégique de prise de décision afin d’évaluer les impacts des coûts de procédé de diverses alternatives de projets de rétro-installation. Cette méthodologie comprend trois étapes principales. Lors de la première étape, une technique de traitement de signaux, basée sur la transformation multiéchelle d’ondelettes et leur filtrage, est appliquée afin d’analyser simultanément chaque segment du réseau d’instrumentation de l’usine. Cette étape nettoie les données de mesures du bruit à haute fréquence et des anomalies, et cherche à identifier les périodes où le procédé s’approche d’un régime permanent. La seconde étape améliore davantage la qualité des données de procédés en comparant l’ensemble des variables de l’usine à un modèle fondamental de procédé. Cette information sur les procédés est mise à jour par coaptation et correction des mesures biaisées. Troisièmement, cette information opérationnelle est intégrée aux données financières dans un modèle de coûts axé sur les opérations afin de calculer et d’analyser les coûts de production de différents régimes
d’opération. Cette méthodologie a été appliquée à une étude de cas considérant une usine de papier journal et une implantation potentielle du bioraffinage en rétro-installation.
Il a été constaté que le fait d’utiliser une combinaison de la technique des ondelettes avec les techniques de réconciliation de données classiques apportait plusieurs avantages au niveau de l’usine. D’abord, une implantation en ligne de cette technique a été en mesure de fournir un nombre important d’ensembles de données extraites du système de gestion de l’information de l’entreprise. Ces ensembles ont pu ensuite être utilisés pour représenter les opérations en régime permanent. Ils ont aussi fourni une base statistique suffisante pour caractériser la production selon différents régimes d’opérations. Ce faisant, la méthodologie a permis d’améliorer la qualité des données et d’identifier les endroits où l’incertitude des mesures était importantes. Pour le cas relativement simple de l’usine de papier journal, la technique a été en mesure d’obtenir plusieurs ensembles de données représentant les opérations avec un niveau de précision acceptable. Par ailleurs, la combinaison de cette implantation en ligne avec la méthode de réconciliation de données a permis d’améliorer la performance du système d’instrumentation en identifiant les appareils présentant des erreurs systématiques. De plus, il a été montré que si cette technique était implantée à l’usine pour une utilisation quotidienne, elle permettrait d’identifier les mesures erronées en temps réel, améliorant significativement l’instrumentation et le diagnostic des anomalies de procédés. Par ailleurs, l’évaluation des coûts manufacturiers des différents régimes d’opération a fourni de nouvelles façons de visualiser la structure de coûts de l’usine, permettant ainsi d’interpréter de façon transparente les coûts de procédé. À titre d’exemple, dans l’application de ce cadre méthodologique à l’étude de cas de l’usine papetière, les régimes d’opération les plus rentables et les plus coûteux pour la production d’un même grade de papier ont pu être identifiés. La caractérisation et l’interprétation des variances de coûts entre les différents régimes d’opération ont aussi permis d’identifier divers problèmes de production. L’application de cette méthodologie pour l’évaluation des coûts manufacturiers de scenarios de rétro-installation a montré la capacité de cette méthodologie pour utiliser les informations opérationnelles basées sur les régimes afin d’améliorer la prise de décision au niveau stratégique de l’usine. Par exemple, il a été montré que la rentabilité opérationnelle de nouvelles lignes de production intégrées dépend fortement de chacun des régimes d’opérations actuels de l’usine papetière. Les différences entre chacun de ces régimes peuvent ainsi être visible d’une perspective de procédé et permettent l’évaluation des marges des futurs produits et combinaisons
de produits. Entre autres, ces informations sur les différents régimes d’opérations permettraient d’améliorer la rentabilité de futures bioraffineries en fournissant l’information nécessaire pour utiliser de façon optimale la flexibilité des procédés selon les conditions de marché.
Les travaux futurs comprennent l’élargissement de ce travail dans un cadre méthodologique pour l’aide à la prise de décision pour d’investissements stratégiques au niveau corporatif. De plus, une analyse des coûts marginaux basée sur les données réelles et sur une analyse de la performance des opérations pourrait être ajoutée à cette méthodologie afin d’analyser différentes options de procédés de bioraffinage forestier implantés en rétro-installation et différents niveaux de flexibilité.
ABSTRACT
The North American pulp and paper industry currently faces many challenges. Due to its commodity-focused and capital intensive nature, the industry experiences increasing difficulty to survive in the current global market place. Knowing individual product margins becomes essential to determine the optimal unit prices, thus uncovering the real operating profitability of manufacturing. However, current cost accounting systems that are based on predetermined resource spending can provide only ad-hoc assessment of these values, thus serve only as a mill benchmark for cost performance evaluation. The implementation of information management systems in pulp and paper companies has enabled a better understanding of both business and production processes. This allow for the development of advanced methodologies that assist the forestry sector in better controlling costs and improving profits. These systems are of especially critical importance for commodity producers such as newsprint mills, where low production costs are essential for business survivability.
The objective of this thesis was to develop a methodology for online manufacturing cost analysis using real-time process and cost data available from the information management systems that would be capable to assess actual product margin costs, and use this information for operational and tactical decision-making. Furthermore, the knowledge from applying this methodology can be explored in the strategic decision-making level for addressing the process-cost impact of retrofit design alternatives. This methodology consists of three major steps. First, a signal processing technique, based on multiscale wavelet transformation and filtering, is applied to simultaneously analyze every segment of the plant-wide instrumentation network. A second step further improves process data quality by confronting the plant-wide set of variables to the underlying fundamental process model using data reconciliation techniques. The plant-wide manufacturing information is updated by coaptation and correction of biased measurements. Third, this operational knowledge is integrated with the financial data in an operations-driven cost model to calculate and analyze production costs of operating regimes for short and long term benefits of the company. The methodology is applied to a case study considering current newsprint mill characteristics and potential retrofit biorefinery implementation.
It was found that using a combination of the wavelet technique with classical data reconciliation technique provides multiple facility-level benefits. An online implementation of this technique
was able to provide a significant number of data sets that were extracted from the information management systems as potential candidates to represent plant-wide and near steady-state operation. These data sets have provided sufficient statistical basis for characterising manufacturing operation per different operating regime. By doing this automatically, the methodology was able to enhance the quality of data and highlight the manufacturing region where the uncertainty in measurements is significant. The number of near steady-state candidates that can be detected was increased, when state identification parameters were being relaxed. However, it was shown that the uncertainty in the resulting data sets is increasing with relaxing the steady state assumption. In the analyzed rather simple newsprint operation, the technique was able to acquire multiple near steady-state data sets representing plant-wide operation with satisfactory level of accuracy. Moreover, the on-line implementation in combination with data reconciliation method, helped to improve measurement sensor performances by identifying sensors with systematic errors. This valuable information was then used to tune individual instruments further, and hence improve the overall performance of the methodology. Furthermore, it was shown that if this technique is implemented at the facility level for everyday use, it would help identify biased measurements in real-time and thus improve instrumentation and process troubleshooting significantly.
The manufacturing cost assessment based on these data sets that represent individual operating regime, has provided a new insights into the cost structure of the facility with transparent and visible process-cost interpretation capabilities. The application of the overall methodological framework, in the context of real production processes, has proved the ability to identify favourable and costly operating regimes when producing the same product grade. The characterisation and interpretation of the cost variances between individual regimes as well as within the same operating regime helped to identify process problems. Further application of the methodology for evaluating manufacturing costs of retrofit design scenarios have shown the ability to exploit the current operations-driven manufacturing knowledge based on regimes to enhance strategic decision-making at the facility. The results from this application showed that the operational profitability of new integrated production lines strongly depends on the operational differences in current manufacturing regimes of core business products. These differences in manufacturing costs can be visible from a process perspective and enable assessment of individual future product and mix-product margins. This information is essential
for margin-centric supply chain planning of the enterprise and for exploring process flexibility to achieve an optimal production profile according to market conditions.
Future work includes the expansion of this work into strategic investment decision-making at the corporate level in order to enhance tactical and strategic planning. Furthermore, marginal cost analysis based on real-data and operations-performance analysis could be included in the methodological framework in order to obtain more flexible forest biorefinery retrofit designs with good strategic fit.
CONDENSÉ EN FRANÇAIS
L’implantation des systèmes de gestion de l’information dans les entreprises papetières a permis une meilleure compréhension de la dynamique des procédés et des affaires. Bien que les ingénieurs et les comptables incorporent maintenant les données en temps réel dans leurs pratiques quotidiennes, l’utilisation de celles-ci est souvent limitée pour la résolution ad-hoc de problèmes. L’information critique comprise dans ces données n’est souvent pas visible pour les gestionnaires. Les tendances des données sont étudiées, mais l’information est rarement extraite à partir des variables mesurées. Si les systèmes de gestion de l’information pouvaient être exploités à leur plein potentiel, les activités de prise de décisions stratégiques, tactiques et opérationnelles, seraient grandement améliorées par cet accès à une information nouvelle et pertinente.
Les entreprises de pâtes et papiers fabriquent plusieurs produits de commodités selon des spécifications individuelles à chaque client pour satisfaire ces derniers. Le fait de pouvoir comprendre les marges de chacun des produits devient alors indispensable afin de déterminer un prix de vente optimal et de montrer la vraie rentabilité de la production. Les systèmes et les pratiques de comptabilité actuels ne fournissent qu’une estimation ad-hoc de ces valeurs. En fait, on émet généralement une hypothèse d’homogénéité des produits, se traduisant alors par une distorsion au niveau des coûts lors de l’analyse. Les méthodes habituelles de comptabilité des coûts basées sur les recettes ne peuvent alors seulement servir que de point de repère pour l’évaluation de la performance. D’autre part, les calculs de coûts réels obtenus par les méthodes traditionnelles ne fournissent que des coûts agrégés qui sont évaluées de façon top-down. La séparation de ces coûts agrégés en groupes de coûts correspondant à chacun des produits est généralement basée sur le volume, incorporant alors plusieurs variations du procédé en raison de perturbations au niveau des matières premières ou bien de la dynamique du procédé. Cette façon de faire est souvent loin de ce qui se produit en réalité, ce qui rend l’estimation des coûts peu fiable pour la détermination de la vraie rentabilité d’un produit. Les comptables et les ingénieurs de l’usine reconnaissent généralement que le taux auquel chaque usine génère des coûts peut varier considérablement, et ce, même lorsque ces usines fabriquent le même produit. Ainsi, pouvoir déterminer la véritable marge de contribution d’un produit représente un réel défi pour les comptables de l’industrie des procédés, étant donnée que les données de procédé et de coûts sont toutes deux biaisées.
Cette thèse a pour objectif de développer une méthodologie permettant une analyse en ligne des coûts manufacturiers pour l’évaluation des coûts marginaux réels, et d’utiliser cette information pour la prise de décision au niveau tactique et stratégique. Cette méthode utilise des données de procédés en temps réel et de coûts provenant du système de gestion de l’information de l’usine. De plus, l’information obtenue peut être exploitée au niveau stratégique de prise de décision afin d’évaluer les impacts coûts-procédé de diverses alternatives de projets de rétro-installation. Cette méthodologie a été appliquée à une étude de cas considérant une usine de papier journal et une implantation potentielle du bioraffinage en rétro-installation
Une étape essentielle de cette méthodologie est la considération de la flexibilité et des différentes options de production. Les différents régimes d’opération ou façons d’opérer afin de fabriquer un produit doivent être clairement identifiées. Par exemple, pour le cas étudié, il était intéressant d’analyser la variabilité potentielle des coûts de diverses « recettes » utilisées pour produire un même grade de produit, mais utilisant différentes configurations de procédé caractérisées par 1) les différents points de consignes correspondant à une certaine qualité de pâte, 2) le type et l’âge des plaques de raffineurs, et 3) le débit de production. Ensuite, les trois étapes principales de la méthodologie ont été utilisées. Lors de la première étape, une technique de traitement de signaux, basée sur la transformation multiéchelle d’ondelettes et leur filtrage, est appliquée afin d’analyser simultanément chaque segment du réseau d’instrumentation de l’usine. Cette étape nettoie les données de mesures du bruit à haute fréquence et des anomalies, et cherche à identifier les périodes où le procédé s’approche d’un régime permanent. La seconde étape améliore davantage la qualité des données de procédés en comparant l’ensemble des variables de l’usine à un modèle fondamental de procédé. Cette information sur les procédés est mise à jour par coaptation et correction des mesures biaisées. Troisièmement, cette information opérationnelle est intégrée aux données financières dans un modèle de coûts axé sur les opérations afin de calculer et d’analyser les coûts de production de différents régimes d’opération.
Lors de la première étape, l’espace temps-fréquence de chaque point de mesure du système d’instrumentation de l’usine est analysé selon la méthode de transformation et de filtrage des ondelettes proposée. Les données en temps réel sont purifiées du bruit à haute fréquence et des anomalies de procédés. De plus, elles sont utilisées afin d’identifier diverses occurrences de régime permanent. Deux étapes essentielles sont nécessaires pour initialiser la technique des ondelettes :
Recueillir de l’information pour chacun des points de mesure et analyser les données historiques dans l’optique d’identifier la coupe optimale de transformée d’ondelette (WT) pour chaque variable, et
Analyser les données historiques pour initialiser les paramètres optimaux de détection des régimes permanents.
Après avoir appliqué la transformée d’ondelette, le bruit gaussien et les anomalies sont extraites ou éliminées des tendances de procédé. Le signal sans bruit est ensuite analysé afin d’identifier l’occurrence de régimes permanents suivant une méthodologie en trois étapes :
1. Le point de départ de la période de régime permanent est détectée en utilisant les caractéristiques de la WT et de sa première dérivée (valeurs prédéterminées du paramètre alpha)
2. Les composantes à haute fréquence du signal mesuré qui n’ont pas été préalablement éliminées, sont extraites par filtrage. La durée du régime permanent peut ensuite être estimée.
3. La fin du régime permanent est détectée en utilisant les caractéristiques de l’analyse de la WT.
Cette analyse a d’abord été effectuée pour un petit sous-système de l’usine. Les résultats montrent que cette technique est robuste et peut améliorer significativement la précision des variables mesurées, tout en fournissant des candidats de régime permanent variables et multi-variables. Ensuite, pour plusieurs variables présentant des comportements dynamiques importants, les hypothèses de pseudo régime permanent ont été relaxées en relaxant les paramètres de seuil pour la détection des conditions optimales de régime permanent. Les impacts de ces hypothèses vis-à-vis la précision des coûts ont ensuite été abordés afin de calculer les incertitudes reliées aux coûts. Les valeurs de seuil retenues sont directement reliées aux dynamiques du système impliquées dans l’hypothèse de régime permanent. Or, cette information est déjà calculée pour chaque variable, chaque sous-système et l’opération du procédé global. Cette dernière peut alors être utilisée pour améliorer les résultats de l’analyse des coûts en fournissant une valeur de confiance sur les marges d’un produit.
Lors de la seconde étape, l’exactitude et la validité des ensembles de données obtenus lors de la première étape sont améliorées par l’utilisation de la réconciliation des données basée sur une simulation. Cette étape est nécessaire pour fournir des données adéquates au modèle fondamental du procédé correspondant. Lors de l’étude de cas (usine de papier journal), plusieurs instruments mal calibrés ont ainsi pu être identifiés, et leurs valeurs erronées ont pu être ré-estimées et corrigées. La performance de ces instruments de mesure a donc été améliorée grâce à ces informations, qui permirent de mieux les calibrer. De plus, il a été montré que si cette technique était implantée à l’usine pour une utilisation quotidienne, elle permettrait d’identifier les mesures erronées en temps réel, améliorant significativement l’instrumentation et le diagnostic des anomalies de procédés. Une estimation des erreurs de mesure par la matrice de variance-covariance est ensuite effectuée en se basant sur l’analyse de performance de l’instrumentation de l’étape de prétraitement. Les poids de confiance pour chacune des variables sont attribués avec le jugement technique de l’ingénieur. Cette étape de la méthodologie garantit que la représentation des régimes d’opération de l’usine soit en accord avec la modélisation de procédé. Ainsi, le réseau du système a pu être vérifié simultanément pour d’éventuelles erreurs systématiques, aidant les employés de l’usine dans leurs activités reliés à l’instrumentation et à la résolution de problèmes. Il a pu être démontré que l’échec de certains instruments de mesure, ou simplement une mauvaise calibration de ces derniers, menait à des activités de production plus coûteuses. Lors de la troisième étape, l’information caractérisant les différents régimes de production est utilisée conjointement avec les données financières de l’entreprise afin de développer un modèle innovateur de coûts basé sur les opérations donnant des informations pertinentes à propos des coûts manufacturiers, permettant ainsi d’évaluer les marges réelles de chacun de produit. Dans ce modèle, l’évaluation des coûts manufacturiers de chaque régime d’opération est basée sur les principes de la comptabilité par activités (comptabilité ABC). Le modèle de coût est développé avec le détail nécessaire pour extraire l’information liée aux changements lors de l’opération et aux modifications àla conception, et est utilisé pour évaluer les coûts de production par tonne pour chacun des différents grades de papier journal. Ainsi, les coûts manufacturiers directs et indirects de l’usine de papier journal à l’étude ont pu être caractérisés et interprétés afin d’identifier les régimes de production les plus rentables. Plusieurs implications ont pu être tirés des résultats de cette étude de cas pour générer des économies potentielles et procurer un avantage à court terme. D’abord, une amélioration de la compréhension et de la visibilité de la
structure de coûts de l’usine a permis d’effectuer une interprétation des variances de coûts entre l’hiver et l’été, et a aidé à identifier les coûts associés aux transitions. À titre d’exemples, il a été constaté que l’arrêt des unités de récupération impacte de façon considérable les coûts de production en été. Aussi, les modifications quant à l’alimentation en matières premières ont pu être traduites en termes de variance de consommation de vapeur, d’électricité et de produits chimiques. Par ailleurs, il a été constaté qu’une variance significative au niveau des coûts survient quelques temps avant une transition planifiée entre deux produits. Cette variance est principalement due au fait que certains paramètres du second régime d’opération sont utilisés avant même d’avoir terminé d’opérer selon le premier régime.
Lors de l’application de cette méthode pour l’analyse stratégique de futurs projets de rétro-installation, il a été montré qu’un modèle de coûts basé sur les opérations utilisant les principes de la comptabilité ABC permettait d’améliorer le processus de prise de décision en fournissant des informations additionnelles habituellement non considérées. En effet, le modèle de coûts présenté calcule les coûts reliés aux procédés de production et n’effectue pas seulement une évaluation des coûts des produits. Il est donc possible d’analyser les implications de l’utilisation de divers régimes d’opérations pour chaque future option de procédé de bioraffinage implanté en rétro-installation. Entre autres, ces informations sur les différents régimes d’opérations permettraient d’améliorer la rentabilité de ces futures bioraffineries en fournissant l’information nécessaire pour utiliser de façon optimale la flexibilité des procédés selon les conditions de marché.
Les contributions les plus importantes de ce travail sont les suivantes :
Une méthode en ligne basée sur la transformation d’ondelettes et de leur filtrage qui est en mesure de fournir une représentation en régime permanent précise de petits sous-systèmes. Cette méthode peut aussi représenter des systèmes à l’échelle de l’usine pour des applications industrielles où les opérations sont plutôt stables et simples.
Un cadre systématique pour l’analyse et la gestion des incertitudes lors de la représentation d’opérations près du régime permanent. Cette approche pragmatique peut être utilisée pour attribuer automatiquement un niveau d’infidélité à un ensemble de données près du régime permanent représentant un régime de production.
Une approche pratique mais valable pour la validation par modèle de données de procédés basées sur des mesures en temps réel. Cette approche combine la technique de prétraitement par ondelettes et la réconciliation de données basée sur la simulation en un seul système capable de fournir des ensembles de données réconciliés pour des systèmes à faible redondance.
L’évaluation des implications économiques de procédés de fabrication par une approche reliant les données en temps réel et les données réconciliées de l’usine à unemodélisation des coûts basée sur les principes de la comptabilité par activité. Cette approche unique aide à caractériser et interpréter certaines relations de coûts de procédé complexes, et aide à la résolution de problèmes liés aux procédés.
L’utilisation d’une technique unique d’épluchage de données de procédés qui caractérise les régimes d’opération à l’intérieur d’un environnement de production complexe. Cette technique permet d’analyser les coûts réels d’un procédé de production. L’information obtenue permet aussi de caractériser et d’interpréter les différences en termes de profit de différents produits et régimes d’opération, et fournit de nouveaux conseils pour l’amélioration continue.
L’évaluation des impacts des coûts de procédé et des implications de projets stratégiques de rétro-installation par la combinaison systématique de données en ligne de procédés et d’un modèle de coûts avancé basé sur les principes de la comptabilité par activité. L’utilisation d’informations réelles de procédés et donc d’une meilleure compréhension de la structure de coûts de l’usine permet ainsi une meilleure prévision de la performance future de l’activité principale de l’usine, et met en évidence les combinaisons de produits les plus rentables.
Les aspects suivants constituent quelques possibilités de recherches futures :
La méthode présentée pour le calcul des marges de produit pourrait être utilisée afin d’effectuer une gestion de la chaine logistique, une planification et un ordonnancement centrés sur les marges.
Afin d’analyser différentes options de procédés de bioraffinage forestier implantés en rétro-installation et différents niveaux de flexibilité, une analyse des coûts marginaux
basée sur les données réelles et sur une analyse de la performance des opérations pourrait être ajoutée à cette méthodologie.
La méthodologie développée dans cette thèse a été appliquée pour caractériser, interpréter et guider les activités de réduction de coûts pour une seule usine. Ce cadre pourrait être utilisé pour analyser tous les sites de production d’une entreprise dans l’optique d’améliorer la planification stratégique de l’entreprise.
TABLE OF CONTENTS
DEDICATION ... III ACKNOWLEDGEMENTS ... V RÉSUMÉ……. ... VI ABSTRAC….. ... IX CONDENSÉ EN FRANÇAIS ... XII TABLE OF CONTENTS ... XIX LIST OF FIGURES ... XXIII LIST OF SYMBOLS AND ABBREVIATIONS ... XXVI LIST OF APPENDICES ... XXIX
CHAPTER 1 INTRODUCTION ... 1
1.1 Problem statement ... 1
1.2 Objectives ... 4
1.3 Thesis organization ... 5
CHAPTER 2 LITERATURE REVIEW ... 6
2.1 Manufacturing cost analysis ... 6
2.1.1 Introduction ... 6
2.1.2 Traditional cost accounting practices ... 9
2.1.3 Activity based costing accounting ... 10
2.1.4 ABC-like cost accounting ... 11
2.1.5 Product profitability assessment ... 15
2.1.6 Manufacturing costs assessment for retrofit design evaluation ... 17
2.2 Process data reconciliation ... 19
2.2.2 Formulation of data reconciliation problem ... 20
2.2.3 Plant-wide data reconciliation ... 25
2.2.4 Industrial applications of data reconciliation ... 26
2.3 Signal processing ... 29
2.3.1 Introduction ... 29
2.3.2 Wavelet transform ... 32
2.3.3 Process steady-state identification ... 36
2.4 Gaps in the body of knowledge ... 39
CHAPTER 3 OVERALL METHODOLOGICAL APPROACH ... 40
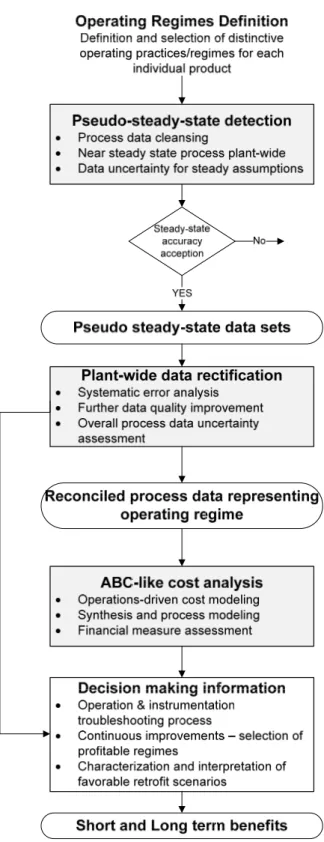
3.1 Overall methodology ... 40
3.1.1 Pseudo steady-state detection ... 43
3.1.2 Plant-wide steady-state reconciliation ... 45
3.1.3 Operations-driven cost analysis ... 46
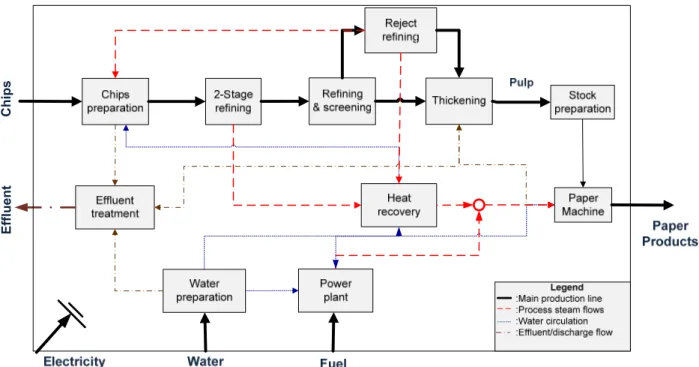
3.2 Case study – Advanced manufacturing cost analysis of current and retrofit design process operations ... 50
3.2.1 Background ... 50
3.2.2 Product cost assessment of a core business - base case ... 50
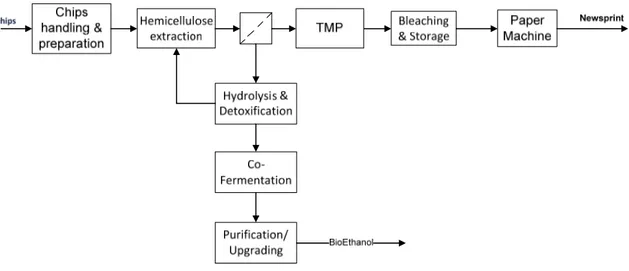
3.2.3 Product cost assessment of selected biorefinery scenarios ... 51
CHAPTER 4 PUBLICATION EXECUTIVE SUMMARY ... 54
4.1 Presentation of publications ... 54
4.2 Links between publications ... 56
4.3 Synthesis ... 58
4.3.1 Operating-regime scope definition ... 58
4.3.2 Signal processing using multiscale wavelet trend decomposition ... 60
4.3.4 Advanced cost analysis for true product margin assessment ... 74
4.4 Conclusions ... 89
CHAPTER 5 GENERAL DISCUSSION ... 91
5.1 Manufacturing cost assessment ... 92
5.2 Data reconciliation ... 94
5.3 Signal processing ... 95
CHAPTER 6 CONCLUSIONS AND RECOMMENDATIONS ... 97
6.1 Contributions to the body of knowledge ... 98
6.2 Future work ... 100
REFERENCES ... 102
APPENDIX A – ... 112
STEADY STATE IDENTIFICATION FOR ON-LINE DATA RECONCILIATION BASED ON WAVELET TRANSFORM AND FILTERING ... 112
APPENDIX B – ... 143
PRACTICAL METHODOLOGY FOR PLANT-WIDE PROCESS DATA RECTIFICATION IN THE PULP AND PAPER INDUSTRY ... 143
APPENDIX C – ... 168
ASSESSMENT AND INTERPRETATION OF ADVANCED COST DATA FOR PROCESS IMPROVEMENT AT AN INTEGRATED NEWSPRINT MILL ... 168
APPENDIX D – ... 192
PRODUCT MARGIN ASSESSMENT FOR PROCESS COST-IMPACT ANALYSIS ... 192
APPENDIX E – ... 214
ON-LINE METHODOLOGY FOR OPERATIONS-DRIVEN COST ASSESSMENT OF OPERATING REGIMES USING REAL-TIME PROCESS DATA ... 214
APPENDIX G – ... 281 PROCESS AND BUSINESS DATA RECONCILIATION IN THE PULP AND PAPER
INDUSTRY ... 281 APPENDIX H – INSTRUMENTATION NETWORK IN THE NEWSPRINT MILLS ... 298 APPENDIX I – ADDITIONAL METHOD DESCRIPTION ... 300 APPENDIX J –METHOD VALIDATION AND TESTING ... 339
LIST OF FIGURES
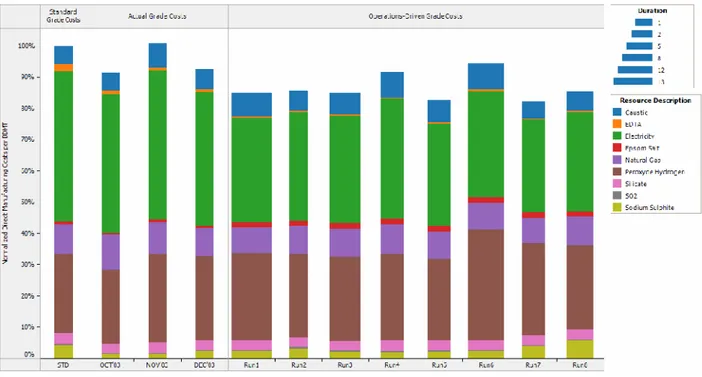
Figure 2.1: Activity-based costing and traditional costing ... 10 Figure 2.2: From micro scale to macro scale complexity or the “chemical supply” chain ... 13 Figure 2.3: Overview of the bottom-up process-based approach ... 14 Figure 2.4: Comparison of standard cost, actual grade cost, and operations-driven grade costing
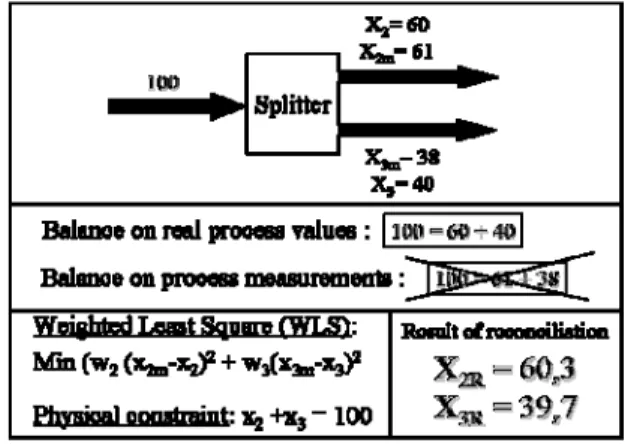
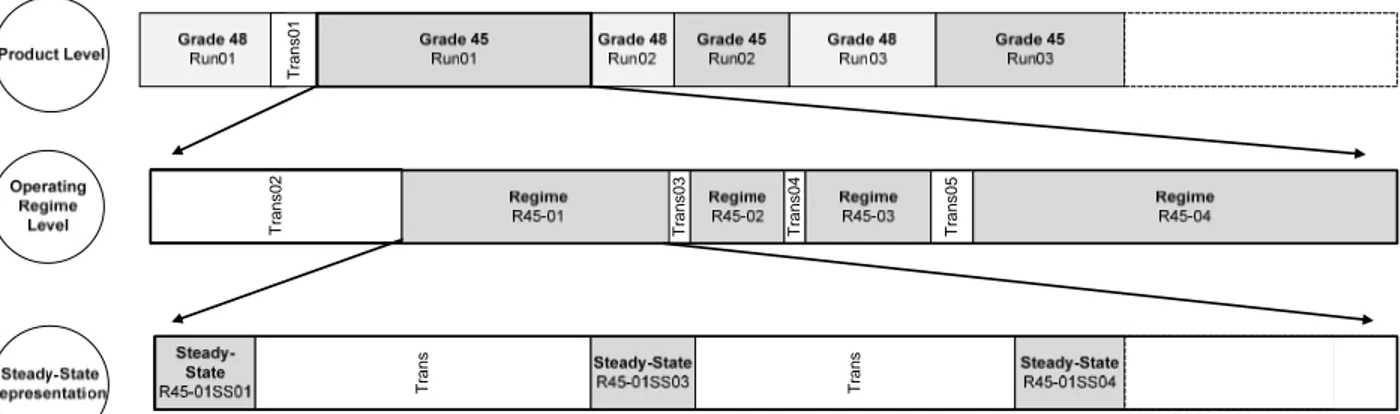
... 15 Figure 2.5: Example of the data reconciliation concept around a splitter ... 21 Figure 2.6: Iterative algorithm in simulation-driven process data rectification ... 29 Figure 2.7: Errors in measurements ... 30 Figure 2.8: Multi-scale wavelet representation of real time measurements. ... 33 Figure 2.9: Inaccurate estimation of steady state periods (Korbel et al, (a)) ... 36 Figure 2.10: Multi-scale decomposition of real-time measurements ... 37 Figure 3.1: Different levels of analysis ... 41 Figure 3.2: Overall methodological approach for production cost assessment of operating regimes
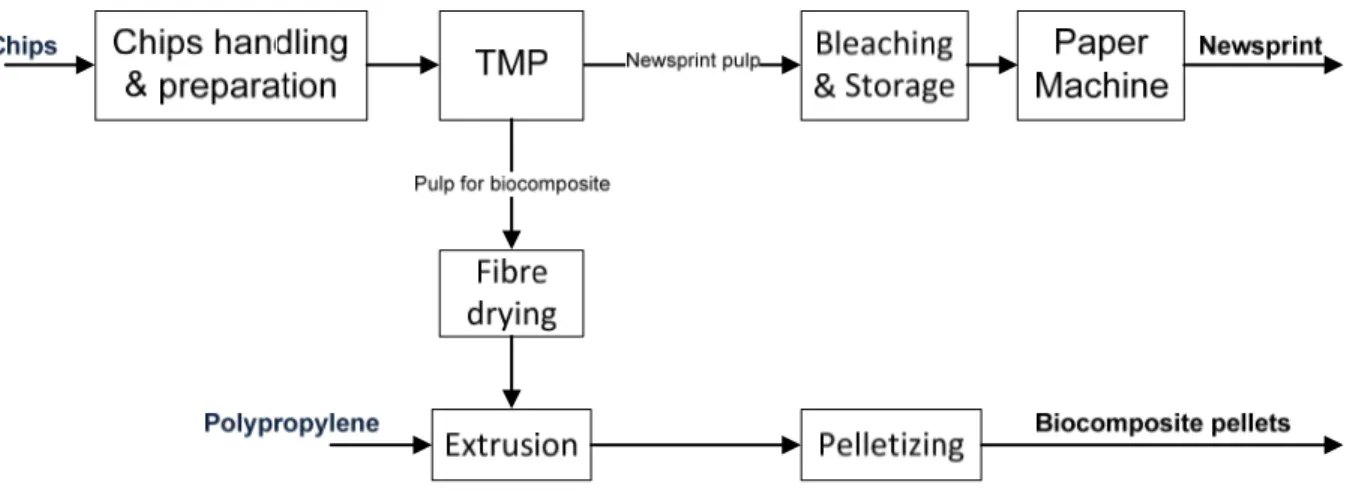
... 42 Figure 3.3: Methodological steps in plant-wide data reconciliation ... 46 Figure 3.4: Methodological steps for building operations-driven cost modeling framework ... 47 Figure 3.5: Dataflow between the operation-driven cost model and process operation and retrofit design analysis ... 49 Figure 3.6: Simplified block diagram of a complex thermo-mechanical pulping process with
paper mill (for detailed mill model presentation see Appendix I) ... 51 Figure 3.7: Simplified flowsheet of simultaneous ethanol production. ... 52 Figure 3.8: Simplified flowsheet of simultaneous PLA production ... 52 Figure 3.9: Simplified flow-sheet of simultaneous biocomposite production ... 53 Figure 4.1: The line of thoughts between individual publications. ... 55
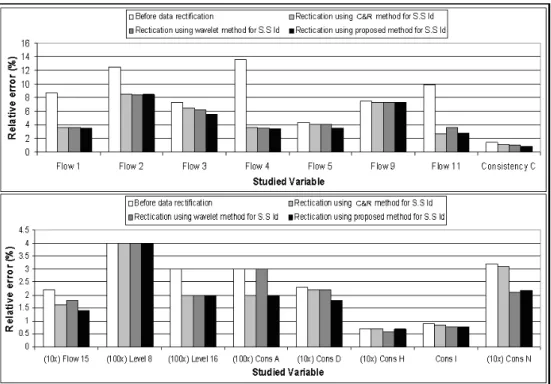
Figure 4.2. An illustration of a operating regime change (production settings) due to required change in pulp quality (presented as a change in one monitored variable - steam production from boilers and recovery units) ... 60 Figure 4.3: Schematic representation of an algorithm for on-line pseudo-steady-state detection . 62 Figure 4.4: Improvement in accuracy achieved by use of various on-line steady-state detection
techniques. ... 63 Figure 4.5: Plant-wide steady state analysis ... 65 Figure 4.6: Steady-state probability of occurrence ... 67 Figure 4.7: Relative error reduction of production rate in different sub-systems of the process
operation ... 71 Figure 4.8: Relative error reduction of pulp flow measurement and its dependence on overall
system redundancy ... 71 Figure 4.9: Example of a corrected biased measurement. ... 72 Figure 4.10: Operating-regime selection based on frequency of occurrence ... 74 Figure 4.11: Implementation of operations-driven cost modeling framework ... 77 Figure 4.12: Definition of the process and overhead work centers which capture various cost
categories within the current business base-case mill. ... 77 Figure 4.13: Production costs of different operating regimes divided into process work centres
and by types of cost ... 78 Figure 4.14: Manufacturing costs of newsprint in different operating regimes ... 80 Figure 4.15: Product operating profitability distribution ... 82 Figure 4.16: Overall manufacturing profitability for each biorefinery scenario ... 83 Figure 4.17: Cost-process impact assessment of different retrofit design alternatives ... 85 Figure 4.18: Process-cost impact of PLA scenario to core business production ... 86 Figure 4.19: Operating profitability of each core product under biorefinery scenarios ... 87
Figure 4.20: EBIDTA forecast and the potential impact of regime costing on product margins, and retirement age of a business. ... 88 Figure 5.1: Smart data dissection for an operations-driven cost modeling approach ... 93 Figure I.1: Overall method presentation ... 301 Figure I.2 Process flow diagram - chips pretreatment ... 303 Figure I.3 Process flow diagram - Main refining line ... 304 Figure I.4 Process flow diagram - Screening ... 305 Figure I.5 Process flow diagram – Reject refining line ... 306 Figure I.6 Process flow diagram - paper machine ... 307 Figure I.7: Process flow diagram - chips pretreatment ... 308 Figure I.9: Process flow diagram - paper machine ... 309 Figure I.10 Process flow diagram - Energy Island ... 310 Figure I.11 Process flow diagram - Energy Island ... 310 Figure I.12 Process flow diagram - Energy Island ... 311 Figure I.13 Legend ... 312 Figure I.14: Wavelet decomposition of a steam measurement (scale 1-4) ... 318 Figure I.15: Wavelet scale selection for random errors removal ... 318 Figure I.16: Scale selection for WT signal decomposition ... 318 Figure I.17: Illustration in 2 dimensions of the four fundamental operations applied to the current simplex by the downhill simplex method ... 327 Figure I.18: Illustrative example of cost calculation (electricity) for an activity - Primary refining
... 336 Figure J.19: Sensitivity analysis of model parameters - Steam ratio in primary refiner ... 344
LIST OF SYMBOLS AND ABBREVIATIONS
Variables and Parameters
A Distance between measured value and steady state average B Distance between successive measurements
Cj Coefficient of the smoothed signal at scale j
Dj Coefficient of the detailed signal at scale j
J Selected wavelet scale for on-line data treatment
G1 Filtered distance between measured value and steady state average
G2 Filtered distance between successive measurements
R Ratio use to detect steady state duration
S Sampling time
WT Wavelet transforms dt
dWT First derivative of wavelet transform
x Filtered average
1
,2,3 Threshold used for steady state starting and ending point identification
1 , 2,3 Filtering parameters
j I i i j i j C ,, Smoothed or approcimated signal , , L j k j k k K D
Detailed signal , j i Discretized scaling function
,
j k
Discretized wavelet function
σ Standard deviation
τi Response time associated with variable i n Duration of true steady state
FC fixed costs
Q mass flow
R revenue VC variable cost
x non-correlated variables of Taylor expansion function Σ Summation
W Variance-covariance matrix (Weighted matrix) vs, Simulated variable
vm Measured variable
Abbreviations
ABC Activity Based Costing
ABCEM Activity-based cost and environmental management ADMT Air-Dry Metric Ton
BPI Biopulping International CVP Cost-volume-profit analysis DCS Digital control systems EtOH Ethanol
FBC Functional-Based Costing FBR Forest Biorefinery
FCF Free Cash Flow FSC Full Standard Costing
GAAP Generally Accepted Accounting Practices
GPK Grenzplankostenrechnung (cost management system) HAC Acetic Acid
HP High Pressure Steam
IMS Information management systems IRR Internal Rate of Return
LP Low Pressure Steam M&E Mass and Energy MSE Mean square error
MTE Measurement trend error
NG Natural Gas
O&M Operation and Maintenance
ODCA Operations-driven costing approach PLA Polylactic Acid
PSE Process Systems Engineering PWC Process work center
RCA Resource consumption accounting RER Relative Error Reduction
ROI Return on Investment
SDDR Simulation driven data rectification t Tons
TMP Thermomechanical pulping process VPP Value Prior-to-Pulping
LIST OF APPENDICES
APPENDIX A – ... 112 STEADY STATE IDENTIFICATION FOR ON-LINE DATA RECONCILIATION
BASED ON WAVELET TRANSFORM AND FILTERING ... 112 APPENDIX B – ... 143 PRACTICAL METHODOLOGY FOR PLANT-WIDE PROCESS DATA
RECTIFICATION IN THE PULP AND PAPER INDUSTRY ... 143 APPENDIX C – ... 168 ASSESSMENT AND INTERPRETATION OF ADVANCED COST DATA FOR
PROCESS IMPROVEMENT AT AN INTEGRATED NEWSPRINT
MILL ... 168 APPENDIX D – ... 192 PRODUCT MARGIN ASSESSMENT FOR PROCESS COST-IMPACT ANALYSIS ... 192 APPENDIX E – ... 214 ON-LINE METHODOLOGY FOR OPERATIONS-DRIVEN COST ASSESSMENT OF
OPERATING REGIMES USING REAL-TIME PROCESS DATA ... 214 APPENDIX G – ... 281 PROCESS AND BUSINESS DATA RECONCILIATION IN THE PULP AND PAPER
INDUSTRY ... 281 APPENDIX H – INSTRUMENTATION NETWORK IN THE NEWSPRINT MILLS ... 298 APPENDIX I – ADDITIONAL METHOD DESCRIPTION ... 300 APPENDIX J –METHOD VALIDATION AND TESTING ... 339
CHAPTER 1
INTRODUCTION
1.1
Problem statement
Canadian pulp and paper products are mature and standardized commodity goods, many of them beyond their product lifetimes. Every day, paper manufacturers are being challenged by diminishing market conditions and by increasing resource and energy prices. Different corporate business strategies are being investigated to remain viable in these tough market conditions and to achieve short- and long-term competitive advantage. Today’s focus on managing at the strategic level by choosing the number of facilities, their locations, and their capacities is helping pulp and paper companies to reduce their enterprise cost curves temporarily. However, managing at the tactical level, in the facility itself, will not only tighten control of manufacturing costs at each individual mill, but will also provide critical information for long-term strategic planning and decision-making. To sustain a successful business in North America, however, these commodity products must first be manufactured at the lowest possible mill-level cost. Today, tactical or operating decisions are based mainly on information derived from mill benchmarking, home-grown cost accounting systems, or a combination of both. It is rare that this information is based on actual process measurement data from information management systems.
In recent years, developments in information technology and management systems and their use in the pulp and paper industry have expanded significantly. The use of these systems is, however, still limited, and they are often used only for troubleshooting. To enhance production profitability and product quality, the information captured in real-time data could be used to promote the development of decision-making tools which would enable mill personnel to react promptly to process and market changes. One of the major opportunities for exploiting the information extracted from the data available from information management systems (IMS) in pulp and paper companies lies in the field of manufacturing cost accounting, where operating-cost-related efficiency improvements remain to be achieved. To grasp effectively the operating knowledge that resides within cost-accounting data, the underlying operating characteristics must be integrated with the cost data. Because traditional cost-accounting practices use top-down cost allocation per volume of production using weekly or monthly statements, some other approach must be used to account for process operations. Activity-based costing (ABC), which has been
developed in the last couple of decades, and its process-based characteristics could enhance production-cost modelling in the continuous manufacturing industries. Many companies, mostly in the discrete manufacturing industry, are saving millions of dollars through well-informed decisions based on results from ABC and its granular view of resource consumption. In the continuous manufacturing industries, however, only a few implementations have been done, with the majority occurring within oil and petrochemical companies. These home-grown enterprise-specific practices are often kept confidential as company know-how and are not available to the public.
Recently, a few applications of ABC-like cost accounting have been demonstrated in several case studies aimed at improving the visibility of manufacturing costs and using this information for higher-level analysis such as supply-chain management and retrofit design decision-making activities. The use of lower-level process data together with financial data in this “bottom-up” cost accounting approach has yielded a better understanding of complex continuous production environments such as those found in pulp and paper mills. In these high-level applications, the relatively long time scale used for cost modelling (weeks to years) is adequate. Further decreasing the time scale (to hours) for production cost assessment could enable tracking of actual product margins and their variations due to changes in operating practices. To do this, the biased process measurement data from information management systems must be corrected; otherwise, wrong cost information could distort the process-cost characterization and interpretation activities. Usually, data reconciliation techniques that enable validation of measured data against a process model are used for this task. This is a common practice in the petrochemical industry, where the fact that production remains fairly stationary enables the use of averaged process data (usually every hour) for data reconciliation. In a continuous manufacturing process which is characterized by faster process dynamics, several holding tanks, and process loops, data reconciliation results may result in an incorrect process characterization. In dynamic papermaking processes, regular use of data reconciliation with averaged measurements would provide an inaccurate process representation if not done carefully. Engineering judgment must be used to evaluate measurement trends to identify a time frame where data reconciliation could be used. This necessary step prohibits the use of classical data reconciliation in on-line applications for validating data from pulp and paper manufacturing processes. Furthermore, because of their
age and characteristics, pulp and paper facilities do not offer sufficient system redundancy in their instrumentation networks for classical data reconciliation techniques to be used.
An on-line method that would be able to extract a measurement data set corresponding to a time frame when the manufacturing operation was near a steady-state process condition would be necessary to enable and facilitate the use of on-line data reconciliation in the pulp and paper industry. Generally, various types of filters are used to analyze the process status around a process unit or a small process subsystem. Very often, such an approach to process state identification fails because of the sudden occurrence of measurement spikes (outliers/abnormalities), resulting on false rejections of near-steady-state occurrence. Furthermore, for large systems or plant-wide applications, near-steady-state occurrence is not obvious because of the natural process dynamics involved between and within the individual sub-systems. The combination of these difficulties prohibits on-line application of data reconciliation in pulp and paper facilities. If a method existed that would provide reconciled data across the entire plant-wide operation and that hence would represent accurately pseudo-steady-state operating regimes (characterized by operating practices), the appropriate advanced cost models could then provide a unique operating profitability assessment of these production processes. This approach would provide, for the first time in the pulp and paper industry, access to the actual operating margins for each product, enhancing significantly mill cost-control strategies and providing an opportunity to use this information for far-reaching applications.
The aim of this work was therefore to develop a systematic methodology which would be able to provide valuable information on product operating margins for on-line industrial applications and to facilitate the use of this information to generate valuable decision-making knowledge. The near-steady-state detection technique should be able to detect and eliminate abnormalities, clean high-frequency noise from process data, and identify when plant-wide operation is near steady-state conditions. The data reconciliation technique should be able to compensate for the lack of redundancy in pulp and paper processes and to incorporate steady-state detection tools to enable an automatic flow of information among tools. The cost-accounting framework should be able to capture cost-process relationships eloquently in the form of visible and transparent resource-consumption insights. The cost analysis must further be able to analyze process cost impacts to generate a better understanding of the integration of new production facilities in retrofit design analysis.
1.2
Objectives
The discussion in the problem statement leads to the formulation of the main hypothesis of this work, which is entitled, “On-line steady-state data reconciliation for advanced cost analysis in the pulp and paper industry”:
Given the availability of data and the emergence of information management systems, significant improvements in the profitability of pulp and paper mills can be achieved by coupling real-time process information with product and cost information, and interpreting both on the basis of plant-wide reconciled pseudo-steady-state data.
This main research assumption can be divided into three sub-hypotheses:
Near steady-state conditions of a plant-wide operation can be identified from real-time
data by using signal processing techniques based on wavelet transform.
It is possible to use reconciled process data representing near steady-state operating
regimes for instrumentation and process troubleshooting in pulp and paper mills.
Product-based cost information can be assembled for continuous processes by resolving
the product cost structure for different process operating regimes, thus providing information on the product operating margin in each case.
Given the problem statement and the hypothesis as formulated, a systematic methodology was developed to demonstrate the value of the proposed framework in advanced production cost analysis for short- and long-term benefits. The methodology is presented through a case study of an integrated thermo-mechanical newsprint mill, which has the following objectives:
Main objective
To develop a practical methodology for making available on-line plant-wide reconciled
process and business data in a form suitable for advanced decision-making and to demonstrate the value of this approach using a case study.
To develop an on-line technique for analyzing process status and to identify when the
manufacturing operation is near steady-state conditions.
To develop a process model for data reconciliation technique in order to acquire
reconciled near steady-state data sets that represent plant-wide operating regime and that can be simultaneously used for detecting biased instruments.
To develop an operation-driven cost methodology that would systematically assess the
manufacturing costs of an operating regime, with the ability to interpret cost variability and to use this information for the short- and long-term benefit of the company.
1.3
Thesis organization
This thesis is organized as follows: In Chapter 2 the relevant literature is reviewed in order to identify the gaps in the body of knowledge. The next chapter presents the methodology and the case study to which the methodology is applied. Chapter 4 synthesizes the results obtained in the process of demonstrating the methodology. In Chapter 5 general conclusions are given, followed by the contributions to knowledge and recommendations for future work presented in Chapter 6.
CHAPTER 2
LITERATURE REVIEW
In this chapter, a critical review of pertinent literature was carried out. The thread of thoughts starts with section 2.1 covering the general principles of manufacturing costs assessment. Then, a critical review of classical cost analysis based on standard recipes and monthly spending, followed by the recent cost control improvements over the last decades.
The assessment and analysis of process-based manufacturing costs requires using lower time-scale than the traditional practices (hours). Essentially, this requirement creates the necessity to improve the accuracy of process characterisation. The representation of manufacturing processes must be based on reconciled process measurements (Section 2.2) in order to validate the measured variables with a process model, and thus make the overall fundamental manufacturing cost balances justified. Usually, production cost analyses are steady-state applications and hence section 2.3 deals with the pertinent literature done in the field of signal analysis for process state identification.
2.1
Manufacturing cost analysis
2.1.1 Introduction
Every business environment must exploit some level of cost-control strategies in order to analyze its variability in performance. For this purpose, cost and financial accounting measures are exploited. Cost accounting is the pillar of the accounting framework that provides valuable financial insight to decision makers. Commonly, the information provided is confidential and is used only internally to help managers find the optimal way to maximize the company’s profits. The environment and the outcome of decision-making activities is the cost accounting system. Many business companies and production facilities use several various cost accounting systems for problem-solving. Considering that the limits of practice are entirely within the company’s control, the prepared cost reports can be based on whatever rules, standards, or rational bases. Generally, the cost accounting knowledge is exploited in the second pillar of an accounting framework, financial accounting. This branch of accounting deals with public
corporate information used solely for a company’s financial statements, and its preparation must follow generally accepted accounting principles (GAAP).
The general control elements of cost accounting can be divided into three pools: material, labor, and overhead costs. Direct material and labor costs are generally variable costs and are a function of the number of units manufactured or sold. Overhead costs, on the other hand, are fixed costs that do not change with the level of production. For instance, management salaries, rent, or depreciation expenses do not vary from month to month, even though the rate of production is never the same. The ability to track these various cost elements accurately determines the value of the accounting system to final decision-making activities. In the early 20th century, this task was not difficult because overhead costs were negligible compared to material and labor. However, it became more complex to account correctly for indirect and overhead costs once the face of manufacturing had shifted from a labor-intensive to a machine-intensive environment.
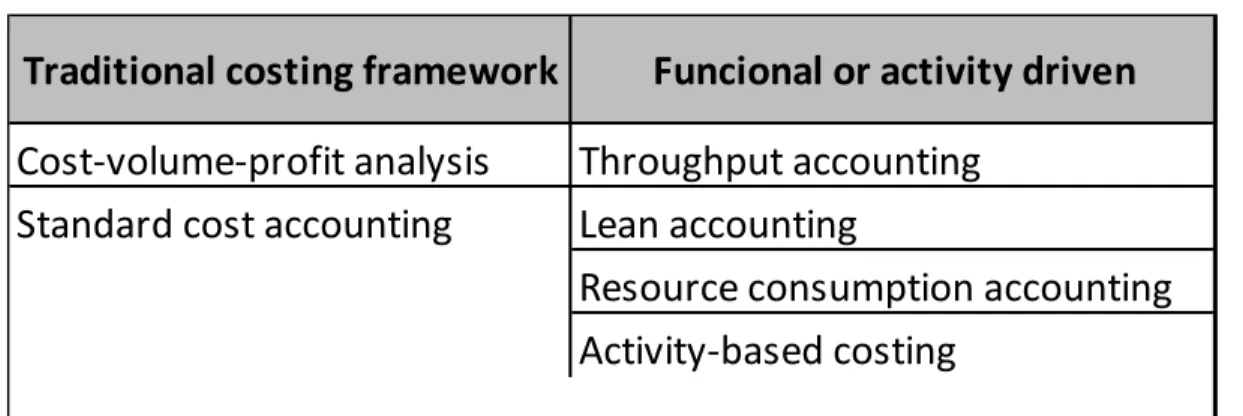
Clearly, the ultimate goal in every organization should be to control these different types of costs. Often a company chooses to use only one costing system, even though there are several approaches available. The most commonly used in today‘s industrial practice are summarized in the table below:
Table 2-1: Cost accounting systems
Cost‐volume‐profit analysis
Throughput accounting
Standard cost accounting
Lean accounting
Resource consumption accounting
Activity‐based costing
Traditional costing framework
Funcional or activity driven
The first two systems, cost-volume-profit and standard costing, are often referred to as
traditional or normal costing and are used extensively in the pulp and paper sector. This
traditional approach was created for the needs of the early industrial era when the total costs were dominated by variable elements (Enotes, 2011). The overhead and other indirect costs are
accounted for based on simple volume-based measures such as labor or machine hours. Therefore, a product with a low level of labor hours is allocated less overhead cost. However, the actual costs may be very different if this product requires special attention or testing. The resulting unit production cost becomes even more distorted when overhead and other indirect costs begin to dominate overall manufacturing costs. Then it is strongly recommended that other supplementary costing systems be used. The following four costing principles are rather new in management accounting. These enhanced costing methods belong to the group of functional-based costing (FBC). The common factor of all four is the introduction of more levels of detail to the company’s cost structure. This is done by simply assigning and allocating the individual costs to the unit-level of operation. This approach then aggregates the granular representation of costs in to the mill level for cost reporting and/or cost control purposes. The allocation bases and drivers are expressed by the use of production throughput or direct labour hours and machine hours. Thus, individual processing units, subsystems and activities (departments) are characterised as the consumer of resources. The end products are then consuming these individual activities, instead of the direct assignment of all costs to end product.
Throughput accounting was developed for the enterprise-wide level, to help identify factors that limit the enterprise in achieving its established goals (Eliyahu 1992).
In lean accounting, the essential philosophy is to preserve value with less work. This approach was developed for the car industry which was aiming to eliminate waste while simultaneously minimizing production costs and time, using techniques such as poka-yoke (Robinson 1997) or value-stream mapping (Rother 1999).
Resource consumption accounting (RCA) is a fully integrated and complex managerial approach that uses available state-of-the-art methods. The combination of the German
Grenzplankostenrechnung (GPK) cost management system and activity-based costing
principles create a system that can be used and interpreted by non-accountants. The next two sections explain more in details the cost structures and cost practices that are incorporated within these different types of cost accounting system.
2.1.2 Traditional cost accounting practices
Generally, continuous industry such as mining, pulp and paper, in some cases petrochemical and chemical industries use accounting practices that are dominated by traditional costing, because of its simplicity and the wide understanding of this approach among accountants. An important part of standard costing is a variance analysis. By breaking down the overall variance into the three pools listed below, this analysis helps managers identify where the difference between actual and budgeted costs has occurred (Table 2.2):
Table 2-2: Example of some of the elements of traditional cost variance analysis
Cost‐volume variances
Material‐cost variation Volume variation Labor‐cost variation
This valuable information assists managers to identify the source of the overall cost variance, but not the cause of it. For instance, if the variance is largely due to material-cost variation, accountants with the help of process engineers need to drill down into historical process data to interpret the variance and take appropriate action.
The problem is that traditional costing considers all costs as variable with regard to production volume. This often creates inaccuracy in fixed costs whenever the volume of production changes. Furthermore, arbitrary rather than cause-and-effect overhead allocation makes the traditional approach highly inappropriate in a multiproduct environment. Another problem in the current general accounting profession, not only in the forestry sector, is the emphasis on financial accounting. Most of the time, decision-makers must create their own cost analysis based on financial accounting reports. However, these statements contain aggregated and distorted costs with no activity data incorporated, leading to poorly informed decisions. There are a few existing advanced systems at the academic level (operations-driven cost modeling developed by Janssen, 2011; cost-function modeling by Fogelholm, 2000) or already being used by advanced processing industries such as the petrochemical sector. The pillar of these approaches is the principles of activity-based costing, which is briefly discussed in the following section.
2.1.3 Activity based costing accounting
Activity-based costing (ABC) is a new philosophy that emerged in the 1980s in response to overhead allocation discrepancies (Kaplan 1989). By simply adding an activity as a link between resource consumption and a cost object, the knowledge of costs incurred in the organization is improved significantly. The activity becomes a fundamental cost item whose value is directly assigned to the final cost objects such as products and customers. In other words, the rate of resource spending is traced to an activity, and the activity is then traced to the product, as shown in Figure 2.1 (Korbel and Stuart (c))
Figure 2.1: Activity-based costing and traditional costing
The significant advantage of using ABC is that it attempts to assign all costs to final cost objects, including marketing, engineering, and administrative costs. This added ability to trace indirect costs directly enables accountants to track overheads rationally and as closely as they track direct costs. This is done by making use of so-called drivers. As shown in Figure 2.1, resources are linked to activities by resource drivers, and similarly activities are linked to cost objects by cost drivers. According to this definition, resource drivers determine the amount of a resource consumed by each activity, while activity drivers specify how different cost objects (products, customers) consume these activity costs. Labor hours, kWh, and number of shipments are examples of resource drivers, whereas number of customers and number of products are examples of the second stage, the activity driver. The difference between these drivers is that the former focuses on why things happen and the latter on what happens (Emblemsvåg and Bras
2001). The implementation of an ABC system may be a complex and expensive task, and therefore it is important to determine the minimum number of appropriate drivers that will meet accounting objectives.
As shown in Figure 2.1, the process-oriented character of ABC means that it is implemented in two simple and logical stages, while structure-oriented traditional costing is implemented in one. This fundamental principle is the basis for increasing the accuracy of the cost data (Drucker, 1996). Traditional costing cannot encompass this critical linkage between actual causes and associated costs. Furthermore, advanced ABC has recently evolved into multistage systems where individual activities can be used by other activities before being used by final cost objects, thus enhancing even more the accuracy of cost modeling (Emblemsvåg and Bras, 2001).
In a continuous manufacturing context, the process-oriented character of an ABC system and the causal relationships between cost drivers and activities make the method highly suitable for modeling and analyzing costs. The availability of real-time cost and process data from information management systems (IMS) makes ABC easier to implement. It must be made clear that ABC is a cost accounting system that can help managers understand their actual costs and improve their profits efficiently. Traditional methods are complementary to the financial reporting prepared according to GAAP.
2.1.4 ABC-like cost accounting
A cost accounting system that is used by a wide spectrum of industries is the resource
consumption accounting (RCA), whose development has been strongly influenced by German
cost accounting and ABC principles. The structure is very close to variable costing, a well-documented method discussed in cost accounting textbooks, but rarely used by industry. RCA and its variations are extensively used by advanced processing industries such as mining, petrochemicals, and chemicals. Often their costing methods are confidential and inaccessible to the public or to researchers. In general, RCA is based on three fundamental pillars (for further details, the reader should refer to Friedl and Kupper (2005)):
between resource spending and a company’s costs and revenues;
Quantity-based model: The value of the costing system is created in this pillar by the use of operations data and models. Traditional costing uses the output of variance analysis with dollar values, which create overhead-costs bias due to their fixed nature. By contrast, RCA exploits causal operational relationships;
Cost behavior: Understanding the nature of costs is a very important aspect of the third pillar of RCA. The clear distinction between direct, indirect, variable, and fixed costs is based on aggregating pools.
There have been significant changes in recent years, although not well documented; some forestry companies are approaching now ABC-like costing for improved decision-making activities. For example, Fogelholm (2000) has discussed the difficulties of product costing in the paper making industry and its potential industrial application. This approach is now a pillar of Metso Automation's MetsoDNA - Dynamic Network of Applications (Metso, 2011) that some companies are presently using for product-customer decision making as well as it helps their budgeting activities. The application seek to anticipate and determine the resource requirements for the next individual customer orders based on current raw material content, dimensions and quantities of the paper product (Fogelholm, 2004).
Several applications of process-driven accounting frameworks have been developed based on ABC philosophy with potential industrial applications. For example, an approach that integrates ABC principles with environmental metrics to perform analytical economic and environmental assessment for decision-making activities was developed by Emblemsvåg and Bras (2001). Their activity-based cost and environmental management (ABCEM) system is extensively discussed in their 2001 book. The use of an uncertainty variable introduces extra complexity and versatility into the system. The ABCEM has been applied to a wide range of industries including furniture, carpets, and supply vessels, where it has provided insights and highlighted potential areas for improvement.
Lastly, a sophisticated ABC-like approach that integrates process and cost information into one system is called operations-driven costing (Janssen and Laflamme-Mayer 2011) method. The basis of this approach is in making a link between costs and process operations data using principles similar to those of activity-based costing. This approach is similar to RCA in some aspects, but