HAL Id: hal-00329335
https://hal.archives-ouvertes.fr/hal-00329335
Submitted on 14 Jul 2004
HAL is a multi-disciplinary open access
archive for the deposit and dissemination of
sci-entific research documents, whether they are
pub-lished or not. The documents may come from
teaching and research institutions in France or
abroad, or from public or private research centers.
L’archive ouverte pluridisciplinaire HAL, est
destinée au dépôt et à la diffusion de documents
scientifiques de niveau recherche, publiés ou non,
émanant des établissements d’enseignement et de
recherche français ou étrangers, des laboratoires
publics ou privés.
G. Haerendel, E. Georgescu, K. H. Glassmeier, B. Klecker, Y. V. Bogdanova,
H. Rème, H. Frey
To cite this version:
G. Haerendel, E. Georgescu, K. H. Glassmeier, B. Klecker, Y. V. Bogdanova, et al.. Cluster observes
formation of high-beta plasma blobs. Annales Geophysicae, European Geosciences Union, 2004, 22
(7), pp.2391-2401. �hal-00329335�
6Centre d’Etude Spatiale des Rayonnements, Toulouse, France 7Space Sciences Laboratory, University of California, Berkeley, USA
Received: 19 November 2003 – Revised: 19 May 2004 – Accepted: 28 May 2004 – Published: 14 July 2004 Part of Special Issue “Spatio-temporal analysis and multipoint measurements in space”
Abstract. Late in a sequence of four moderate substorms
on 26 July 2001, Cluster observed periods of a few minutes durations of high-beta plasma events (B<10 nT, β=2–30), connected with dipolarizations of the magnetic field.
Clus-ter was located near 02:45 MLT, at R=19 RE and at about
5◦N GSM. These events began late in the recovery phase
of the second and about 5 min before onset of the third sub-storm and lasted for three hours, way beyond the recovery phase of the fourth substorm. The most remarkable obser-vation is that the onset coincided with the arrival of ener-getic (E∼7 keV) O+ions and energetic electrons obviously from the ionosphere, which tended to dominate the plasma composition throughout the remaining time. The magnetic flux and plasma transport is continuously directed equator-ward and earthequator-ward, with oscillatory east-west movements superposed. Periods of the order of 5–10 min and strong correlations between the magnetic elevation angle and log
β(correlation coefficient 0.78) are highly reminiscent of the high-beta plasma blobs discovered with Equator-S and Geo-tail between 9 and 11 REin the late night/early morning
sec-tor (Haerendel et al., 1999).
We conclude that Cluster observed the plasma blob for-mation in the tail plasma sheet, which seems to occur pre-dominantly in the recovery and post-recovery phases of sub-storms. This is consistent with the finding of Equator-S and Geotail. The origin is a pulsed earthward plasma transport with velocity amplitudes of only several tens of km/s.
Key words. Magnetospheric physics (plasma convection;
plasma sheet; storms and substorms)
1 Introduction
The literature on substorms is huge, but it concentrates mainly on the onset and the expansion phase. The recovery
Correspondence to: E. Georgescu
and post-recovery phases find comparatively little attention. One of the most striking phenomena of the latter is the omega bands, protrusions or tongues of auroral emissions extending poleward from the post-midnight oval and drifting eastward at speeds between 0.4 and 2.0 km/s. The name was given by Akasofu and Kimball (1964) because the boundaries of the tongues are reminiscent of an inverted Greek letter . Re-lated to the optical phenomena are the Ps6 magnetic pulsa-tions with periods between 5 and 40 min, mainly expressed in the Y - and Z-components of the surface magnetic field (Saito, 1978). Simultaneous observations of -bands and Ps6 pulsations by Baumjohann (1979) and Opgenoorth et al. (1983) have led to models of the associated 3-D current system. Later measurements of the ionospheric electric field and conductances by use of the EISCAT radar provided a more detailed model of the current closure between Hall and Pedersen and field-aligned currents (Buchert et al., 1990). The first report on related magnetospheric activity was pro-vided by Steen et al. (1988), who observed strong modula-tions in the intensity of energetic electrons (E>1 keV) at the geostationary orbit (6.6 RE). However, according to
Pulkki-nen et al. (1991), omega bands project mainly to larger equa-torial distances, namely 6–13 RE. In this range, more
pre-cisely between 9 and 11.5 RE, Haerendel et al. (1999) found
striking plasma and magnetic field variations in the morning sector reaching beta values of 10 and more. They were shown to have an antisymmetric structure with respect to the equa-tor, to drift eastward with speeds of typically 20 km/s and to have lifetimes of at least 15–30 min. These high-beta struc-tures were named plasma blobs and were later identified as magnetospheric counterparts of Ps6 pulsations (i.e. also -bands) by Vaivads et al. (2001b).
A particularly noteworthy feature of the high-beta plasma blobs is their preferred occurrence during magnetically quiet periods (Haerendel et al., 1999). If the plasma was injected during a preceding substorm, their lifetimes must be very long, i.e. the associated field-aligned currents weak. Other-wise, the associated Poynting flux into the ionosphere would
IMAGE magnetometer network 2001-07-26 18 19 20 21 22 23 00 Hour (UT) X-COMPONENT 400 nT 1 minute averages NAL LYR HOR HOP BJN
High beta events
Fig. 1. IMAGE magnetometer data for 26 July 2001, 18:00–24:00 UT, X-components only.
cause fast damping (see also Vaivads et al., 2001b). In
other words, while the plasma blobs may relate to Ps6 pul-sations, they do not necessarily create optical emissions like
-bands. This is probably restricted to the recovery phase of substorms. Finally, it must be noted that Haerendel et al. (1999) concluded that the high-beta plasma blobs must exist out to the morningside magnetopause.
In this paper we report Cluster observations at 19 RE of
high-beta plasma events of a few minutes duration which are quite reminiscent of the plasma blobs found with Equator-S at 9 to 11 RE. They seem to originate in the recovery
pe-riod of a substorm within the morning section of the de-caying substorm current wedge. The most striking similar-ities with the plasma blobs closer to the Earth are the cor-relation between magnetic elevation angle and plasma beta, sloshing motions of the plasma along the field lines, and the persistence into quiet periods. What is different is the lack of a steady eastward motion which characterizes the plasma blobs further inward. At 19 RE a persistent earthward
mo-tion was found. We, therefore, suggest that Cluster encoun-tered the source region of plasma blobs/Ps6 pulsations. If this identification holds out, it will have an impact on the interpretation of the Ps6 pulsations and plasma tongues in the -bands. They have been related most often to Kelvin-Helmholtz instabilities (e.g. Rostoker and Samson, 1984), to an electrostatic interchange instability (Yamamoto et al., 1993, 1997), or, in case of the potentially associated com-pressional Pc5 waves, to a drift mirror instability (Hasegawa, 1969; Baumjohann et al., 1987). In all these cases one would
expect the plasma to move outward rather than earthward in-side the high-beta region. For this reason, we will offer a different interpretation.
2 Instrumentation
In this paper we use mainly 1 spin (4 s) averages of the mag-netic field measured with the fluxgate magnetometers (FGM) on board Cluster (Balogh et al., 2001) from all four Cluster spacecraft. The proton and oxygen data are from the Clus-ter Ion SpectromeClus-ter (CIS) on board spacecraft 1, 3, and 4. The CIS sensor comprises (R`eme et al., 2001) (1) a time of flight mass spectrometer, CIS-1, which combines a top-hat analyzer with an instantaneous 360×8◦field-of-view with a time-of-flight section to measure complete 3-D distribution functions of the major ion species H+, He++, He+and O+
in the energy range between 0.02 and 38 keV/q, (2) a Hot Ion Analyzer, CIS-2, measuring the ions’ distribution from 5 eV to 26 keV by combining a classical symmetrical quadri-spherical analyzer with a fast particle imaging system based on microchannel plate electron multipliers and position en-coding.
3 Geophysical conditions
The period under consideration (26 July 2001, 18:00– 23:00 UT) was only mildly geomagnetically disturbed. After 3.5 h of very quiet conditions, AL dropped to about −160 nT between 18:00 and 18:25 UT and after that recovered to-wards about −20 nT by 22:00 UT. This reflects the behavior of the IMF Bzas measured by the ACE spacecraft at the L1
position. It had been positive between 12:30 and 17:00 UT, then turned negative and remained so until about 22:30 UT with 2B,GSM>−40◦.
The IMAGE magnetometer network in Scandinavia and Finland registered a sequence of substorms, the first of which began at 19:10 UT, when Cluster was about five hours further to the east (Fig. 1). In the area covered by this network, the second substorm and the first local one began at 20:02 UT, corresponding to about 22:30 MLT, and lasted for about 1/2 h. The auroral electrojet (AEJ) was centered far to the north near Hopen Island (magn. lat. 73.06). The third sub-storm, commencing at 20:47 UT, was centered even slightly further north. A fourth substorm followed at 21:40 UT and
subsided at 22:20 UT, about the time of Bz turning
pos-itive. The AEJ was centered well north of Ny ˚Alesund
(λmagn=75.25). The maximum excursions of the negative
X-component stayed below 200 nT.
The IMAGE satellite covered only the first two substorms until 20:22 UT. The second one started a few minutes ear-lier than the beginning of the expansion phase as registered by the IMAGE magnetometer network. Figure 2 shows three frames covering this event. It started near midnight and ex-panded west- and eastward and also to the north, up to about 76◦by 20:11 UT. This is consistent with the ground magne-tograms.
19:59 UT
20:05 UT
20:11 UT
Fig. 2. IMAGE/FUV images for the second substorm on 26 July 2001 in geomagnetic latitude-MLT projection.
In summary, Cluster experienced a sequence of four mod-erate substorms centered around midnight while being a few hours further into the late night sector and located near the northern edge of the plasma sheet at a distance of about 19 RE.
4 Overview of Cluster observations
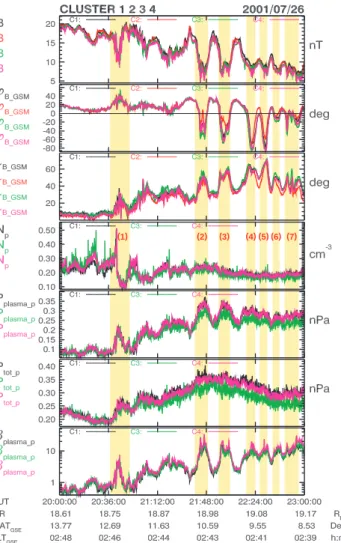
Figure 3 shows, for four hours and in polar GSM coordinates, the magnetic field, measured by all four Cluster spacecraft, and from S/C 1, 3, and 4, proton density, Np, plasma
pres-sure, Pplasma−p, and total pressure, Pt ot −p, based on these
data sets, and the plasma beta. During the first substorm,
(1) (2) (3) (4) (5) (6) (7)
Fig. 3. FGM magnetic field data in polar GSM coordinates (B,
δ, ϕ) and CIS proton data (density, plasma pressure, total pressure and plasma β) for the 4 Cluster spacecraft for 26 July 2001, 20:00– 23:00 UT. The colors of traces, conform convention, are black, red, green, and magenta for Cluster 1, 2, 3, and 4, respectively.
Cluster seems to have still been in the northern tail lobe. At 19:51 UT (not shown) the magnitude of B drops slightly and plasma density and pressure rise markedly. Cluster entered the plasma sheet, probably unrelated to the onset of the sec-ond substorm a few minutes later. Otherwise, nothing re-markable happened until 20:42 UT.
This time marks the beginning of the period of events on which this paper focuses. In Figs. 3 and 7, they have been marked with (j), j=1–7. These events are characterized by a few minutes of strong directional changes of B coincident with decreases of |B| and rises in beta. The most dramatic change in the data when entering into this period is seen in the spectral distribution and flux of energetic electrons (20– 40 keV) (Fig. 4) as measured with the PEACE and RAPID experiments (Escoubet et al., 1997) and the flux of O+ions (Fig. 5). After 20:42 UT the oxygen flux rises gradually from insignificant background counts to densities of about 0.01 cm−3. This means that the mass density of O+is almost comparable to that of the protons, and stays at this level until
2001-07-26 2001-07-27 18:00 20:00 22:00 00:00 10-3 100 103 101 Electron Energy k e V 10 100 1000 1 100 10000 Electron Cnts . PEA CE RAPID
Fig. 4. Energetic electron spectrograms from PEACE
(10−2−30 keV) and RAPID (10−103keV) experiments.
a few minutes before midnight. The mean energy of the O+ ions is near 7 keV. We can thus state that the period before 20:42 UT is H+-dominated and the period after is strongly O+-enriched, as far as the mass density is concerned. One might be tempted to speculate that the presence of a strong hot O+-component is causally related to the events to be dis-cussed subsequently. However, we will argue that it is only indicative of the nature of the plasma environment, as is the high electron temperature of about 2 keV in the region under investigation.
5 The arrival of O+-ions
We will now have a closer look at the field, plasma and flow signatures of event (1), characterized by the arrival of O+.
Figure 6 shows the plasma and field data during the inter-val of interest, 20:35–20:50 UT, somewhat expanded. The event begins at 20:39 UT with a change in the magnetic field vector followed by a fast increase in H+-density and pres-sure. The azimuth and magnetic elevation angles increase, whereas the magnitude of B falls. At this time, no significant flux of O+is yet visible. Three minutes later, at 20:42 UT, the H+density falls dramatically from 0.5 cm−3to 0.2 cm−3, while plasma pressure and beta rise equally fast to a maxi-mum. The proton temperature (not shown) rises by a factor of about 4, while |B| stays at a minimum of 12 nT for 3 min. This is the time of O+ arrival. After 20:45 UT all quanti-ties begin to return to the undisturbed level, which is reached
at 20:50 UT. Here, O+shows a few minutes drop-out.
Im-mediately after 20:50 UT λmagn begins to rise again to be
followed by plasma pressure and beta, whereas |B| and Np
(i.e. H+-density) drop again. The prominent feature of the
period from 20:35 to 21:00 UT is the arrival of O+.
Where does the O+ come from? Most likely from the
ionosphere. This is, indeed, supported by the flow velocity vector calculated on the ground from the H+energy distribu-tions measured by the CODIF sensor of the CIS-experiments. Figure 7 shows separately the three cartesian (GSM) coordi-nates of the transverse and parallel proton flow velocities. The arrival of the O+-ions appears as the most pronounced event in the H+-based velocity data until 23:40 UT, when Cluster crossed briefly the neutral sheet (not shown here). Between 20:42 and 20:52 UT, i.e. at the time of O+arrival, a
100 1000 10000 SC1 H + (eV) 100 1000 10000 1 1000 1/cm 2-s-sr-(eV/e) 100 1000 10000 SC1 O + (eV) 100 1000 10000 0.1 10.0 1/cm 2-s-sr-(eV/e) 0.0 0.1 0.2 0.3 0.4 0.5 0.6 SC1 H + n (cm -3) 40-40000 (eV) 0.001 0.010 0.100 SC1 O + n (cm -3) 500-40000 (eV) 2000 -13.3 -12.3 4.7 18.7 -2.2 2.6 76.6 2100 -13.7 -12.3 4.2 18.9 -3.3 2.7 76.7 2200 -14.0 -12.3 3.6 19.0 -3.7 2.7 76.8 2300 -14.4 -12.3 3.1 19.1 -3.5 2.6 76.8 6 8 10 12 14 16 18 20 SC1 B (nT)t hhmm 2001 Jul 26 GSEX GSEY GSEZ DIST MLAT MLT ILAT Thu Apr 3 14:22:56 2003
Fig. 5. Oxygen data (CIS experiment) for Cluster 1. Panels show proton and oxygen spectrograms, densities and the FGM magnetic field strength.
clear flow antiparallel to B is observed in the H+-component with a peak value (except for a very narrow spike) of about 160 km/s. This is consistent with the assumption that Cluster encountered the arrival of plasma freshly injected from the ionosphere.
At about 20:38 UT, the transverse flow component (Fig. 7) starts to rise from a near-zero level (≤30 km/s) to values up to and above 200 km/s in the positive x- and negative y- and
z-directions, more or less in phase with the increasing ele-vation and azimuth angles of the magnetic field. The V⊥x
-and V⊥z-components are consistent with the observed
dipo-larization of the magnetic field under frozen-in conditions. The negative V⊥y-component, on the other hand, indicates
an arrival of the perturbation from earlier hours, i.e. from the midnight sector. By 20:46 UT, V⊥reverses rapidly its
direction, most pronounced in the y-component. A few min-utes after, O+ is seen to drop out for another few minutes.
This observation can be interpreted as a short-term rebounce of an O+-loaded flux-tube which had been convected to the Cluster position from the midnight sector. By 20:55 UT the previously seen eastward motion, connected with a reappear-ance of O+and a dipolarization of B, is resumed and lasts for about 8 min. No parallel flow is observed anymore at this time, as if the plasma had come to rest except for a slow east-ward convection. The magnetic elevation angle stays near 35◦and the azimuth close to its nominal value for the local time.
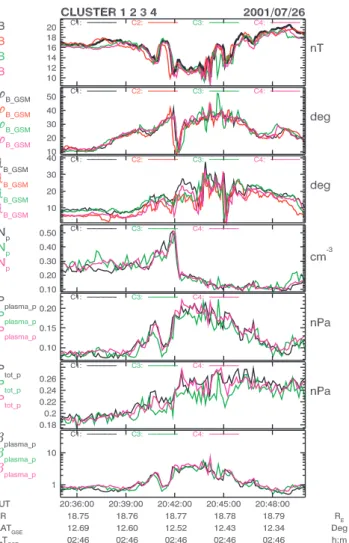
Fig. 6. FGM magnetic field data in polar GSM coordinates (B, δ, ϕ) and CIS proton data (density, plasma pressure, total pressure, and plasma β) for the 4 Cluster spacecraft for 26 July 2001, 20:35– 20:50 UT)(event #1). The colors of traces, conform convention, are black, red, green, and magenta for Cluster 1, 2, 3, and 4, respec-tively.
The just described plasma and field data from the period 20:38 until 21:03 UT can be consistently interpreted as show-ing the convective transport of magnetic field loaded with hot O+-enriched plasma, from earlier local times, a short re-bounce, and a reappearance. Particular attention should be paid to the change in the magnetic azimuth angle during this
event. Before 20:38 UT, ϕGSM varied between +10◦ and
+20◦which is close to the expected pointing at 02:45 MLT. With the beginning plasma pressure increase and magnetic field decrease and dipolarization, the azimuth angle rises up to 40◦. Figure 8a shows a sketch of the likely magnetic field configuration before 20:38 and at 20:44 UT, the time of max-imum field distortion. The observed parallel and transverse flow vectors at 20:44 UT are shown as well.
The observed bending of the magnetic field lines so that the more distant section is leading in the sense of the az-imuthal plasma convection (Fig. 8a) suggests that the driv-ing forces of field deformation and plasma motion have been applied from mostly outside the Cluster position. The
aver-(1) (2) (3) (4) (5) (6) (7)
Fig. 7. Plasma velocity perpendicular (in the three upper panels) and parallel (in the three lower panels) to the magnetic field in Cartesian GSM coordinates.
age eastward convection velocity during the interval 20:36– 20:46 UT was about 40 km/s, corresponding to a displace-ment of 24 000 km or 3.75 RE. At a distance of 18.8 RE,
this corresponds to an eastward displacement of ∼12.5◦
or 50 min MLT. The short reversed flow from 20:46 until 20:51 UT occurred with a similar average speed, but lasted only half as long. This means that the rebounce motion cov-ered only about half the length of the initial eastward dis-placement. Subsequently, the eastward motion was resumed. For the 10 min of strong antiparallel, i.e. outward directed, flow (20:42–20:52 UT), the average speed was near 60 km/s, corresponding to a parallel displacement of 5 to 6 RE. The
absence of a noticeable parallel flow upon the return of O+ indicates that the plasma had come to rest. Actually, caful inspection of the data for the following half hour re-veals some short-term oscillations of Vkand a longer,
coher-ent return flow componcoher-ent (parallel B) between 21:06 and 21:47 UT, as if the plasma was sloshing back towards north-ern latitudes.
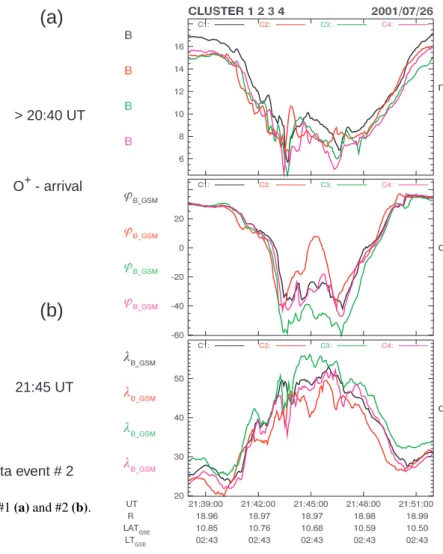
meridian equator 24 LT > 20:40 UT O+ - arrival meridian equator 21:45 UT
high beta event # 2 v v v ⊥ v v ⊥ ⊥ v⊥ = =
(a)
(b)
Fig. 8. Sketches of magnetic field lines for events #1 (a) and #2 (b).
6 Subsequent high-beta events
The period following the arrival of O+until about 23:00 UT contains some striking events of 7 to 10 min duration, num-bered (2) to (7), whose most prominent characteristics are a strong increase in the magnetic elevation angle, λB, up to
and beyond 60◦ in phase with a strong increase of beta up to and above 10, while the total pressure, plasma plus mag-netic, is nearly unaffected (Fig. 3). Also in phase with λB
is a strong excursion of the azimuth angle, ϕB, into negative
values. While the behavior of λBand beta in these events is
quite similar to that at the arrival of O+(event 1), ϕBchanges
in the opposite direction. The field is pointing towards late morning hours.
Throughout the period from 21:30 until 23:00 UT, during which these events were observed, the transverse plasma ve-locity has dominantly positive x- and negative z-components (Fig. 7). This tendency is even more clearly expressed during the period between O+-arrival and the first of the here dis-cussed events (2), i.e. from 21:00 to 21:30 UT. This means that the plasma and field transport is essentially earthward and equatorward, as sketched in Fig. 8b. The longitudinal transport is less clear, but there is a tendency for V⊥y to be
negative, i.e. to point eastward, prior to and in the first half of event (2), and positive in the second half. For the subsequent events, no clear tendency is observed. The plasma is more
Fig. 9. Magnetic field (FGM data) in polar GSM coordinates for event #1.
or less stagnant, with the average velocity in +y-direction between 21:40 and 23:00 UT being about 4 km/s. The more surprising are the strong negative excursions of the magnetic field vector in azimuth which is such a prominent feature of events (2)–(7). A simple interpretation is that Cluster is lo-cated close to a node of the distorting motion of the field lines.
The diagram in Fig. 8 suggests that the low-altitude tion is eastward (−y-direction) and the high-altitude mo-tion, i.e. outside the Cluster posimo-tion, slowly westward (+y-direction). This is not inconsistent with the instanta-neous y-components of the transverse plasma flow during event (2), which is mostly positive. But this is not at all shared by the later events. Apart from the correlation of beta and λB, and the generally earthward convection, events (2)
to (7) exhibit a different behavior from that of the O+-arrival (event 1). Obviously there was a massive eastward transport of the plasma which came to rest and was more or less stag-nating during the subsequent two hours with respect to the E-W motions while consistent by moving earthward.
at the four Cluster spacecraft may provide additional insight. Such a task is relatively easy if the observed phenomenon has a well-defined surface or 3-D-shape. This is obviously not the case here. Therefore, our insights are of limited signif-icance. However, we can at least test whether the sequence of entrance into and exit out of the high-beta structures is consistent with the earlier deductions from the transverse ve-locities. We will inspect only the O+-arrival period and event #2.
Event #1: O+-Arrival. The onset of the depression in |B| at 20:41:30 UT is observed in the sequence, S/C 2
(20:41:36.3 UT), S/C 1 (20:41:49 UT), S/C 4 (20:41:51 UT), S/C 3 (20:41:54 UT), i.e. S/C 2 was hit by the high-beta re-gion well before the other three S/C whose entry occurred within 5 s (Fig. 6). In other words, the boundary of the arriv-ing high-beta region was oriented more or less parallel to the plane constituted by S/C 1, 3, and 4. S/C 2 was at a distance of 1624 km from this plane in the direction of 21:00 LT and of 41◦above the GSM equatorial plane. This means that the high-beta plasma arrived approximately from this direction, quite consistent with the above evaluation of the plasma flow velocities. An average delay time of 15 s yields a progression velocity of ∼110 km/s, in good agreement with the measured plasma flow velocity.
The exit velocity at 20:45:30 UT follows approximately the same sequence, S/C 2, 1, 4, 3, but it is not as clear-cut as during the entry. In between, i.e. during the time of strong magnetic field depression and the arrival of O+-ions, one sees a high variability of B. It is extremely difficult to make sense out of the sequencing of similar variations seen at the four spacecraft. One prominent minimum in B seen at S/C 3 at 20:44:37 UT (green contour) has no counterpart at the other 3 spacecraft. This whole behavior clearly sug-gests that the high-beta region is not simply passing through the position of Cluster, but is strongly evolving by structured parallel and transverse mass transport.
Event #2: The entry of Cluster into the depressed B-region
at 21:41 UT shows a different sequence of events, namely S/C 2, 3, 4, 1 with more or less equal separation periods, in total about 30 s (Fig. 9). This suggests a propagation ve-locity of the order of 60–70 km/s. If interpreted as a planar front, its normal vector must have pointed at ϕ=−30◦ with
λ=−10◦. At the exit from this event, the sequence is 2, 1, 4, 3, if derived from the fast change in the elevation angle. Again, the behavior of the magnetic field is quite confusing
0.2 0.4 0.6 0.8
sin λ
GSM
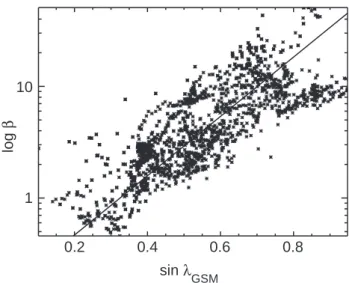
Fig. 10. Correlation between logβ and sinus of magnetic field ele-vation (δGSM)for the period 20:40–24:00 UT.
and does not lend itself to an interpretation in terms of simple geometric shapes of the high-beta events, much in contrast to the plasma blobs observed by Equator-S. In other words, the plasma is in a rather agitated state.
8 Discussion and interpretation
On 26 July 2001, the Cluster S/C met very pronounced changes in the field and plasma quantities at a position within
the plasma sheet at 19 RE, 03:00 MLT, and ∼5◦N GSM.
Most striking were the in-phase increases of magnetic ele-vation angle and beta.
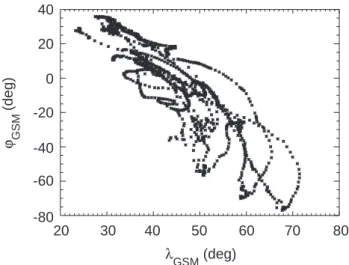
Figure 10 shows the correlation of log β and sin λ for the time interval 20:40–24:00 UT, the correlation coefficient be-ing 0.78. At the same time, the azimuth angle of B changed as well, but for the first event in the positive and for the later ones (2–7) in the negative sense. This is demonstrated in Fig. 11 which contains the azimuth, ϕ, and elevation, λ, data in GSM coordinates for the interval 21:40–23:00 UT, i.e. ex-cluding the O+-arrival event. Here the correlation coefficient is −0.88. While the correlation between high β-values and elevation demonstrates the not surprising fact that dipolar-izations of the magnetic field are connected with earthward plasma transport and compression, the further correlation with changes in the field azimuth contains information on the forces driving the E-W convection of plasma and field. As discussed above and sketched in Fig. 8a, the positive excur-sion of ϕ, in conjunction with an eastward convective flow, as observed in event #1, implies a dragging of the flux-tubes by eastward directed forces outside and equatorward of the position of Cluster, which is not the case during the subse-quent events #2–7, as seen in Fig. 11. First, the field is bent into the negative ϕ-direction, and no appreciable and system-atic convective flow has been observed during these events. This absence of in-phase motion has been interpreted above
40 -40 -60 -80 20 -20 0 20 30 40 50 60 70 80 λGSM (deg) ϕ GSM (deg)
Fig. 11. Correlation between magnetic field azimuth and elevation in GSM during the period of events #2 to 7 (21:40–23:00 UT). Cor-relation coefficient is 0.88.
as indicating that Cluster was near a node of the magnetic field line distortions. The negative sign of 1ϕ then means that this distortion was enforced from below, probably as a result of an eastward convection in the ionosphere which is not shared by the flux-tubes’ high-altitude portions. Oppos-ing pressure forces may be actOppos-ing there.
A better insight into the nature of the high-beta events and the conditions for their appearance can be obtained, if we integrate the y-component of the perpendicular veloc-ity, V⊥y, over time. Under the frozen-field assumption, this
yields a measure of the E-W distance of the position of Clus-ter from the edge of the eastward expanding region filled with O+-ions and containing the high-beta events. Figure 12 shows this distance, Sp−y , as a function of time. The east-ward convection began at about 20:38 UT and stopped at 21:40 UT, at the time of event #2. The edge had moved by 70 000 km in the −y-direction, which is equivalent to a separation by 1.5 h in local time. At the position of Cluster, maximum pressure had been reached, while the temperature continued to rise slowly for another 45 min.
A better view of the spatial structure is provided by plot-ting the proton temperature measurements versus distance,
Sp−y, from the leading edge, as done in Fig. 13. The color coding is consistent with that of Fig. 12 and allows the asso-ciation with the times of recording. One finds a sharp in-crease in temperature at a distance of about 30 000 km or about 1/2 h from the passage of the leading edge. T⊥ rose
from an average of 25 MK to a mean temperature of 80 MK with a broad range of fluctuations, but no discernable spatial trend.
What one learns from these considerations is that the high-beta events under investigation are embedded in a broad sub-storm wedge of several hours local time extent characterized by high pressure due to a strong rise in temperature under the reduction of the density (cf. Fig. 3) . The eastern edge of this region passed the Cluster position in the late recovery
RED 20:35:30 - 20:45:12 GREEN 21:40 - 23:00 20:33:20 21:06:40 21:40:00 22:13:20 22:46:40 CLUSTER 1 2001/07/26 20:00:00 - 23:00 8×10⁴ 4×10⁴ 0 Sp-y [km]
Fig. 12. Separation distance (Sp−y) of the leading edge of the eastward expanding substorm wedge to the Cluster location versus time.
phase of the second substorm and several minutes before the onset of the third substorm (20:47 UT). The edge was fol-lowed by the first high-β event. It coincided with the arrival of O+-ions of several keV mean energy, which persisted for the whole period of interest and made a strong contribution to the mass density. These ions had been convected towards the location of Cluster from earlier hours and, as evidenced by the parallel velocity, from lower altitudes. Although the high-beta events started in the middle of a sequence of four mild substorms, no close relation with the substorm activity could be discerned. The events continued into the quiet pe-riod after the substorms, albeit with decreasing amplitude of the excursions in λ, ϕ, and β. On the other hand, it is obvi-ous that the energetic O+-ions must have originated from the ionosphere and their acceleration must have been powered by the substorm energy.
Indeed, it is most likely that the energetic O+-ions were accelerated in the ionosphere in the course of the second sub-storm (onset shortly before 20:02 UT) which, according to the IMAGE-FUV observations, was centered near midnight, i.e. three hours earlier in local time, and at about five degrees lower latitude than the magnetic footprints of the Cluster po-sition. (The third substorm, on the other hand, began after the O+-arrival.) By about 20:11 UT, the second substorm had
expanded sufficiently far pole- and eastward to come close to the Cluster field lines (see Fig. 2). The travel time of 7 keV O+-ions to the Cluster position, if directly injected upward, would be only about 8 min. The delay until their arrival at Cluster can only be attributed to a still existing longitudinal separation of the field lines of injection from the Cluster po-sition by a few degrees. During the 6 min prior to the appear-ance of O+at 20:42 UT, the y-component of V⊥rose from 0
to 90 km/s eastward (Fig. 7), covering about 30 000 km (see Fig. 12) or more than 1 h in local time. This supports strongly our conclusion that Cluster became immersed in an eastward expanding substorm wedge.
After the O+-plasma flows had settled, only smaller
field-aligned flows were observed, with alternating directions (max. amplitudes ∼50 km/s), indicating a sloshing between hemispheres with a superposed flow outward. The transverse motions were consistently directed earthward, i.e. towards lower L-values while more or less stagnating in local time. Since the O+-ions persisted throughout this period, we can conclude that the flux-tubes carried inward towards the po-sition of Cluster had been loaded with ionospheric plasma prior to these events.
ported here. They are dominated by inward transport and stagnation in longitude. Hence, it is tempting to conclude that what we see here is the formation phase of the blobs some 8 to 10 RE further outward. The observation of a very
irregular internal structure at Cluster distance supports the view that the blobs are forming here, while later, once the high-beta plasma has penetrated towards 11 RE and further
inward, it has quieted down and assumed a more orderly spa-tial structure.
A question that could not be answered from the observa-tions with Equator-S and Geotail pertains to the origin of the plasma blobs. The Cluster observations reported here, if correctly identified as showing the formation phase of these blobs, may carry us a step forward. Undoubtedly, they are related to substorms, but they extend well beyond the actual substorm activity, closer to the Earth, even for several hours (Haerendel et al., 1999). Obviously, the hot plasma inside a substorm wedge provides a source for the blobs. They are generated by a pulsed inward plasma and field transport un-der dipolarization of the magnetic field in regions of limited longitudinal extent. The question remains: what is the origin of the pulsed formation of a few minutes duration?
The lack of close correlation with the substorm activity ex-cludes a connection with the major reconnection events un-derlying the substorms. Could it be small-scale, transient reconnections? Such a conjecture cannot be excluded, but it implies that the actual reconnection process was located fur-ther outward and sufficiently far away that breaking of the associated earthward reconnection jet had already occurred outside the position of Cluster (cf. Haerendel, 1992; Sh-iokawa et al., 1997). At this point, we have to ask ourselves whether such transient reconnection events might be facili-tated by the presence of O+-ions, as proposed with respect to the onset of tearing instabilities in the tail current sheet by Baker et al. (1982, 1989). Their argument was based on the increased ion gyroradius in comparison with the
thick-ness of the plasma sheet. Was the O+ presence, which is
such a striking feature of the period under discussion, causal or coincidental for the high-beta events? The mass density of O+was about equal to that of the hydrogen plasma, thus affecting the overall inertia of the plasma. But in the light of our present understanding of the reconnection process (e.g. Shay et al., 1998; Hesse et al., 2001) which emphasizes the impact of the vast difference of the electron and ion inertia on the structure and dynamics of the diffusion region, it is hard to imagine that an increase in the ion mass density by
Sp_y [km]
Fig. 13. Perpendicular proton temperature versus Sp−y. The colors correspond to the time intervals marked in Fig. 12.
a factor of two would have severe dynamical consequences. We rather take the view that the O+-ions populating the east-ern region of the substorm wedge do not play an important dynamical role. They are seen just as characteristics of the magnetosphere-ionosphere coupling processes driving field-aligned currents, setting up potential drops, heating and ac-celerating ionospheric heavy ions up to several keV energy as observed here.
If we exclude transient reconnection, what else can trigger the dipolarizations and earthward transport? A convincing answer to this question must be consistent with four observa-tional facts: (1) The high-beta events extend far beyond the recovery phase of the substorms (Fig. 1); (2) starting with event #2 the total pressure decreases steadily (Fig. 3); (3) there is no substantial E-W, but only a mean earthward trans-port (Figs. 6 and 11); (4) the magnetic meridian plane is bent more strongly towards midnight during the events (Fig. 11). The first observation suggests that the events are rearrange-ments of plasma and field within the tail plasma sheet, but not fresh injections from a more distant reconnection line. If the latter occurred, we would expect an overall pressure increase, contrary to fact (2). Furthermore, the field should be distorted so as to diverge more strongly outward, in order
BOUN
DARY LA
YER
EQS
CLUSTER
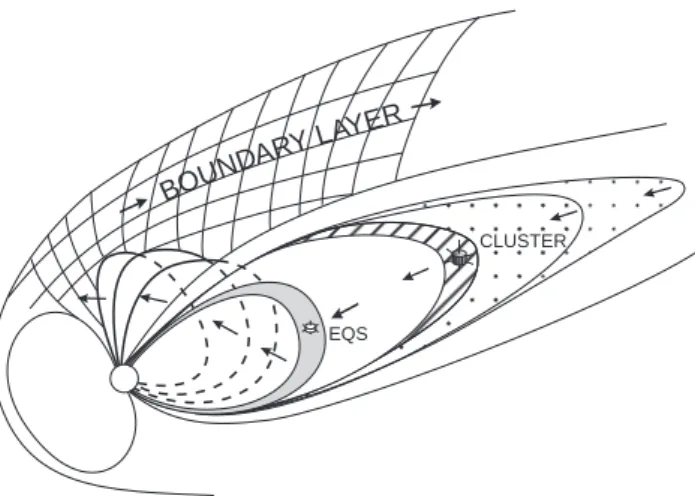
Fig. 14. Cartoon visualizing the suggested plasma transport by the high-β-events from the tail through the outer magnetosphere into the morning boundary layer.
to accommodate the increased plasma pressure. This is well illustrated in the simulations of Birn et al. (1999) for sub-storm injections. Observations (2) and (4) show clearly a steady and slow collapse of the plasma sheet. Finally, the fact that all plasma transport is directed earthward, more or less along the meridian plane, raises the question: where does it go to? The answer is to be found in the plasma blobs dis-covered between 9 and 11 RE(see above), which are
system-atically moving towards later morning hours.
Vaivads et al. (2001b) have shown that the so-called plasma blobs or compressional Pc5 waves observed by Equator-S and Geotail (Haerendel et al., 1999; Vaivads et al., 2001a) are the magnetospheric counterpart of Ps6 com-pressional waves which are often associated with -bands or eastward moving auroral structures found during the re-covery phase of substorms (e.g. Buchert et al., 1988). These luminous tongues protruding poleward from a diffuse auro-ral band are sites of upward field-aligned currents with max-imum density of 1–2 µA/m2. Their eastward directed drift speed of typically 0.6 km/s maps into speeds of 18–20 km/s at 11 RE, consistent with the observed drifts of the plasma
blobs. However, not all plasma blobs encountered outside 9 REmust have optical counterparts, i.e. -bands. This may
only apply in the true recovery phase of substorms, whereas during quiet periods, hours after a substorm, the field-aligned currents driven by the magnetospheric structures appear to be too weak to cause aurora (Haerendel et al., 1999).
If, as we suggest, the high-beta structures at 19 RE are
physically related to the high-beta plasma blobs at 9–11 RE,
how do we cope with the absence of an eastward drift at the outer location? There is a natural explanation for the appar-ently conflicting motions. The high-beta structures at 19 RE
are feeding the plasma blobs with fresh plasma out of the de-caying substorm wedge while the eastward flow at 9–11 RE
is removing the plasma towards the morning magnetopause. Here, the plasma may be injected into the boundary layer. Indeed, Haerendel et al. (1999) concluded from comparison
with Geotail data (Nishida et al., 1997) that blobby structures persist out to the magnetopause.
We have several times drawn attention to the behavior of the ϕ-component of the magnetic field in the high-beta events at 19 RE. The same tendency was found inside the plasma
blobs at 9–11 RE (see Haerendel et al., 1999, Fig. 5). It
im-plies that the driving force of the eastward convection is not applied from further outside, but rather from low altitudes. The eastward flow at L≤11 is part of a large-scale, coun-terclockwise convection pattern dominating the polar iono-sphere during substorms. The associated equivalent current system is named DP1. As the substorm subsides, the DP1 system prevails (see Kamide and Baumjohann, 1993, p. 105). It is characterized by a two-cell pattern, but during morning hours in the auroral oval the convection is eastward. All of this is driven by forces exerted on the ionosphere from the tail and night-side magnetosphere via field-aligned currents. The incompressibility of the near-Earth magnetic field en-forces a plasma circulation that may, in certain regions, also drag the magnetospheric plasma with it, rather than being lo-cally driven from above, for instance, by pressure gradients. This is the explanation we would like to offer for the behavior of the azimuthal field component inside the high-beta events. At the Cluster position, the deflated plasma sheet tends to collapse towards the midnight meridian, thus opposing any eastward-directed motion impressed from below.
The overall picture arising from this analysis and from a synopsis with the plasma blob/Pc5 behavior has been de-picted into the cartoon of Fig. 14. The transport of plasma to-wards the morning magnetopause on field lines in the L∼=11 range calls for a re-supply of magnetic flux and plasma which is still amply available in the former substorm current wedge.
This triggers the observed earthward motion near 19 RE,
which happens in pulsations consistent with the compres-sional Ps6 waves and, early in the recovery phase of sub-storms, with -bands further inward. The final whereabouts of the plasma remains terra incognita. Most likely, it mixes with plasma in the morning-side boundary layer where it is carried downstream and eventually released into the solar wind. This conjecture needs, of course, further investigation. If the above chain of arguments is accepted, one is nat-urally forced to abandon the interpretation of the luminous plasma tongues and associated Ps6 pulsations as outward (poleward) protrusions of an existing hot plasma population and to reverse the direction of transport. Any earthward mo-tion at large distances, as found in this reported data set, must not necessarily map into significant equatorward drifts in the ionosphere. The reason is that the high-beta struc-tures may slowly lose their internal energy content by feed-ing a Poyntfeed-ing flux into the ionosphere and thus collapse. The associated inward transport of magnetic flux would ap-pear as rather slow equatorward drift components of the order of 100 m/s or below. The electric field measurements inside
-bands reported by Buchert et al. (1988) show a dominance of a meandering around the tongues in the eastward direction and little systematic poleward or equatorward motion. Care-ful assessments of the overall radial transport direction and
sible. We thank the FGM, CIS, PEACE, RAPID teams on Cluster, the IMAGE FUV team, the IMAGE ground magnetometer network and the ACE team for using their data. The work at MPE in Garch-ing is supported by DLR (Deutsches Zentrum f¨ur Luft und Raum-fahrt) under contracts 50OC0102 and 50OC0104. The work in TU Braunschweig was supported by DLR under contract 50OC0103.
Topical Editor T. Pulkkinen thanks a referee for his help in eva-luating this paper.
References
Akasofu, S.-I. and Kimball, D. S.: The dynamics of aurora, 1. In-stabilities of the aurora, J. Atmos. Terr. Phys., 26, 205, 1964. Baker, D. N., Hones Jr., E. W., Young, D. T., and Birn, J.: The
possi-ble role of ionospheric oxygen in the initiation and development of plasma sheet instabilities, Geophys. Res. Lett., 9, 1337, 1982. Baker, D. N., Fritz, T. A., and Bernhard, P. A.: A small-scale plas-moid formed during the 13 May 1985, AMPTE magnetotail bar-ium release J. Geophys. Res., 94, 17 084–17 096, 1989. Balogh, A., Carr, C. M., Acu˜na, M. H., Dunlop, M. W., Beek, T.
J., Brown, P., Fornacon, H., Georgescu, E., Glassmeier, K.-H., Harris, J., Musmann, G., Oddy, T., and Schwingenschuh, K.: The Cluster magnetic field investigation: overview of in-flight performance and initial results, Ann. Geophys., 19, 1207, 2001. Baumjohann, W.: Spatially inhomogeneous current configurations
as seen by the Scandinavian Magnetometer Array, in: Proceed-ings of the International Workshop on Selected Topics of Mag-netospheric Physics, 34–40, Jpn. IMS Comm., Tokyo, 1979. Baumjohann, W., Sckopke, N., LaBelle, J., Klecker, B., L¨uhr, H.,
and Glassmeier, K. H.: Plasma and field observations of a com-pressional Pc5 wave event, J. Geophys. Res., 92, 12 203–12 212, 1987.
Birn, J., Hesse, M., Haerendel, G., Baumjohann, W., and Shiokawa, K.: Flow braking and the substorm current wedge, J. Geophys. Res., 104, 1999.
Buchert, S., Baumjohann, W., Haerendel, G., La Hoz, C., and L¨uhr, H.: Magnetometer and incoherent scatter observations of an in-tense Ps6 pulsation event, J. Atmos. Terr. Phys., 50, 357–367, 1988.
Buchert, S., Haerendel, G., and Baumjohann, W.: A model for the electric fields and currents during a strong Ps6 pulsation event, J. Geophys. Res., 95, 3733–3743, 1990.
Escoubet, C. P., Russell, C. T., and Schmidt, R.: Cluster – Science and Mission Overview, Space Sci. Rev., 79, (1–2), 11–32, 1997. Haerendel, G.: Disruption, ballooning or auroral avalanche – on the cause of substorms, in: Proceedings of the International Confer-ence on Substorms (ICS-1), Kiruna, 416.420, ESA, 1992. Haerendel, G., Baumjohann, W., Georgescu, E., Nakamura, R.,
Kistler, L. M., Klecker, B., Kucharek, H., Vaivads, A., Mukai,
Opgenoorth, H. J., Oksman, J., Kaila, K. U., Nielsen, E., and Baumjohann, W.: Characteristics of eastward drifting omega bands in the morning sector of the auroral oval, J. Geophys. Res., 88, 9171, 1983.
Pulkkinen, T. I., Pellinen, R. J., Koskinen, H. E. J., Opgenoorth, H. J., Murphree, J. S., Petrov, V., Zaitzev, A., and Friis-Christensen, E.: Auroral signatures of substorm recovery phase: A case study, in: Magnetospheric Substorms, Geophys. Monogr. Ser., 64, edited by Kan, J. R., Potemra, T. A., Kokubun, S., and Takesi, I., AGU, Washington D.C., 333–341, 1991.
R`eme, H., Aoustin, C., Bosqued, J. M., Dandouras, I., Lavraud, B., Sauvaud, J. A., Barthe, A., Bouyssou, J., Camus, Th., Coeur-Joly, O., et al.: First multispacecraft ion measurements in and near the Earth’s magnetosphere with the identical Cluster ion spectrometry (CIS) experiment, Ann. Geophys., 19, 1303, 2001. Rostoker, G. and Samson, J. C.: Can substorm expansive phase ef-fects and low frequency Pc magnetic pulsations be attributed to the same source mechanism?, Geophys. Res. Lett., 11, 271–274, 1984.
Saito, T. and Yumoto, K.: Comparison of the two-snake model with the observed polarization of the substorm-associated magnetic pulsation Ps6, J. Geomagn. Geoelectr., 30, 39–54, 1978. Shay, M. A., Drake, J. F., Denton, R. E., and Biskamp, D.: Structure
of the dissipation region during collisionless magnetic reconnec-tion, J. Geophys. Res., 103, 9165–9176, 1998.
Shiokawa, K., Baumjohann, W., and Haerendel, G.: Braking of high-speed flows in the near-Earth tail, Geophys. Res. Lett., 24, 1179–1182, 1997.
Steen, A., Collis, P. N., Evans, D., Kremser, G., Capelle, S., Rees, D., and Tsurutani, B. T.: Observations of a gradual transition be-tween Ps6 activity with auroral torches and surgelike pulsations during strong geomagnetic disturbances, J. Geophys. Res., 93, 8713, 1988.
Vaivads, A., Baumjohann, W., Haerendel, G., Nakamura, R., Kucharek, H., Klecker, B., Lessard, M. R., Kistler, L. M., Mukai, T., and Nishida, A.: Compressional Pc5 type pulsations in the morningside plasma sheet, Ann. Geophys., 19, 311–320, 2001a. Vaivads, A., Baumjohann, W., Georgescu, E., Haerendel, G., Naka-mura, R., Lessard, M. R., Eglitis, P., Kistler, L. M., and Ergun, R. E.: Correlation studies of compressional Pc5 pulsations in space and Ps6 pulsations on the ground, J. Geophys. Res., 106, 29 797– 29 806, 2001b.
Yamamoto, T., Makita, K., Ozaki, M., and Meng, C.-I.: A particle simulation of auroral omega bands and torch-like structure, J. Geomagn. Geoelectr., 45, 619, 1993.
Yamamoto, T., Inoue, S., and Meng, C.-I.: Formation of auroral omega bands in the paired region 1 and region 2 field-aligned current system, J. Geophys. Res., 102, 2531–2544, 1997.