HAL Id: hal-00111384
https://hal.archives-ouvertes.fr/hal-00111384
Submitted on 27 Jun 2019
HAL is a multi-disciplinary open access
archive for the deposit and dissemination of
sci-entific research documents, whether they are
pub-lished or not. The documents may come from
teaching and research institutions in France or
abroad, or from public or private research centers.
L’archive ouverte pluridisciplinaire HAL, est
destinée au dépôt et à la diffusion de documents
scientifiques de niveau recherche, publiés ou non,
émanant des établissements d’enseignement et de
recherche français ou étrangers, des laboratoires
publics ou privés.
Testing with SHPB from quasi-static to dynamic strain
rates
R. Ohtman, M. N. Bussac, P. Collet, G. Gary
To cite this version:
R. Ohtman, M. N. Bussac, P. Collet, G. Gary.
Testing with SHPB from quasi-static to
dy-namic strain rates. Journal de Physique IV Proceedings, EDP Sciences, 2003, 110, pp.397-404.
�10.1051/jp4:20020726�. �hal-00111384�
Testing with SHPB from quasi-static to dynamic strain rates
R. Othman, M.N. Bussac1, P. Collet1 and G. Gary
Laboratoire de Mecanique des So/ides, UMR 7649, Eco/e Po/ytechnique, 91128 Palaiseau,
France
1
Laboratoire de Physique Theorique, UMR 7644, Eco/e Po/ytechnique, 91128 Palaiseau,
France
Abstract-We have developed a new method for separating dispersive waves in elastic and viscoelastic rods from three-point strain and one-point velocity measurements. Stress, strain, displacement and velocity, which were supposed to be homogenous in a rod section, were therefore determined at any point of the bar. This method is based on the assumption of a one dimensional and single mode dispersive wave propagation. This method was used in the frequency domain and took into account wave dispersion. It was shown to be stable with respect to noise. The measuring time is increased considerably. Subsequently, the maximum strain which can be measured in a material tested with a classical SHPB (Split Hopkinson Pressure Bar) set-up is also increased and is no more limited by the length of the bars.
The method w as u sed to evaluate the r ate s ensitivity o f a luminum honeycomb over a wide r ange of s train-rates (from 10.2 to 1000 s\
1. INTRODUCTION
Any measuring technique involving the use of bars requires knowing the characteristics of the two elementary waves which propagate in opposite directions. Once they have been characterized, they can be time shifted to the appropriate cross-sections (the bar specimen interfaces for example) and all the mechanical values required can be calculated. The SHPB technique involves the use of long bars and a short loading pulse, so that there exists a cross-section where the total incident pulse and the first part of the reflected waves (having the same duration) can be recorded separately. There therefore exists a maximum observation time which depends on the length of the bar. The measuring time available when a classical SHPB set-up is used is thus limited [ 1] to AT < Ll c , where c is the wave speed and L the length
of the input bar. Consequently, when testing material behavior at a given average strain rate, the maximum measurable strain is also limited (emox $ iAT).
To increase the useful measuring time when working with a SHPB, some authors have analyzed the multiple reflections occurring in bars. Campbell and Duby [2] described a method based on a one dimensional elastic wave theory. Lundberg and Henchoz [3] have also proposed a simple explicit formula (based on a one-dimensional wave propagation assumption) separating the two elementary waves to measure the particle velocity, and using the signals recorded at two different cross-sections in a bar. This method has also been applied [4] in a study on the viscoelastic properties of m aterials and [ 5] to t he prediction of the wave propagation in a bar with a non-uniform impedance (due to a temperature gradient, for instance) and has been used successfully in high temperature SHPB testing [6,7,8,9].
However, as several authors have pointed out [2,3], these methods a re valid only if the wave dispersion can be neglected. This condition is satisfied when the bar is thin and the measuring time is short (about I ms in these studies with a bar having a diameter of 10 mm).
Zhao and Gary [10] presented a 2-strain gauge measurement approximate method in which wave dispersion and attenuation are taken into account for use with elastic or viscoelastic bars. With this method, the calculations are carried out in the time domain by means of an iterative formula.
In the present paper, an exact mathematical method for separating ascending and descending waves is recalled. It is based on the use of redundant information with strain and/or velocity measurements. The total number of measuring points can then be greater than 2. The complete description
of the method can be found in [!I] and [12]. This idea was also recently proposed by Hillstrom and co authors in the problem of the experimental determination of the complex modulus of a material [ 13]. By considering only the effect of white noise, one can reconstruct propagating waves using the maximum likelihood method.
2. PROPAGATIONTHEORY
This approach relies on the assumption that the constitutive law governing the bars is linear, so that all the mechanical v ariables can b e described in terms of their harmonic c omponents. T he p ulse propagating along the bar can be expressed in space and time by a Fourier integral involving the initial pulse, the phase velocity and the damping [14]. We will use the Fourier transform defined by (equ. I)
I
loc
g(m) =-
g(t)e-;m'dt
2n
oo (I)A finite bar with length Lis considered in the following (fig. I). It is assumed viscoelastic with a complex Young's modulus
E'(m).
In the elastic case,E'(m)=E, (where
4
is a real number). The strain in the time domain is then written :e(x,t) =
__!.__
2n oo
[ooe(x,m)e;""dm
with:.?(x,m)= A(m)e-•I(
.. )<+ B(m)e•<(m)x
where the complex wave number q(m)is :
(2) (3)
q(m) = k(m )+ ia(m) =_(m ) + ia(m)
(4)
cm
A( m) et
B(m) are the frequency component of basic ascending and descending waves at the origin that we
want to calculate,c(m) is the phase celerity of longitudinal waves and
a( m) the damping coefficient. The
dispersion relationq(m} depends in a coupled way on the material of the bar and on its geometry. For a
circular elastic bar,q(m} is a solution of the Pochhamer and Chree equation [15, 16]. Using (equ. 2) the
frequency components of the stress, the velocity and the displacement respectively are given:O'(x,m) = E'(m) (A(m )e-;;(,)x + B(m )e;;(w)x}
v(x,m) =-m (A(m )e-;;(w)x - B(m )e;<(•)x )/;(m)
u(x,
m)=
i (A(m )e-;<(• )x - B(m
k'("
)x )/ q(m)
3. SEPARATION OF THE WAVES
(5)
(6)
(7)
Formulas 5,6,7 show t hat from t he knowledge of
q(w� E·(m� A(m) et
B(w },
the strain, t he stress, the displacement and the particle velocity are known at any point of the bar. In the following, we assume that;(m) et
E'(w) are known (the question of their determination is studied in [17, 18]). Our purpose is then
simply the calculation ofA(m)
andB(m).
This calculation is based on the knowledge of N strain measurements and P velocity measurements. Assuming that these measurements are the sum of the exactvalue of the strain (velocity) and a white noise, the maximum likelihood method (a generalization of the least square method) is used to find functions
A(m)
and B(m) [ 19]. The complete demonstration is given in [11]:Striker where: A(
m)
B(m)
h2 (m )E1 (m)- g(m )E,(m)
h1 (m )h, (m)- g(m )g(m)
hJm )E, (m)- gral}EJm)
hJm )h,(m )- g(m)g(m)
hJm)= �e-'(<(mJ-rr.vlk +�c�:f te-'(<(mJ-IT"lk
h,(m)= �e'(,;(m)-rr.vJ)x, +�c�:)r t,e'(<(mkTml)x,
g(m)= :i::e'(.:'(m)+rr.;;}�<1
_
,
c(m)
l
'
±e'(,;(m)+,:'(m)jx.
;=I Co k=l N ,--� 1 I'.-£1(m)= l:e''(m)<,iJm)-2 l:e'<(m)<,c(m}V,(m)
J=I C0 b:IE,(m)= fe-'�'i1(m)+� i:e-•<(ml<,c(m}V,(m)
J=I
C0
k=l(8)
where
c(m)
is a simpler notation formj!;(m ); c0
isc(O);
x1 and x, the abscissa of gauges and velocity measurements respectively; z is the complex conjugate of z.When
N=2
(and P=O) formula (8) gives the exact result of the two gauges frequency equation [11]. In such a case, the denominator ofA(
m)
andB(m)
becomes zero for real values of the frequency m,as detailed in [20]. To overcome this difficulty, we use an integration path in the complex domain, as explained in [12].
4. EXPERIMENTAL VALIDATION. THE CASE OF A NYLON BAR 4.1 Description
Bar
Strain gauge I Strain gauge 2 Displacement measurement:..±
Optical extensometers
1
Strain gauge 3
I
Displacement measurement B_ Figure. l. Scheme of the experimental set-up
Ellminado: A
A 3.022-m long Nylon bar 40 mm in diameter was used. Strain gauge stations I, 2 and 3 were 0.404 m, I .508 m and 2.414 m from the impact end of the bar, respectively.
The striker, which was 0.40 m long, was made of the same material and had the same diameter as the bar. The initial speed of the striker was 3.03 m/s. Measurements are recorded with a frequency sampling
J;
=500kHz. The numerical Fourier transform (FFT) is performed with 65536 points. Corresponding basic records are shown in fig. 2.Strain eil.rip,lnu DisplacemeJlt(cm)· Velocity(m/s)
OJlOJr---===,
10 30 time (ms)
Figure 2. Recorded data: strains. displacement at station 4 and corresponding filtered calculated velocity (3kHz).
4.2 Reconstruction of the waves.
The strains are rebuilt using the general formula (8) based on 3 strains and I velocity measurement ( N = 3, P =I). This velocity is calculated by derivation with respect to time of the displacement
measured in x,. Stresses and displacements at bar ends are shown in fig 3.
s,tres_s_(MP:...__:a) ________ •::!m..;p=· �.lnu=, 20 Displacement (llllll) _,...._._ _______
�----r---�-����---·
stress at fuoe end 10
-I
� slress at striker siAJe
10 30 time (ms) 30 time (ms)
Figure 3. Reconstructed stresses at the ends of the bar (left) and displacement at the free end (right), based on experimental data. (The stress at the free end has been shifted down by 0.2 MPa to make the figure more readable)
As expected, the stress at the free end remains equal to zero while the stress at the impacted end is also equal to zero except during the loading time.
The rebuilt displacement at the free end is compared with the directly measured one. The result is almost perfect. The maximum error is lower than 4%. for a measuring time more than 30 times greater than the time needed to the waves for a round trip in the bar.
One could wonder why it is necessary to use 3 strains and one velocity measurement when the use of two strain gages should be theoretically sufficient. The reason, as shown in [12], is that using two gages is very sensitive to the noise and that a slightly imprecise measurement of the null strain produces a drift of
the a verage s peed. I t would b e t oo long do d etail t his p oint h ere. It probably e xplains why very f ew material testing applications with bars at medium strain rates are found in litterature.
5. APPLICATION TO SPECIMEN TESTING EXPERIMENT
Using two bars and a specimen between them, the same technique allows for the measurement of force and displacement at both specimen sides. Assuming then (and checking) the equilibrium of the specimen, stress, strain and strain-rate in the specimen can be calculated (like for the SHPB apparatus).
5.1 Experimental set-up
The experimental set-up is made of a 3.022-m input bar and a 3.01-m output bar. Both are made of Nylon and have a diameter of 40 mm. The loading is done with a hydraulic oil jack on one side (say the left input bar end) while the second bar (say output bar) is fixed at its right end. The speed of the hydraulic actuator is monitored as desired. Three strain gauges are cemented on each bar. Additionnally, two optical extensometers are used for displacement measurements. These displacements are then numerically derived to obtain velocities at corresponding positions.
5.2 Experimental results.
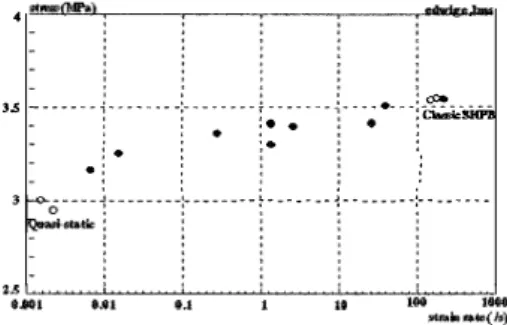
A large range of loading speeds has been investigated with this set-up, including quasi-static speeds. On the low speed side, results are compared with a quasi static test (hollow circles left fig. 4). On
the high speed side, they are compared with SHPB test results (hollow circles right fig.4).
It confirms results found in [21] where no data were available between the quasi-static and the dynamic range and where no strain-rate effect was found in the dynamic range. These tests prove that the transition zone is indeed in the range of medium strain rates.
4 stM:SiMPa) ,.)., 35 ---
r
--- - - -(
---�=
---:----·---
:
::�sHPB
:
.
:
• j
[
'
' '·�:·
!
+···+ + ····2!.eo""•:--�-:-0_.�,,...��.='-.,,...�...l:---...J,-:-0
---:.
,
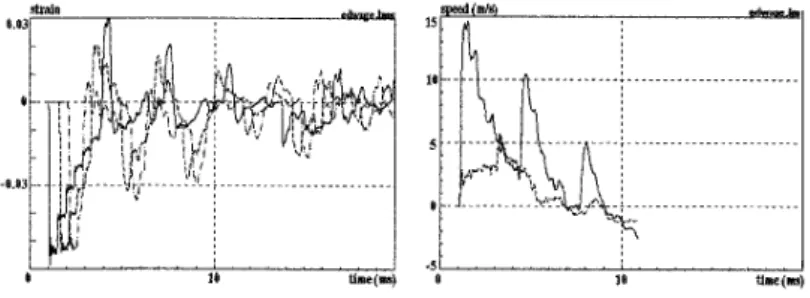
.. t:----.-.ltii'Oe strain•te(/rs) Figure 4. Stress at 10% strain as a function of strain-rate at 1 O%strainIn order to illustrate the method, for the test at 1 00/s, the recorded waves on the input bar are show in fig 5 (waves in the output bar are not shown as they are not more clearly understandable). The local velocities derived from the optical measurement are shown in fig 6
The processing of this signal provides forces and displacements at both ends of the specimen. The equilibrium, that has to be checked, is shown in fig 7. It is then meaningful to build a stress-strain relation that is shown in fig 8. Note that the notion of strain is not so clear for the material tested but this point is out of the scope of the present subject.
·','---.,l":-9---,tlc-oe-(._JMS)
Figure 5. Recorded (3) waves, input bar Figure 6. Input and output (dashed) speeds
Figure 7. Input and Output force Figure 8. Stress and strain rate (dashed)/ strain
The test presented above is done at a relative high strain-rate. For the tests done at low strain rates, it is interesting to compare the results of our method with a simple processing based on the assumptions that the strain and stress states are homogenous along each bar.
The results are shown in fig 9 .
...,.(MP•) ... ""' 3
��
4 •.SJr
-..r �/f-11
:Figure. 9. Quasi-static (dashed) and dynamic processing for Honeycomb
---·
SU...MPa)
0.1 oJ 1.3
Figure. 10. Quasi-static (dashed) and dynamic processing for lead
An almost identical result is observed for a strain greater than 15%. On the contrary, a difference is observed at low strain, corresponding to the early time of the test. This result is very interesting: the difference is indeed due to an incorrect quasi-static processing in this zone. The peak of force corresponds
to the first buckling that occurs in the honeycomb specimen. The Nylon bars are not rigid enough t o prevent a dynamic unloading which can not be correctly described with a quasi-static processing. This analysis is confirmed in fig. I 0 showing the compression test of a lead specimen at a similar strain rate. As no unloading occurs, the quasi-static assumption is now correct for the bars.
6. CONCLUSION
Using the results of a recent paper [12], a multi-point method (multi-strain and/or multi-velocity measurements) is presented for reconstructing one dimensional waves in bars. This method is exact when used with the single-mode dispersive propagation model commonly applied to Hopkinson bars. It provides a significant increase in the observation time available when using measuring techniques based on the use of bars such as SHPB set-ups. The methods makes it possible to obtain precise measurements at medium strain rates in a test range in between that of mechanical testing machines and that of Hopkinson bars. Using a hydraulic actuator for the loading of the bars, It is illustrated here by testing aluminium Honeycomb at an average strain rate from 0.006 to I 00 s·1 with no limitation in the maximum strain ( up to 22% ).
7. REFERENCES
1. Kolsky H. (1953), Stress Waves in Solids, Clarendon Press, Oxford ( 1953)
2. Campbell, J.D. and Duby, J. (1956), The yield behaviour of mild steel in dynamic compression. Proc. R. Soc. Lond., A 236, 24-40
3. Lundberg, B. and Henchoz, A. (1977) Analysis of elastic waves from two-point strain measurement. Exper. Mech. 17, 213-218.
4. Lundberg, B. and Blanc, R. H. (1988) Determination of mechanical material properties from the two point response of an impacted linearly viscoelastic rod specimen, J. Sound and Vibration, 126, 97-108
5. Lundberg, B., Carlsson J. and Sundin K. G. (1990) Analysis of elastic waves in non-uniform rods from two-point strain measurement. J. Sound and Vibration. 137,483-493.
6. Bacon, C. Carlsson, J . a nd L ataillade J .L. ( 1991) E valuation o f f orce a nd p article velocity at t he heated end of rod subjected to impact loading. J. Phys. IV France 1 Colloq. C3, 395-402.
7. Bacon, C. Farm, J. and Lataillade, J.L. (1994) Dynamic fracture toughness determined from load point displacement. Exper. Mech., 34(9), 217-223.
8. Bacon C. & Brun A. (2000) "Methodology for a Hopkinson bar test with a non-uniform viscoelastic bar, Int. J. Impact Engng, 24 219-230
9. Lataillade, J.L., Bacon, C., Collombet, F. and Delaet, M. (1994) The benefit of Hopkinson bar techniques for the investigation of composite and ceramic materials. Wave Propagation and Emerging Technologies. ( Eds. W.K.Kinra, R.J. Clifton and G.C. Johnson). AMD-Vol. 188. 85-93, pub!. ASME, New York.
I 0. Zhao, H and Gary, G. (1997) A new method for the separation of waves. Application to the SHPB technique for an unlimited measuring duration. J.Mech.Phys.Solids. 45, 1185-1202.
11. Bussac M.N., Collet P., Gary G., Othman R., (200 l )An optimisation method for separating and rebuilding one-dimensional dispersive waves from multi-point measurements. Application to elastic or viscoelastic bars, J. Mech. Phys. Solids, Vol 50, No 2, pp321-350, 2002.
12. Othman R., Bussac M.N., Collet P., Gary G. (2001), Separation et reconstruction des ondes dans les barres elastiques et viscoelastiques a partir de mesures Redondantes, , Compte Rendus de l'Academie des Sciences, t. 329, Serie lib, p. 369-376, 2001
13. Hillstriim, L., Mossberg,M; and Lundberg, B. (2000) Identification of complex modulus from measured strains on an axially impacted bar using least squares. Journal of Sound and Vibration, 230(3), 689-707
14. Hunter, S. C. (1960) Viscoelastic waves, Progress in Solid Mechanics, 1, Sneddon I.N. and Hill R. eds, North Holland, Amsterdam, 1-57
15. Pochhammer, L. (1876) Uber die Fortpflanzungsgeschwindigkeiten k1einer Schwingungen in einem unbergrenzten isotropen Kreiszylinder. J. reine angew. Math., 81, 324-336.
16. Chree, C. (1889) The equations of an isotropic elastic solid in polar and cylindrical co-ords, their solutions and applications. Cambridge Phi\. Soc. Trans., 14, 250-369.
17. Othman R., Blanc R.H., Bussac M.N., Collet P., Gary G., identification de la relation de dispersion dans les barres, accpeted for publication in, Compte Rendus de I 'Academie des Sciences, 2002
18. Othman R., Blanc R.H., Bussac M.N., Collet P., Gary G., A spectral method for wave dispersion analysis Application to an aluminium rod, Proc. 4th Int. Symp. on Impact Engng, Kumamoto,
(j
uly 2001), Impact Engineering and Application, Elsevier, pp 71-76, A. Chiba, S. Tanimura, K. Hokamoto editors, 200119. Van Trees, H. L. (1992) Detection, estimation and modulation theory; Vol. I New York, John Wiley, 1968 and Vol. Ill Malabar, Krieger, 1992.
20. Bacon, C. (1999) Separating waves propagating in an elastic or viscoelastic Hopkinson pressure bar with three-dimensional effects. Int. J. Impact Engng., 22, 55-69.
21 Zhao H. and Gary G., Crushing behaviour of Aluminium Honeycombs under impact loading, Int. J. Impact Engng. 21-10 (1998), 827-836.