HAL Id: hal-03104246
https://hal-ensta-bretagne.archives-ouvertes.fr/hal-03104246
Submitted on 8 Jan 2021
HAL is a multi-disciplinary open access
archive for the deposit and dissemination of
sci-entific research documents, whether they are
pub-lished or not. The documents may come from
teaching and research institutions in France or
abroad, or from public or private research centers.
L’archive ouverte pluridisciplinaire HAL, est
destinée au dépôt et à la diffusion de documents
scientifiques de niveau recherche, publiés ou non,
émanant des établissements d’enseignement et de
recherche français ou étrangers, des laboratoires
publics ou privés.
Multi-modal deep learning models for ocean wind speed
estimation
Clémentin Boittiaux, Paul Nguyen Hong Duc, Nicolas Longépé, Sara Pensieri,
Roberto Bozzano, Dorian Cazau
To cite this version:
Clémentin Boittiaux, Paul Nguyen Hong Duc, Nicolas Longépé, Sara Pensieri, Roberto Bozzano, et
al.. Multi-modal deep learning models for ocean wind speed estimation. 2020 MACLEAN: MAChine
Learning for EArth ObservatioN Workshop, MACLEAN 2020, Sep 2020, Virtual online, France.
�hal-03104246�
estimation
Cl´ementin Boittiaux1, Paul Nguyen Hong Duc2, Nicolas Long´ep´e3, Sara Pensieri4, Roberto Bozzano4,
and Dorian Cazau1
1 Lab-Sticc, ENSTA Bretagne, Brest, France. 2
Institut d’Alembert, Sorbonne Universit´e, Paris, France
3 Space Observation Division, Space and Ground Segment BU, CLS, Plouzan´e, France 4
National Research Council of Italy, Genoa, Italy
Abstract. Because it depends on multiple atmospheric and oceanographic variables interacting with each other at the sea surface, accurately forecasting offshore surface wind speed is challenging for oceanographers. However, with the expansion of today’s Big Ocean Data, the same offshore site can now be monitored by multiple sensors such as hydrophones, satellites or weather buoys. These data are highly heterogeneous, but each of them can potentially bring complementary information on an ocean process. In this paper, a deep generative model is designed to jointly represent Underwater Passive Acoustics (UPA) and Synthetic Aperture Radar (SAR) images into the same latent space to describe surface wind speed located in the Ligurian Sea (North Western Mediterranean Sea). Qualitative and quantitative results obtained demonstrate that SAR images are able to refine the estimation of UPA for low wind speeds.
Keywords: multi-modal deep learning · embedding space · marine meteorology
1
Introduction
1.1 Context
Winds over the ocean help transfer heat, moisture, gases and particulates into and out of the ocean. Modulation of these transfers regulate the interaction between the atmosphere and the ocean, which establishes and maintains both global and regional climates. In definitive, wind is the largest source of momentum for the ocean surface, impacting individual surface waves and complete current systems. Thus, knowledge of the wind characteristics over the vast space of oceans is important to weather forecasting, ocean navigation, and climate study.
Wind measurements are primarily obtained in-situ from anemometers located at small island weather stations, on ships, and on buoys floating in the ocean. Complementarily, remote sensing has also been widely used (see e.g. [2]). One of active microwave radar instruments is Synthetic Aperture Radar (SAR). SAR ocean surface wind retrieval has been originally based on a single observed quan-tity; the co-polarized Normalized Radar Cross Section (NRCS). This variable represents the normalized amount of electromagnetic waves backscattered by the sea surface roughness. At first order, it depends on the incidence angle of the electromagnetic (EM) waves, the wind speed and relative direction with respect to the emitting EM waves. This relation can be modelled by tranfer function called the Geo-physical Model Function (GMF) or CMOD (C-band MODel) when applied to C-band scatterometer (e.g. CMOD 4 [17], CMOD5n [7]). The traditional inversion scheme is derived from the scatterometry community [15]. The RMSE of the wind speed generated by C-band SAR image is in the order of 1.5 m/s. The NRCS can be significantly polluted by non-wind related features, especially for low wind situation where oceanic signatures may appear (oceanic front, biological slicks, ...).
Much more marginally, Underwater Passive Acoustics (UPA) has also been used to estimate wind speed above ocean surface. The so-called acoustic meteorology discipline has been an active research field since the pioneering work of Nystuen et al. [12], which consists in analyzing ocean ambient noise
2 C. Boittiaux et al.
to infer above-surface meteorological conditions such as wind speed and/or rainfall precipitation. It has been performed both with fixed hydrophones [9,13], and more recently with mobile acoustic platforms such as ARGO profilers [18], gliders [5,4] and free-ranging biologged marine mammals [6].
1.2 Motivations and objectives
Our current study aims to develop original deep learning-based frameworks for wind speed estima-tion following a multi-modal approach. Such an approach consists in fusing different data modalities (coming a fortiori from different sensor types) at an early stage level during the estimation process, which distinguishes it from cross-validation procedures (e.g. between in-situ sensor and remote sens-ing estimations) that are widely used in oceanography. From a more signal processsens-ing point of view, though the information present in a specific sensor compared to another has completely different sta-tistical properties altogether, the spatio-temporal co-occurrence of their observation should guarantee the existence of an intrinsic relation and common underlying factors between them. For a long time now, a whole branch of machine learning has developed models to better capture such relations that span multiple data modalities (including the recent multimodal deep learning branch [11,1]). Such multi-modal learning representations are investigated with the goal of generating more performing and generalisable representations than uni-modal ones for downstream tasks, where it is now recognized that better decomposed representations [10] are more amenable for use on a wider variety of tasks.
In this paper, we propose to learn a joint representation using the MMVAE model by Shi et al. [16] between two different data modalities, namely UPA time series and SAR images, which will be applied to ocean wind speed estimation in open ocean. A successful learning representation on this task will be measured by improving classification performance through the multi-modal representation w.r.t. uni-modal representations.
2
Material & Method
2.1 Material
Study area Our study area has been centred around the W1-M3A monitoring platform [3], held by the National Research Council of Italy5. It is located in the Ligurian Sea off the coast of Genoa (43◦83’N 9◦11’E).The climatic and geophysical characteristics common to the region are described in further detail by [14].
UPA data UPA data were collected from a Passive Acoustic Listener (PAL) attached to the W1-M3A platform at a depth of 36 m. Each data block consists of 4.5 seconds long time series of ambient noise sampled at 100 kHz. PAL subsampled each record eight times in order to create sequences of 1024 points corresponding to 10.24 ms that are Fast Fourier transformed to generate 512-point spectra compressed to 64 frequency bins with a resolution of 200 Hz from 100 to 3000 Hz and of 1 kHz from 3 to 50 kHz.
SAR images NRCS SAR images have been acquired by Sentinel-1A/B satellites. For the sake of this study, the averaged effect of the incidence angle is compensated for (hereafter called “detrend NRCS”). Even tough the relative wind direction can impact the radar roughness, this variable is omitted for this proof of concept. Detrend NRCS images are calculated over a grid of 100 by 100 km centered on the W1-M3A station, with a spatial resolution of 1 km/pixel. They span over 5 years from 2015 to 2020. As we are interested in local wind speed estimation (i.e. km scale), we further split our images in five 4 × 4 pixels sub-images around the W1-M3A station, which also allowed us to get more SAR samples. In total, n = 1, 291 SAR images were retrieved.
Wind speed Wind speed data used as ground-truth in our study were retrieved from the ERA-Interim data set of the European Center for Medium-Range Weather Forecasting (ECMWF), based on the global atmosphere model reanalysis developed at the ECMWF. All wind measurements were converted on the Beaufort scale. This scale is an empirical measure that relates wind speed to observed conditions at sea or on land6.
Dataset distribution On Fig. 1, the distribution of UPA and SAR samples over the Beaufort scale is shown. The unbalanced between Beaufort classes for both modalities will be compensated during evaluation using well-known stratified cross-validation procedures and balanced accuracy.
(a) SAR (b) UPA
Fig. 1: SAR and UPA data Beaufort scale distribution
2.2 MMVAE architecture
Fig. 2: MMVAE diagram
The MMVAE model proposed by Shi et al. [16] was implemented to learn the joint representation of UPA and SAR modalities. Each modality is fed into a specific VAE [8] and then combined. Therefore, the obtained multi-modal latent space is built by linear combination of uni-modal latent spaces [16]. This learning process is described in Fig. 2. Each modality is projected into a joint latent space before being decoded by every modality’s decoder. This architecture generates a latent space robust to missing or deteriorated modalities, since uni-modal projections share the same networks to decode their features.
4 C. Boittiaux et al.
This model was re-implemented in Tensorflow 2.0 based on the original pytorch code7. We trained
the model for 500 epochs with a batch size of 64 using Adams optimizer.
3
Numerical experiments and discussion
3.1 Embedding visualization
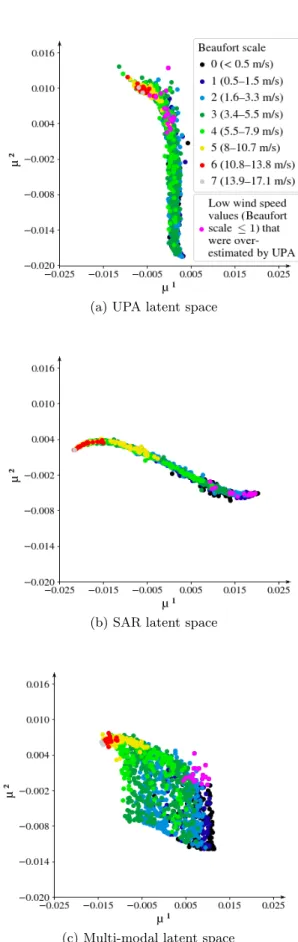
An MMVAE was trained with random pairs of SAR and UPA over the same Beaufort scale. For visualization purposes, we tuned the model to fit a 2-dimensional latent space. Fig. 3 shows the obtained results from the multi-modal training. On Fig. 3, uni-modal and multi-modal latent spaces were plotted. We observed that the multi-modal representation was more distended than uni-modal ones, with a less dense but still continuous latent space, making it more visually interpretable with class clusters more distinguishable.
3.2 Wind speed classification
We performed a classification task on multi-modal and both uni-modal latent spaces to predict wind speed on the Beaufort scale. We computed multi-class classification performance from each latent space using an SVM with an RBF kernel following a two-fold cross-validation. The multi-modal model obtained the best performance with an overall balanced accuracy of 52.0% (±1.0), outperforming both uni-modal model performance, by about 14% for UPA (38.1% ± 1.1) and by 10% for SAR (38.1% ± 1.1). Our multi-modal representation was thus able to find complementary features between UPA and SAR modalities as illustrated by the distension of the multi-modal latent space represented on Fig. 3.
3.3 Cross-modality transfer knowledge
To illustrate cross-modality transfer knowledge between the UPA and SAR modalities in finer details, we took a closer look at low wind speed values (Beaufort class ≤ 1) that were misclassified using the UPA-only representation. Indeed, it is known that UPA-based meteorological systems tend to over-estimate low wind speed occurrences as during these periods wind speed noise-generated is no longer the predominant source in the ocean, and other sources such as breaking waves or passing boats can then easily fool UPA estimations [6].
These misclassified samples have been drawn as pink dots in the different latent spaces of Fig. 3. It is quite clear to observe graphically that the regions of pink dots are much closer to their true “location” in the SAR’s latent space than in the UPA’s one. And the interesting part of this result is that this knowledge from the SAR modality, which allows to correct a UPA bias on low wind speed, has been directly transferred to the UPA modality when embedded in the multi-modal representation. To illustrate this more quantitatively, we computed confusion matrices for each modality separately and for the multi-modal model (Fig. 4). For example, when looking at the true Beaufort class 0, we can see that UPA alone misclassified a significant proportion of samples, with more than 65 % of them predicted in a class superior or equal to 2, while this proportion decreased to 43 % for SAR alone and to 41 % for UPA+SAR. This provides experimental evidence that our multi-modal model is able to leverage complementarity between the modalities to overcome individual weaknesses, here in the case of low-wind speed events where UPA-based estimation of wind speed may easily be corrupted by other acoustic sources.
4
Conclusion and perspectives
To conclude, we are paving the way to unlock the potential of multi-modal wind speed classification, which could offer unique opportunities to improve our knowledge of wind speed based on heterogeneous
(a) UPA latent space
(b) SAR latent space
(c) Multi-modal latent space
Fig. 3: Multi-modal and uni-modal latent spaces visualization
(a) UPA
(b) SAR
(c) UPA + SAR
Fig. 4: Multi-modal and uni-modal confusion ma-trices (prediction percentage per true Beaufort scale)
6 C. Boittiaux et al.
measures. Our results showed that wind speed at an offshore site could be better estimated by using both UPA and SAR images as inputs of a multi-modal neural network. Moreover, we demonstrated that these two modalities are complementary. They both learn different but useful representations that capture underlying aspects of wind speed. Because we essentially focused our work on the multi-modal joint representation, we did not optimize our uni-modal architectures, and preferred to use dense layers over RNNs and CNNs. Future work may be the development of better uni-modal models that can better integrate and exploit the richness of our different modalities.
References
1. Baltrusaitis, T., Ahuja, C., Morency, L.P.: Multimodal machine learning: A survey and taxonomy. arXiv (2017)
2. Bourassa, M.A., Meissner, T., Cerovecki, I., Chang, P.S., Dong, X., De Chiara, G., Donlon, C., Dukhovskoy, D.S., Elya, J., Fore, A., Fewings, M.R., Foster, R.C., Gille, S.T., Haus, B.K., Hristova-Veleva, S., Holbach, H.M., Jelenak, Z., Knaff, J.A., Kranz, S.A., Manaster, A., Mazloff, M., Mears, C., Mouche, A., Portabella, M., Reul, N., Ricciardulli, L., Rodriguez, E., Sampson, C., Solis, D., Stoffelen, A., Stukel, M.R., Stiles, B., Weissman, D., Wentz, F.: Remotely sensed winds and wind stresses for marine forecasting and ocean modeling. Frontiers in Marine Science 6, 443 (2019). https://doi.org/10.3389/fmars.2019.00443, https: //www.frontiersin.org/article/10.3389/fmars.2019.00443
3. Canepa, E., Pensieri, S., Bozzano, R., Faimali, M., Traverso, P., Cavaleri, L.: The odas italia 1 buoy: More than forty years of activity in the ligurian sea. Progress in Oceanography pp. 135, 48–63 (2015)
4. Cauchy, P., Heywood, K., Merchant, N., Queste, B., Testor, P.: Wind speed measured from un-derwater gliders using passive acoustics. Journal of Atmospheric and Oceanic Technology (08 2018). https://doi.org/10.1175/JTECH-D-17-0209.1
5. Cazau, D., Bonnel, J., Baumgartner, M.: Wind speed estimation using acoustic underwater glider in a near-shore marine environment. IEEE Transactions on Geoscience and Remote Sensing 57(4), 2097–2106 (2019)
6. Cazau, D., Bonnel, J., Baumgartner, M.: Wind speed estimation using acoustic underwater glider in a near-shore marine environment. IEEE Transactions on Geoscience and Remote Sensing 57(4), 2097–2106 (April 2019). https://doi.org/10.1109/TGRS.2018.2871422
7. Hersbach, H.: Cmod5.n: A c-band geophysical model function for equivalent neutral wind. (April 2008) 8. Kingma, D.P., Welling, M.: Auto-encoding variational bayes. arXiv:1312.6114 (2014)
9. Ma, B.B., Nystuen, J.A.: Passive acoustic detection and measurement of rainfall at sea. J. of Atmospheric and Oceanic Technology 22, 1225–1248 (2005)
10. Mathieu, E., Rainforth, T., Siddharth, N., Teh, Y.W.: Disentangling disentanglement in variational au-toencoders. arXiv:1812.02833 (2018)
11. Ngiam, J., Khosla, A., Kim, M., Nam, J., Lee, H., Ng, A.: Multimodal deep learning. In: Proc. 28th Int. Conf.Mach. Learn., pp. 689–696 (2011)
12. Nystuen, J.: Rainfall measurements using underwater ambient noise. Journal of The Acoustical Society of America - J ACOUST SOC AMER 79, 972–982 (04 1986). https://doi.org/10.1121/1.393695
13. Nystuen, J., Anagnostou, M., Anagnostou, E., Papadopoulos, A.: Monitoring greek seas using pas-sive underwater acoustics. Journal of Atmospheric and Oceanic Technology 32, 334–349 (02 2015). https://doi.org/10.1175/JTECH-D-13-00264.1
14. Pensieri, S., Bozzano, R., Nystuen, J.A., Anagnostou, E.N., Anagnostou, M.N., Bechini, R.: Underwa-ter acoustic measurements to estimate wind and rainfall in the mediUnderwa-terranean sea. Hindawi Publishing Corporation, Advances in Meteorology pp. 1–18 (2015)
15. Portabella, M., Stoffelen, A., Johannessen, J.A.: Toward an optimal inversion method for synthetic aperture radar wind retrieval. Journal of Geophysical Research: Oceans 107(C8), 1–1–1–13 (2002). https://doi.org/10.1029/2001JC000925, http://dx.doi.org/10.1029/2001JC000925
16. Shi, Y., Siddharth, N., Paige, B., Torr, P.H.: Variational mixture-of-experts autoencoders for multi-modal deep generative models. 33rd Conference on Neural Information Processing Systems (NeurIPS 2019), Van-couver, Canada (2019)
17. Stoffelen, A., Anderson, D.: Scatterometer data interpretation: Estimation and validation of the transfer function CMOD4. Journal of Geophysical Research: Oceans 102, 5767–5780 (Mar 1997). https://doi.org/10.1029/96JC02860
18. Yang, J., Riser, S., Nystuen, J., Asher, W., Jessup, A.: Regional rainfall measurements using the passive aquatic listener during the spurs field campaign. Oceanography 28 (March 2015)