HAL Id: pastel-00591130
https://pastel.archives-ouvertes.fr/pastel-00591130
Submitted on 6 May 2011HAL is a multi-disciplinary open access archive for the deposit and dissemination of sci-entific research documents, whether they are pub-lished or not. The documents may come from teaching and research institutions in France or abroad, or from public or private research centers.
L’archive ouverte pluridisciplinaire HAL, est destinée au dépôt et à la diffusion de documents scientifiques de niveau recherche, publiés ou non, émanant des établissements d’enseignement et de recherche français ou étrangers, des laboratoires publics ou privés.
Biomechanics of sprint running : a methodological
contribution
Elena Bergamini
To cite this version:
Elena Bergamini. Biomechanics of sprint running : a methodological contribution. Biomechanics [physics.med-ph]. Arts et Métiers ParisTech, 2011. English. �NNT : 2011ENAM0013�. �pastel-00591130�
Co-tutoring PhD program in Bioengineering
XXIII Cycle – ING-INF/06
Administrative Universities: Università degli Studi di Bologna
(Bologna) – Arts et Métiers ParisTech (Paris)
Associate University: Università degli Studi di Roma “Foro Italico”, ex
Istituto Universitario di Scienze Motorie (Roma)
Biomechanics of sprint running:
a methodological contribution
Elena Bergamini
Supevisors:
Prof. Aurelio Cappozzo
Università degli Studi di Roma “Foro Italico”
Prof. Wafa Skalli
Arts et Métiers ParisTech
Dr. Valentina Camomilla
Università degli Studi di Roma “Foro Italico”
Dr. Hélène Pillet
Arts et Métiers ParisTech
Coordinator: Prof. Angelo Cappello
Università degli Studi di Bologna
Co-examiner: Prof. Luca Cristofolini
CONTENTS
PREFACE... ix
ABSTRACT ... xi
ENGLISH VERSION...xi
ITALIAN VERSION... xii
FRENCH VERSION...xiii
EXTENDED SUMMARY... xv
CHAPTER 1 – THEORETICAL BACKGROUND ... - 1 -
ABSTRACT... - 2 -
1.1 INTRODUCTION ... - 4 -
1.2 SPRINT RUNNING BIOMECHANICS: PERFORMANCE AND INJURY-RELATED VARIABLES ... - 6 -
1.2.1 Block start phase... - 7 -
1.2.2 Acceleration or pick-up phase ...- 14 -
1.2.3 Maintenance phase ...- 18 -
1.2.4 Deceleration phase...- 26 -
1.3 METHODS FOR SPRINT RUNNING ANALYSIS ...- 27 -
1.3.1 Electromyography ...- 28 -
1.3.2 Motion analysis (Stereophotogrammetry)...- 30 -
1.3.3 Force plates...- 31 -
1.3.4 Pressure sensors ...- 31 -
1.3.5 Accelerometers ...- 32 -
1.3.6 Gyroscopes...- 34 -
1.3.7 Electrogoniometers...- 35 -
-CHAPTER 2 - AIM OF THE THESIS ... - 37 -
CHAPTER 3 - LOW RESOLUTION APPROACH ... - 39 -
ABSTRACT...- 41 -
3.1 INTRODUCTION ...- 42 -
3.1.1 Sports biomechanics and in-field performance evaluation...- 42 -
3.1.2 Wearable inertial sensors ...- 45 -
3.2 STUDY 1: TRUNK INCLINATION DURING THE SPRINT START USING AN INERTIAL MEASUREMENT UNIT ...- 49 -
Abstract ...- 49 -
3.2.1 Introduction...- 50 -
3.2.2 Materials and methods ...- 52 -
3.2.3 Results...- 58 -
3.2.4 Discussion ...- 60 -
3.3 STUDY 2: INSTANTANEOUS VELOCITY AND CENTER OF MASS DISPLACEMENT OF IN-LAB SPRINT RUNNING USING AN INERTIAL MEASUREMENT UNIT...- 62 -
Abstract ...- 62 -
3.3.1 Introduction...- 63 -
3.3.2 Materials and methods ...- 64 -
3.3.3 Results...- 65 -
3.3.4 Discussion ...- 66 -
3.4 STUDY 3: TEMPORAL PARAMETERS OF IN-FIELD SPRINT RUNNING USING AN INERTIAL MEASUREMENT UNIT ...- 68 -
Abstract ...- 68 -
3.4.1 Introduction...- 69 -
3.4.2 Materials and methods ...- 71 -
3.4.3 Results...- 74 -
3.4.4 Discussion ...- 80 -
3.5 LOW RESOLUTION APPROACH: DISCUSSION... 83
-CHAPTER 4 - HIGH RESOLUTION APPROACH...- 85 -
4.1 INTRODUCTION ...- 88 -
4.1.1 Sport biomechanics and injury prevention ...- 88 -
4.1.2 Joint dynamics estimation...- 92 -
4.2 STUDY 4: TIBIO-FEMORAL JOINT CONSTRAINTS FOR BONE POSE ESTIMATION DURING MOVEMENT USING MULTI-BODY OPTIMIZATION- 94 - Abstract ...- 94 -
4.2.1 Introduction...- 95 -
4.2.2 Materials and methods ...- 97 -
4.2.3 Results... - 101 -
4.2.4 Discussion ... - 104 -
4.3 HIGH RESOLUTION APPROACH: DISCUSSION ... - 107 -
CHAPTER 5 - CONCLUSIONS ... - 109 -
AKNOWLEDGEMENTS ... - 113 -
PREFACE
Sports biomechanics uses the scientific methods of mechanics to study the internal and external forces acting on a human body and the effects produced by these forces in sports activities. It is, therefore, concerned, with the ways in which sports movements are performed, often referred to as sports techniques.
With this respect, sports biomechanics has an applicative nature and it has an ultimate objective: the achievement of an effective technique. Indeed, while it is often believed that the main goal of sports biomechanists and coaches is to obtain the best athlete’s performance, it must be kept in mind that performance enhancement and injury risk are strictly related. If improving the athlete’s performance would entail increasing the risk of injury, no actual effective improvement would be obtained. This is the reason why sports biomechanics is often described as having two aims that may be perceived as incompatible: the reduction of the risk of injury (such as identification of the causes of back injuries in cricket, or the causes of knee joint injuries in sprint running) and the improvement of performance (such as optimising gymnastics performance through simulation of in-flight movements, or studying the effects of tennis racquet stiffness on the performance of young athletes).
Although sports biomechanists and coaches, as well as athletes and physicians, share exactly the same objectives, there is still a gap between researchers and practitioners. Coaches commonly base their evaluation of athletes’ performance and of the efficacy of their training program on competition results, field tests and qualitative visual inspection. Such evaluations are often readable, easy to use and they provide information about the global performance. Nevertheless, they are often not able to establish an understanding of causal mechanisms for the selected movements (such as the role of internal rotation of the upper arm in hitting or striking, or the influence of elastic energy and muscle pre-stretch in stretch-shorten-cycle actions). On the other hand, biomechanists, accused to be over-concerned with methodology, often lack of pragmatism.
In order to bridge the gap between the two worlds, the establishment of a common and understandable language is crucial. The importance of quantitative assessment of athletes’ motor skills needs to be well perceived by coaches, as well as by athletes and sports physicians. At the same time, biomechanists must be able to fully understand the actual needs of practitioners and find the appropriate way to communicate and propose their results.
There are two main limitations that have to be overcome in order to achieve these goals: first, the difficulties in performing in-field athlete evaluation and in obtaining data in a natural setting such as competition, without influencing or constraining athletes’ activities. To date, in fact, sports biomechanical analysis is typically performed by means of stereophotogrammetry, force platforms, high-speed cameras, or optical contact time meters. Such solutions, however, are expensive, characterized by a cumbersome and time-consuming experimental set up and tend to constrain the subject and the analysed motor task. Second, there is a lack of methods specifically designed for sports applications, even when dealing with marker-based motion analysis. Protocols commonly developed for clinical biomechanical assessment, in fact, could hardly be transposed to the analysis of sports motor acts, which are characterized by higher accelerations and explosiveness with respect to the former.
In this framework, the present thesis aims at providing a contribution in these directions, focusing on the development of methodologies which could help in overcoming the above mentioned limitations, filling the gap between researchers and practitioners.
ABSTRACT
ENGLISH VERSION
Sports biomechanics describes human movement from a performance enhancement and an injury reduction perspective. In this respect, the purpose of sports scientists is to support coaches and physicians with reliable information about athletes’ technique. The lack of methods allowing for in-field athlete evaluation as well as for accurate joint force estimates represents, to date, the main limitation to this purpose. The investigations illustrated in the present thesis aimed at providing a contribution towards the development of the above mentioned methods.
Two complementary approaches were adopted: a Low Resolution Approach – related to performance assessment – where the use of wearable inertial measurement units is exploited during different phases of sprint running, and a High Resolution Approach – related to joint kinetics estimate for injury prevention – where subject-specific, non-rigid constraints for knee joint kinematic modelling used in multi-body optimization techniques are defined.
Results obtained using the Low Resolution Approach indicated that, due to their portability and inexpensiveness, inertial measurement systems are a valid alternative to laboratory-based instrumentation for in-field performance evaluation of sprint running. Using acceleration and angular velocity data, the following quantities were estimated: trunk inclination and angular velocity, instantaneous horizontal velocity and displacement of a point approximating the centre of mass, and stride and support phase durations.
As concerns the High Resolution Approach, results indicated that the length of the anterior cruciate and lateral collateral ligaments decreased, while that of the deep bundle of the medial collateral ligament increased significantly during flexion. Variations of the posterior cruciate and the superficial bundle of the medial collateral ligament lengths were concealed by the experimental indeterminacy. A mathematical model was provided that allowed the estimate of subject-specific ligament lengths as a function of knee flexion and that can be integrated in a multi-body optimization procedure.
ITALIAN VERSION
La biomeccanica dello sport descrive il movimento umano con l’obiettivo di migliorare la prestazione atletica e di ridurre l’incidenza di infortuni. In questo contesto, lo scopo degli esperti di scienze dello sport è quello di fornire ad allenatori e medici informazioni affidabili sulla tecnica di esecuzione del gesto sportivo in esame. La mancanza di metodi che consentano la valutazione dell’atleta direttamente sul campo e la stima accurata della dinamica articolare costituisce, ad oggi, il principale limite nel raggiungimento di questo scopo. La presente tesi si propone di fornire un contributo allo sviluppo di tali metodi.
Il lavoro si articola secondo due approcci complementari: un Approccio a Bassa Risoluzione - legato alla valutazione della prestazione – attraverso il quale è stato esplorato l'uso di sensori inerziali indossabili durante diverse fasi della corsa di velocità, e un Approccio ad Alta Risoluzione - relativo alla stima della dinamica articolare per la prevenzione degli infortuni - dove sono stati definiti vincoli non rigidi per un modello cinematico del ginocchio da integrare in tecniche di ottimizzazione multi-segmento per la stima della posizione e dell’orientamento delle ossa durante il movimento.
I risultati ottenuti con l’Approccio a Bassa Risoluzione indicano che, in virtù della loro portabilità ed economicità, i sensori inerziali rappresentano una valida alternativa alla tradizionale strumentazione di laboratorio per la valutazione della prestazione durante la corsa. Utilizzando i dati di accelerazione e velocità angolare provenienti dai sensori, sono stati stimati l’inclinazione e la velocità angolare del tronco, la velocità lineare istantanea e lo spostamento di un punto che approssima il centro di massa, e le durate della fase di appoggio e del ciclo del passo.
Per quanto riguarda l'Approccio ad Alta Risoluzione, i risultati indicano che le lunghezze del legamento crociato anteriore e del collaterale laterale diminuiscono, mentre quella del fascio profondo del legamento collaterale mediale aumenta durante la flessione. Le variazioni di lunghezza del legamento crociato posteriore e del fascio superficiale del legamento collaterale mediale sono risultate dello stesso ordine dell’errore sperimentale. Al fine di integrare tali informazioni in una procedura di ottimizzazione multi-segmento, è stato definito un modello matematico del ginocchio che fornisce le lunghezze plausibili dei legamenti in funzione dell’angolo di flessione.
FRENCH VERSION
La biomécanique du sport décrit le mouvement humain dans le but d’améliorer la performance et de réduire les blessures. Dans ce contexte, le but des experts des sciences sportives est de fournir aux entraîneurs et médecins des informations fiables sur la technique des athlètes. Le manque de méthodes permettant l'évaluation des athlètes sur le terrain ainsi que l'estimation précise des efforts articulaires représente, à ce jour, une limitation majeure pour atteindre ces objectifs. Les travaux effectués dans la thèse vise à contribuer au développement des ces méthodes.
Deux approches complémentaires ont été adoptées: une Approche à Basse Résolution – relative à l'évaluation de la performance – où l'utilisation de capteurs inertiels portables est exploitée au cours des différentes phases de la course de vitesse, et une Approche à Haute Résolution – lié à l’estimation des efforts articulaires pour la prévention des blessures – où des contraintes personnalisées pour la modélisation cinématique du genou dans le contexte des techniques d'optimisation multi-corps ont été définies.
Les résultats obtenus par l'Approche à Basse Résolution indiquent que, en raison de leur portabilité et leur faible coût, les capteurs inertiels sont une alternative valable aux instrumentations de laboratoire pour l'évaluation de la performance pendant la course de vitesse. En utilisant les données d'accélération et de vitesse angulaire, l’inclinaison et la vitesse angulaire du tronc, la vitesse horizontale instantanée et le déplacement du centre de masse, ainsi que la durée de la phase d’appui et du pas ont été estimés.
En ce qui concerne l'Approche à Haute Résolution, les résultats ont montré que les longueurs du ligament antérieur croisé et du latéral externe diminuaient, alors que celle du faisceau profond du ligament latéral interne augmentait de manière significative lors de la flexion. Les variations de longueur du ligament croisé postérieur et du faisceau superficiel du ligament latéral médial étaient de l’ordre de l'indétermination expérimentale. Un modèle mathématique a été fourni qui a permis l'estimation des longueurs ligamentaires personnalisées en fonction de la flexion du genou et qui peuvent être intégrées dans une procédure d'optimisation multi-corps.
EXTENDED SUMMARY
INTRODUCTION AND AIM OF THE THESIS
Sports biomechanics describes the human movement from a performance enhancement and an injury reduction perspective. In this respect, the purpose of sports scientists is to support coaches and physicians with reliable and usable information related to the athletes’ correct or incorrect technique.
Biomechanical research in sports has usually produced interesting descriptions of the basic kinematic and kinetic features of specific athletic movements, in order to find possible solutions for performance enhancement and, to a lesser extent, for injury prevention. Unfortunately, these surveys have often lacked either in providing a theoretical rationale or in presenting results that could be directly understood and practically used by trainers and athletes. The lack of methods and protocols allowing for in-field athlete evaluation as well as for accurate joint forces estimate represents, to date, the main reasons of this failure.
The main purpose of the present thesis is to provide a contribution towards the development of such methods, focusing, in particular, on sprint running evaluation. Two complementary approaches are adopted: a Low Resolution Approach, where the use of wearable inertial measurement units are exploited during different phases of sprint running, and a High Resolution Approach, where subject-specific, non-rigid constraints for knee joint kinematic modelling used in multi-body optimization techniques are defined.
LOW RESOLUTION APPROACH
The evaluation of athlete’s performance is one of the main issues of coaching, as well as of sports biomechanical analysis. To this aim, in-field assessment of the athlete performance, without influencing or constraining athletes’ activities, is now becoming mandatory.
Among the new wearable and lightweight technologies allowing for such assessment, inertial measurement units (IMUs) appear to be a good compromise between practicality and accuracy. These sensors combine three-axial accelerometers and gyroscopes, and, when a measure of a global reference frame is required, a magnetometer is also implemented. They allow data collection during
unconstrained continuous movement over prolonged periods of time, potentially even during training and competition. Nevertheless, the extraction of movement-related information from the signal derived from IMUs can be strongly jeopardized by offset errors that rapidly accumulate over time (Woodman, 2007) and sensor wide oscillations caused by the inertia of soft tissues (de Leva & Cappozzo, 2006; Forner-Cordero et al., 2008).
The use of such sensors was explored in three studies aiming at estimating performance-correlated biomechanical variables during the different phases of sprint running (block-start, pick-up or acceleration, and maintenance phases).
Ad-hoc methods aimed at reducing the above mentioned sources of error were
defined. In particular, the trunk inclination and angular velocity, as well as the instantaneous horizontal velocity and displacement of the center of mass will be estimated during in-lab sprint running. The stride and stance durations will be assessed on-the-field during the maintenance phase.
Study one – Trunk inclination during the sprint start
The execution of the start is crucial in determining the performance during sprint running. Although trunk inclination is acknowledged to be a key element in moving from the crouch to the upright position, only few study focused on this parameter during the block start and the pick-up phases (Mero, Luhtanen, & Komi, 1983; Čoh, Jošt, Škof, Tomažin, & Dolenec, 1998; Slawinski, Bonnefoy, & Levêque, 2010).
The purpose of this study was to provide coaches with an instrument able to reliably estimate such parameter in-field. To this aim, the accuracy of an inertial measurement unit (IMU) in estimating its rotation about a local axis (referred to as “quality”) and the relationship between this rotation and trunk inclination in the progression plane (referred to as “consistency”) were assessed during block start and pick-up phases.
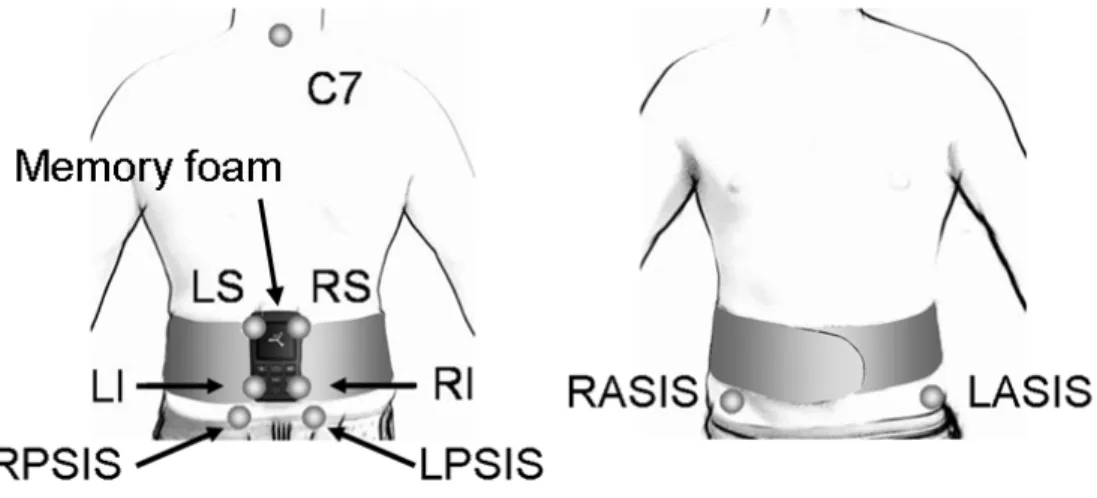
Five male sprinters performed four in-lab sprint starts. The block start phase and the first three steps of the pick-up phase were analysed. Data provided by an IMU (FreeSense, Sensorize Ltd, Italy) positioned on the trunk at L2 level were compared to reference stereophotogrammetric measurements. To reduce soft tissue oscillations, a memory foam material and an elastic belt were used. The
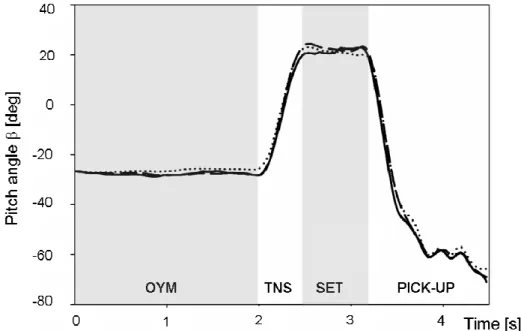
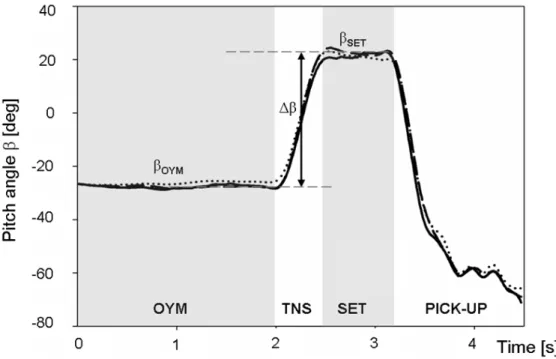
trunk was modeled as a rigid segment joining C7 and the midpoint between the posterior superior iliac spines. The inclination of the unit (pitch angle: β) was estimated by combining the information provided by both the accelerometer, during the static phases of the movement, and the gyroscope, during the non-static phases. To improve the accuracy of such estimate, a Kalman algorithm (Kalman, 1960; Jurman, Jankovec, Kamnik, & Topic, 2007) was designed to automatically identify these static and non-static phases and to use a proper combination of the information provided by the two sensors. Root Mean Squared Errors, Pearson’s correlation coefficient and Bland and Altman method (Nevill & Atkinson, 1997) were used to assess the quality and consistency of the estimates.
Figure 1: Typical pitch angles (β) for one trial as obtained from the IMU (solid line) and from the stereophotogrammetric system: IMU reference frame (dotted line) and trunk reference frame (dashed line). The different phases of the start are also indicated: OYM: “on your marks” position; TNS: transition phase; SET: “set” position, and PICK-UP: pick-up phase. The pitch angular displacement was considered to be zero when the unit was in a horizontal position; positive angles correspond to clockwise rotations.
The quality of the IMU estimates and their consistency with trunk inclination were high both in terms of curve similarity (correlation r>0.99) and bias (lower than 1 and 4 deg, respectively) (Fig. 1). The agreement between the unit and the trunk inclination, moreover, seems to support track and field coaches’ approach in considering the trunk as a rigid segment. These results open a
promising scenario for an accurate in-field use of IMUs for sprint start performance assessment.
Study two – Center of mass instantaneous velocity and displacement during the acceleration phase
When the focus is on sprint running performance determinants and limiting factors, biomechanical parameters as the stance duration, the step length and the center of mass (CoM) instantaneous velocity are crucial. Although these variables should be obtained by numerically integrating the acceleration signal provided, for instance, by inertial measurement units, in practice, offset errors that rapidly accumulate over time (Woodman, 2007) yield to unreliable velocity and, therefore, displacement.
The purpose of the study was to estimate the instantaneous horizontal velocity and displacement of a point approximating the CoM during sprint running by using a single inertial sensor. To this aim, a methodology for reducing the effects of the above mentioned errors was developed. Low frequency errors were compensated by reducing the numerical integration interval to the stance phase and by predicting the kinematics of the sensor during the flight phase. The initial conditions of the integration process were, then, cyclically determined.
Six sprinters performed three in-lab sprint runs, starting from a standing position. Due to limited laboratory volume only the first three steps were analysed. An IMU (MTx, Xsens, Netherlands) was positioned on the back trunk. Stereophotogrammetry and force platforms were used to validate final results. Reference and inertial sensors data were collected simultaneously at 100 samples per second. The instantaneous progression velocity and displacement were computed by numerical integration of the acceleration. The integration was limited to the stance phase only, to avoid the drift typical of the integration process. During the flight phase, the horizontal kinematics of the IMU was predicted using the ballistic law of motion; the velocity at the instant of take-off was the last value of the previously integrated acceleration. This procedure was reiterated for each step. The stance time (ST), CoM progression displacement (d) and the mean progression velocity (v) were estimated and compared with reference data. The
method reliability was assessed by mean of multiple statistical tests (Multivariate ANOVA, Pearson’s correlation coefficient, two-tailed paired t-test).
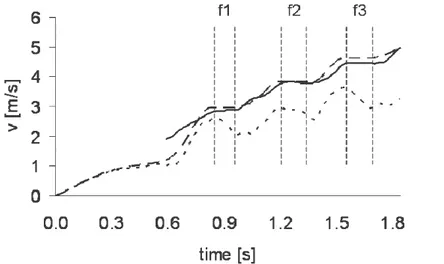
Results showed a high correlation (r>0.9) between IMU and reference estimates for each parameter (Fig. 2). No statistical differences were found between IMU and reference for v and ST.
Figure 2: Instantaneous progression velocity as obtained by the reference measurements (solid line), computed by numerical integration of the acceleration for the whole duration of the task (dashed line) and with the algorithm proposed in this study (dashed line). Vertical dashed lines identify the flight phases (f1, f2 and f3).
The methodology proved to successfully compensate the numerical integration errors during in-lab non steady-state running. In-field validation is binding in order to provide track and field coaches with reliable and accurate information.
Study three – Temporal parameters during the maintenance phase
In the literature, walking and distance running temporal parameters have been generally determined by identifying mechanically-related features in the acceleration signal waveforms (Auvinet, Gloria, Renault, & Barrey, 2002; Kavanagh & Menz, 2008; Wixted, Billing, & James, 2010). Robustness and reliability of these temporal estimates, however, highly depends on the signal to noise ratio, especially unfavourable during sprint running analysis as the explosiveness of the task causes greater movements of the IMU relative to the underlying skeleton (Pain & Challis, 2006). For this reason, sprint running analysis is more challenging than walking or distance running.
The aim of the study was to identify recognizable and consistent features in the waveform of the signals supplied by a trunk mounted IMU, or thereof derived, for the estimation of stance duration during in-field sprint running.
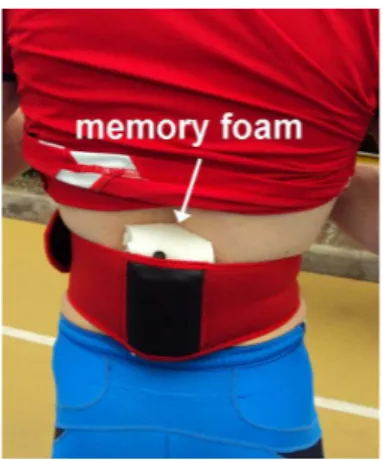
Six amateur (group A) and five elite (group B) athletes performed three 60 m sprint runs on-the-track, starting from a standing position. Four steps at each athlete maximal speed were analysed. An IMU (FreeSense, Sensorize Ltd, Italy) containing a 3D accelerometer and gyroscope was positioned on the lower back trunk at L2 level with an ad-hoc elastic belt. To limit the unit oscillations relative to the underlying bone, a memory foam material was placed between the paravertebral muscles and the IMU (Fig. 3). Data provided by the IMU, acquired at 200 samples per second, were compared to reference forceplate and high-speed camera measurements. The magnitude of the acceleration (a) and angular velocity (ω) vectors as well as their 1st ( a& and ω& ) and 2nd ( a&& and ω& ) wavelet-mediated &
derivatives were computed (Jianwen, Jing, & Jinhua, 2006). Features adequate for automatic detection of Foot-Strike (FS) and Foot-Off (FO) instants were identified and, thereafter, used to estimate the stance (dstance) and stride (dstride) durations.
Repeated-measure ANOVA tests and Bland and Altman method (Nevill & Atkinson, 1997) were used to assess the accuracy of the estimates.
No repeatable and quantifiable features, adequate for automatic detection, were identified in either a or its derivatives. Conversely, the magnitude of the angular velocity signal was characterized by a consistent positive peak which occurred approximately at the end of each step cycle in both groups of athletes. This peak was clearly visible even by simple visual inspection of the signal and could be used to estimate dstride (Fig. 4).
Figure 3: Belt and sensor unit location on the lower back trunk of an elite athlete of group B. Indication of the memory foam material location is also provided.
Figure 4: ω (grey dotted line), ω& (dashed line) and ω&& (solid line) with reference to a randomly chosen subject of amateur athletes (group A). Grey sections represent three consecutive stance phases.
The beginning and end of the stance were identified from positive and negative peaks on ω& waveform (Fig. 4). These peaks were found to be consistently & synchronized with FS and FO across steps, trials, subjects and groups. The mean of the absolute bias between the reference and the IMU estimates was found to be in the order of the temporal resolution of the IMU (0.005 s). It can be speculated that increasing that resolution may improve the final results. As track and field coaches’ requirement is to obtain the stance time profile over time and during the whole race, future works will concern the validation of the method on different phases of the sprint run.
HIGH RESOLUTION APPROACH
A clear understanding of the definitive relationships between biomechanical measures and injury onset in sprint running would lead to better injury prevention strategies and would help track and field coaches to define effective training programs. In this respect, forces and force-related factors appear to be the prime agents that determine the likelihood and severity of injury. Epidemiological studies of sprint running injuries, in particular, found the knee to be the most frequent site of injuries (Brunet, Cook, Brinker, & Dickinson, 1990).
The estimate of knee joint forces during running would be, therefore, of great help for athletes, coaches and physicians.
The accuracy of inverse dynamics methods, often used in sports biomechanics to estimate internal and external forces, is affected by several sources of error. Among them, the motion of soft tissues relative to the underlying bones (soft tissue artefact – STA) is considered as the most important, particularly in sports applications. Different techniques have been proposed to compensate for STA. The multi-body optimization (MBO) method, in particular, aims at optimally estimating the location in space of a chain of bones interconnected in joints. Each joint is modelled by embedding specified constraints. To date, MBO has been performed using spherical, revolute or universal joint constraints (Lu & O'Connor, 1999; Andersen, Damsgaard, & Rasmussen, 2009), as well as using a parallel mechanisms (Duprey, Cheze, & Dumas, 2010). In light of recent results reported in the literature (Andersen, Damsgaard, & Rasmussen, 2009; Duprey, Cheze, & Dumas, 2010), the choice of joint constraints appears to be crucial.
Study four - Tibio-femoral joint constraints for multi-body optimization
To further improve the quality of knee joint models used in the MBO approach, the definition of non-rigid constraints which take into account the anatomy of the subject appear to be ideal. The aim of the study was to provide plausible, subject-specific values for the distances between the origin and insertion landmarks of the main knee ligaments (referred to as “ligament lengths”), during loaded continuous knee flexion-extension.
Two orthogonal digital radiographs of six knee specimens (femur, tibia, patella and fibula) were acquired using a low dosage X-ray system (EOS®,
EOS-imaging, France). The 3D geometry of each specimen was then obtained by means of a reconstruction algorithm (Chaibi et al., 2011). The areas of origin and insertion of the anterior and posterior cruciate, lateral collateral, and deep and superficial bundles of the medial collateral ligaments (ACL, PCL, LCL, MCLdeep, MCLsup) were identified on femur and tibia templates using the mouse pointer by three expert orthopaedic surgeons (virtual palpation). Attachments sites were estimated for the six reconstructed knees by matching the bone templates to the low dosage stereoradiography images. Movement data of the specimens were obtained by
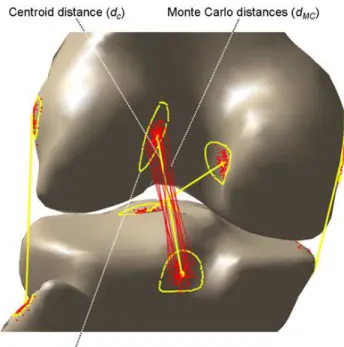
means of a stereophotogrammetric system (Polaris, Nothern Digital Inc., Canada), using pins carrying a cluster of markers and inserted into the femur and the tibia. Data were, therefore, free from skin movement artefacts. For each knee, the centroids of the attachment areas of each ligament were determined and the Euclidean distance between the origin and insertion centroids computed (dc). The
impact of the inaccuracies associated with the virtual palpation was assessed performing a Monte Carlo simulation. The Euclidean distance between each possible couple of the points thus generated (100*100 couples) was also computed during knee motion (dMC) (Fig. 5). Ligament length variations (∆dMC) were then
calculated relative to the distances at knee full extension and expressed as percentage of the latter value for each sampled knee flexion angle.
Figure 5: 3D digital model of one knee specimen: the ligament attachment areas and the tibio-femoral distances between the centroids (dc) (yellow lines) as well as between
selected Monte Carlo pairs (dMC) (red lines) are depicted.
The mean and standard deviation (SD) curves of ∆dMC are shown in Fig. 6
for each ligament. To facilitate embedding this information in the knee kinematic model to be used in the MBO process, the mean of the ∆dMC curves vs flexion angle
thus obtained, plus and minus one standard deviation, were fitted with a polynomial regression function of the fifth order. The ACL and LCL lengths were found to decrease, and the MCLdeep length to increase significantly during flexion, while PCL and MCLsup length trend of variation was concealed by the
experimental indeterminacy. A mathematical model was provided that allowed the estimate of subject-specific ligament lengths as a function of knee flexion and that can be integrated in a multi-body optimization procedure. The efficacy of this model, as opposed to those already implemented, must be evaluated in terms of consequences on the estimate of joint kinetics, particularly when the inertial effects of soft tissue masses are involved.
Figure 6: Distance variation patterns (mean ± 1SD) vs the knee flexion angle as obtained through the Monte Carlo simulation for each ligament,
∆dMC. Each variation is
expressed as a percentage of the distance at knee maximal extension.
CONCLUSIONS
In the framework of sports biomechanics analysis, the results and the considerations carried out in the present thesis aim at providing a contribution towards the development of methods for in-field athlete evaluation as well as for accurate joint forces estimate.
Results about the Low Resolution Approach indicate that, due to their portability and inexpensiveness, inertial measurement units are a valid alternative to traditional laboratory-based instrumentations for in-field performance evaluation of sprint running. Using acceleration and angular velocity data, the following quantities were estimated: trunk inclination and angular velocity, instantaneous horizontal velocity and displacement of a point approximating the CoM, and stride and stance durations. In order to limit the motion of the soft tissue masses relative to the underlying bones, careful attention has to be paid to the location and method of fixation of the sensor. The use of memory foam materials and elastic belts appears to be effective. To limit the errors yielded by the unstable bias of the signal, the integration interval should be reduced, and boundary conditions used to cyclically correct the drift errors explored.
Results about the High Resolution Approach indicate that, in a kinematic model of the knee based on joint constraints, the length of the ACL, LCL and MCLdeep should be considered as variable during knee flexion. The length of the PCL and of the MCLsup was found to be highly dependent from the selected attachment sites. These ligaments could be, therefore, considered isometric during knee flexion. These results represent a first contribution to the definition of methods aiming at improving the accuracy of inverse dynamic estimates. On the other hand, as the MBO approach aims at providing an optimal estimate of the 3D position of a bone-chain, the reconstruction of the soft tissue movements may be attempted. A biodynamic model of the human body based on the reconstructed movement could then be developed. The combination of subject-specific constraint-based joint models with such biodynamic model appears to justify the investment of resources aimed at improving the MBO approach.
REFERENCES
Andersen, M.S., Damsgaard, M., & Rasmussen, J. (2009). Kinematic analysis of over-determinate biomechanical systems. Computer Methods in Biomechanics and Biomedical Engineering, 12(4), 371-384.
Auvinet, B., Gloria, E., Renault, G., & Barrey, E. (2002). Runner’s stride analysis: comparison of kinematic and kinetic analyses under field conditions. Science & Sports, 17, 92-94. Brunet, M. E., Cook, S. D., Brinker, M. R., & Dickinson, J. A. (1990). A survey of running injuries in 1505 competitive and recreational runners. Journal of Sports Medicine and Physical Fitness, 30(3), 307-315.
Chaibi, Y., Cresson, T., Aubert, B., Hausselle, J., Neyret, P., Hauger, O., & Skalli, W. (2011). Fast 3D reconstruction of the lower limb using a parametric model and statistical inferences and clinical measurements calculation from biplanar X-rays. Computer Methods in Biomechanics and Biomedical Engineering, in press.
Čoh, M., Jošt, B., Škof, B., Tomažin, K., & Dolenec, A. (1998). Kinematic and kinetic parameters of the sprint start and start acceleration model of top sprinters. Gymnica, 28, 33-42.
de Leva, P., & Cappozzo, A. (2006). Estimating forces in sports biomechanics. In A. Rainoldi, M. A. Minetto & R. Merletti (Eds.), Turin (IT), pp. 71-88.
Duprey, S., Cheze, L., & Dumas, R. (2010). Influence of joint constraints on lower limb kinematics estimation from skin markers using global optimization. Journal of Biomechanics, 43(14), 2858-2862.
Forner-Cordero, A., Mateu-Arce, M., Forner-Cordero, I., Alcántara, E., Moreno, J. C., & Pons, J. L. (2008). Study of the motion artefacts of skin-mounted inertial sensors under different attachment conditions. Physiological Measurement, 29(4), N21-31.
Jianwen, L., Jing, B., & Jinhua, S. (2006). Application of the wavelet transforms on axial strain calculation in ultrasound elastography. Progress in Natural Science, 16(9), 942-947. Jurman, D., Jankovec, M., Kamnik, R., & Topic, M. (2007). Calibration and data fusion solution for the miniature attitude and heading reference system. Sensors and Actuators a-Physical, 138(2), 411-420.
Kalman, R. E. (1960). A new approach to linear filtering and prediction problems. Journal of basic Engineering, 82(1), 35-45.
Kavanagh, J. J., & Menz, H. B. (2008). Accelerometry: a technique for quantifying movement patterns during walking. Gait & Posture, 28(1), 1-15.
Lu, T. W., & O'Connor, J. J. (1999). Bone position estimation from skin marker co-ordinates using global optimisation with joint constraints. Journal of Biomechanics, 32(2), 129-134. Mero, A., Luhtanen, P., & Komi, P. (1983). A Biomechanical Study of the Sprint Start. Scandinavian Journal of Sports Science, 5(1), 20-28.
Nevill, A. M., & Atkinson, G. (1997). Assessing agreement between measurements recorded on a ratio scale in sports medicine and sports science. British Journal of Sports Medicine, 31(4), 314-318.
Pain, M. T. G., & Challis, J. H. (2006). The influence of soft tissue movement on ground reaction forces, joint torques and joint reaction forces in drop landings. Journal of Biomechanics, 39(1), 119-124.
Slawinski, J., Bonnefoy, A., & Levêque, J. M. (2010). Kinematic and Kinetic Comparisons of Elite and Well-Trained Sprinters During Sprint Start. The Journal of Strength and Conditioning Research, 24(4), 896-905.
Wixted, A. J., Billing, D. C., & James, D. A. (2010). Validation of trunk mounted inertial sensors for analysing running biomechanics under field conditions, using synchronously collected foot contact data. Sports Engineering, 12, 207-212.
Woodman, O. J. (2007). Introduction to Inertial Navigation. Journal of Navigation, 9(3), 249-249.
CHAPTER 1
THEORETICAL BACKGROUND:
SPRINT RUNNING BIOMECHANICS
ABSTRACT
The continued increase in running popularity has prompted a comparable explosion of research in the last decades. This has been further potentiated by recent technical and technological advancements. The current state of knowledge about the major findings in sprint running biomechanics is presented and a brief overview of the current technologies used in the assessment of running is provided.
Many variables have been studied pertaining to the different phases of sprint running. Significant factors include: technique, electromyographic activity, kinematics and kinetics. Sprint technique has been analysed during the block start, acceleration and maintenance phases. The EMG activity pattern of the main muscles is described in the literature, but there is a need of further investigation, particularly for highly skilled sprinters. The reaction time of good athletes is short, but it does not correlate with performance levels. The force-power production and the force impulse during the block start phase are key factors in order to generate high velocity. Nevertheless, they proved to correlate with the incidence of knee-related injuries. During acceleration and maintenance phases, the reduction of the horizontal braking forces and the maximisation of the propulsive forces are crucial in order not to decrease velocity. Leg and vertical stiffness are sensitive parameters for the optimization of performance and, at the same time, for the reduction of injury risk. Several external factors, as footwear, ground reaction surface and air resistance, may influence the athlete’s technique and performance. Efficient sprint running requires an optimal combination between the examined biomechanical variables and such factors.
Interestingly, while a large number of studies focused the determinants of the performance, there is a general paucity of scientific works showing definitive relationships between either anatomical factors and injury, or biomechanical measures and injury during sprint running.
As concerns technologies and methods for sprint running analysis, although traditional measurement devices such as motion capture systems, force plates, and electromyography are considered as the most accurate methods, they suffer from
limitations, such as expense and lack of portability. Recent technological advances have made available more viable options such as accelerometers, electrogoniometers, gyroscopes, and in-shoe pressure sensors. Combined with wireless technology and/or data loggers, they appear to be an affordable, lightweight alternative to running analysis, allowing data collection over prolonged periods of time in almost any environment.
KEYWORDS: Sprint running; Biomechanical variables; Methods; Technology; State
1.1 INTRODUCTION
It is mandatory to start an issue about running biomechanics in the following classical way: human running is characterised by a phase of the locomotor activity during which the body is not in contact with the ground. This means that the demarcation between walking and running occurs when periods of double support during the foot-ground contact phase (or stance phase) of the gait cycle (both feet are simultaneously in contact with the ground) give way to two periods of double float at the beginning and the end of the swing phase of gait (neither foot is touching the ground) (Fig. 1). This is, in broad terms, the definition provided by E. J. Marey following his experimental acquisitions with his “chassure dynamographique”.
Figure 1 (1.1): Left and right foot temporal parameters (foot-strike: LFS, RFS, and toe-off: LFO, RFO) during running (from Zernicke & Whiting, 2000).
It is evident that running, referred to as a specific motor paradigm, is legitimated by the fact that it allows for higher progression speed with respect to walking and race-walking. Generally, as speed further increases, initial contact changes from being on the hindfoot to the forefoot. This typically marks the distinction between running and sprinting. The higher the progression speed, the shorter the duration of the stance phase and the longer the flight phase time. Novacheck et al. (1998) reported that, during running, stance and flight phase durations are respectively about 40% and 60% of the step cycle, while in elite
sprinters, duration can reach 20% and 80% respectively. For distance running the body is moved at a controlled rate in relation to the energy demand of the race. For sprinting, on the other hand, the body and its segments are moved as rapidly as possible throughout the entire race. As an example of the different movement strategies adopted during running and sprinting, ankle, knee and hip joint kinematics at different progression speed are reported in Fig. 2.
The difference between running and sprinting is in the goal to be achieved (Novacheck, 1998). Running is performed over longer distances, for endurance, and primarily with aerobic metabolism. Jogging, road racing, and marathons are examples. Sprinting activities are done over shorter distances and at faster speeds, with the goal of covering a relatively short distance in the shortest period of time possible without the need to preserve aerobic metabolism (Novacheck, 1998).
Figure 2 (1.1): Ankle, knee and hip motion time-curve throughout a running cycle at four different running speeds: an example runner. Angle conventions are also indicated (adapted from Zernicke & Whiting, 2000).
Rapid movements of the body from one place to another are required in many sports activities and, particularly, in track and field sprinting events, where athletes’ objective is simply to cover a given distance (either on the flat or over obstacles) in the least possible time (Hay, 1993). Among running track sprinting events, the most studied and considered is the 100 m race. It is the shortest outdoor sprint race distance in athletics and it is often used as a paradigm to describe and analyse the different phases characterising sprint running and the relevant biomechanical factors influencing the athlete performance.
1.2 SPRINT RUNNING BIOMECHANICS: PERFORMANCE AND INJURY-RELATED VARIABLES
Early studies on the velocity-time curve in sprint running were concluded by Hill (1927). Since then, there has been a great deal of research (Volkov & Lapin, 1979; Tellez & Doolittle, 1984), including the mathematical representation of such curve (Henry, 1954; Morton, 1985). A typical speed-time curve, as measured and modelled by Morin et al. (2006), is reported in Fig. 3.
Figure 3 (1.2): Typical speed-time curve measured by the radar (bold line) and modelled by the biexponential equation (gray line). In this example, vmax =7.98m·s–1, tvmax = 7.71 s, and the time constants for acceleration and deceleration are respectively τ1 = 2.32 s and τ2 =107s (from Morin, Jeannin, Chevallier, & Belli, 2006).
Although no general consensus has still been reached by the scientific community, as well as by track and field coaches, about the number and type of phases in which a 100 m sprint race should be divided (Jones, Bezodis, & Thompson, 2009), in the present review four different phases will be considered: the block-start, the acceleration or pick-up phase, the maintenance and the final deceleration. There are many factors that affect the duration of each of theses phases. Internal or personal factors, such as motivation, technique, fitness and fatigue, as well as external aspects, like strength and direction of wind, air temperature, and texture or hardness of the track surface (Nigg & Yeadon, 1987; Stafilidis & Arampatzis, 2007). Their time-duration is, therefore, highly variable even when considering multiple races of the same athlete and should not be used as a criterion in the identification of different phases. From Jones et al., (2009), the most used criterion appears to be the effectiveness of the coaching activity, in terms of giving to the athletes the necessary level of specificity in the instruction and feedback. In this respect, the start phase is defined as ranging from when the athlete obtained a “Set” position in the blocks to the point when the front foot broke contact with the block. The acceleration/pick-up phase is defined as being from when the athlete’s front foot left the block to the point when he/she attained an upright sprinting position. The maintenance phase is seen as the phase in which the athlete is able to maintain his/her velocity almost constant. Finally, the deceleration phase is defined as the remainder of the race; that is, from when the athlete’s velocity starts to decrease to when the finishing line is crossed (Mero, Komi, & Gregor, 1992).
In the following sections, the execution technique, the pattern of muscular activation (electromyography – EMG) as well as the main kinematic and kinetic variables for each of the four identified phases will be discussed.
1.2.1 Block start phase
The block start phase refers to the time when the sprinter is in contact with the starting blocks. Blocks have been regularly used in track competitions under the International Amateur Athletic Federation (IAAF) rules since 1948, the year of London Olympic Games.
The block start phase starts when the track judge gives the “On your marks” command and ends with the athlete block clearing. After the “On your marks” command, the judge gives the “Set” order and finally a gun is fired (or else there is a final “Go” command by the judge) (Fig. 4). When the athlete hears the initial command, "On your marks", he/she moves forward and adopts a position with the hands shoulder width apart and just behind the starting line. The feet are in contact with the starting blocks and the knee of the rear leg is in contact with the track. On hearing the command "Set" the athlete raises the knee of the rear leg off the ground and thereby elevates the hips and shifts the body centre of mass (CoM) up and out. Then on the command "Go" or when the gun is fired the athlete reacts by lifting the hands from the track, swinging the arms vigorously and driving with both legs off the blocks and into the first running strides (Fig. 4).
Figure 4 (1.2): The action sequence during the block start phase (adapted from Hay, 1993).
The purpose of the block start is to facilitate an efficient displacement of the athlete in the direction of the run. The main objectives of the athlete during this phase can be summarised as follows (Tellez & Doolittle, 1984):
• To establish a balanced position on the blocks.
• To obtain a body position with the CoM as high as it is practical and slightly forward of the base of support.
• To apply a force against the blocks whose line of action goes through the ankle, knee and hip joints, the centre of the trunk and of the head.
• To apply this force against the blocks and through the body at an angle of approximately 45°.
EMG activity
The first aspect to be considered when analysing the block start phase is the reaction time. It has been defined as the time that elapses between the sound of the starter’s gun and the moment the athlete is able to exert a certain pressure against the starting blocks. Reaction time measurement currently includes the time that it takes for the sound of the gun to reach the athlete, the time it takes for the athlete to react to the gunshot and the mechanical delay of measurements inherent in the starting blocks.
An attempt has been made to separate premotor time and motor time components in the block start phase (Mero & Komi, 1990). The former is defined as the time from the gun signal until the onset of EMG activity in skeletal muscle. Motor time is the delay between the onset of electrical activity and force production by the muscles. EMG results (Mero & Komi, 1990) showed that total reaction time can be effectively divided into premotor and motor time. However, electrical activity in some muscles started to increase after total reaction time as a result of the multi-joint nature of the sprint start movement. It is clear that, after the gun signal, leg extensor muscles must contribute maximally to the production of force and ultimately to the running velocity. The faster the electrical activity begins in every muscle, the faster the athlete can be in maximising the neuromuscular performance. For improving the start action, it is desirable that all extensor muscles are activated before any force can be detected against the blocks.
Mero and Komi (1990) used a force threshold of 10% from the maximal horizontal force production as a measure of reaction time. Total reaction time was on average 120 ms, which was the minimal reaction time for a valid start in the Rome World Championships in 1987. In fact, no definitive study exists which could be used to establish a minimum reaction time to define a false start. For comparison of reaction times to be used, uniform conditions for measurement must be established.
The main conclusions regarding reaction time during the block start phase are (Moravec et al., 1988):
1. In identical events the average reaction times of women are longer than those of men;
3. Reaction time does not correlate with the performance levels, thus meaning that other parameters, as acceleration or maximum speed, may be more important than reaction time to final race performance.
General muscle activation patterns during the block start phase showed considerable individual variances (Mero & Komi, 1990) (Fig. 5). Results provided support for the concept that the gluteus maximus muscle is very active at the beginning of force production, while the gastroctemio muscle is the first muscle to become activated. The biceps femoris, as well, proved to be a very important muscle during the early stages of the sprint start. The duration of the force production by the front leg is nearly the same as that during the total block phase, because the front leg produces force from the beginning of the total force production to the end of the block phase (Baumann, 1976).
Figure 5 (1.2): Raw electromyographs of selected muscles in front and rear legs during maximal block start of one subject. TRT = total reaction time; FP = flight phase. The ground reaction force (horizontal and vertical components) is also displayed (from Mero & Komi, 1990).
Kinematics and kinetics
Many kinematic and kinetic variables have been studied pertaining the block start phase, over the past decades (Payne & Blader, 1971; Baumann, 1976;
Mero, Luhtanen, & Komi, 1983; Cappozzo, Gazzani, & Massacesi, 1989; Schot & Knutzen, 1992; Fortier, Basset, Mbourou, Faverial, & Teasdale, 2005; Čoh, et al., 2006; Slawinski, Bonnefoy, & Levêque, 2010; Slawinski et al., 2010). Different biomechanical variables were obtained and were shown to contribute to a fast start technique (Harland & Steele, 1997). In the following section, the main results about biomechanical variables are discussed.
• Inter-block distance: a medium block spacing (as opposed to the bunched or the elongated one), combined with the hips raised high in the set position, was theorised to enable sprinters to utilise more completely an extensor reflex of the muscle groups relevant to sprint starting (Schot & Knutzen, 1992). Furthermore, the medium starting position produced the fastest acceleration than enables both a powerful and quick recovery of the rear lower extremity (Čoh, et al., 2006).
• Block inclination: sprint start performance was shown to improve when decreasing block inclination. This improvement was attributed to an increased contribution of the medial gastrocnemius muscle during the eccentric and concentric phases of calf muscle contraction due to an earlier onset. This increased contribution appeared to be the result of progressive lengthening of the soleus and gastrocnemius muscles in the set position as the front block inclination decreased. Therefore, during the subsequent stretch-shorten cycle, force production was improved, more effectively providing and elastic contribution to the speed of muscle shortening (Mero, & Komi, 1990).
• Trunk and knee alignment during the “Set” position: an optimal “Set” position was shown to exist for highly skilled sprinters irrespective of variations in body structure. In particular, the stronger the sprinter, the more acute the joint angles can become. That is, stronger sprinters can use a greater range of joint extension to gain greater velocity when leaving the blocks (Mero, Luhtanen, & Komi, 1983; Slawinski, Bonnefoy, & Levêque, 2010). Knee angles during the “Set” position for elite and non-elite athletes are reported in Tab. 1.
• Hip joint alignment during the “Set” position: hip joint angles in the “Set” position have been found to significantly differ between good and average sprinters. In particular, skilled athletes reported lower joint angle values both for the front and the rear legs (41 and 80 deg respectively, against 52 and 89
deg for average athletes) (Mero, Luhtanen, & Komi, 1983; Slawinski, Bonnefoy, & Levêque, 2010). These findings suggested that more skilled sprinters placed their hip extensors muscles on a greater stretch than their less skilled counterparts.
• CoM position during the “Set” position: positioning the CoM as close as possible to the start line in the antero-posterior direction was suggested to be important in creating a good start, as it contributes to reach a position of maximum instability and it moves the athlete prospectively closer to the finish line, thus reducing the distance the sprinter must accomplish (Slawinski, Bonnefoy, & Levêque, 2010). However, too pronounced forward trunk lean in the “Set” position has to be avoided, as it excessively loads the hands (Tellez & Doolittle, 1984).
Table 1 (1.2): Front and rear knee angles for elite and well-trained sprinters during the “Set” position. The antero-posterior (XCM) and vertical (VCM) components of the CoM position with respect to the start line, together with the antero-posterior position of the shoulders (Xshoulder: midpoint of the line joining the right and the left acromions) are also provided (from Slawinski, Bonnefoy, & Levêque, 2010).
• Block time, velocity and acceleration: block time is defined as the time from the beginning of force production, with either foot, to the point where no further force production occurs against the blocks (i.e. block clearing) (Mero, Luhtanen, & Komi, 1983). From published data (Harland & Steele, 1997), it appears that more skilled sprinters exhibited shorter block times compared with their less skilled counterparts. As concerns resultant velocity and acceleration of the sprinter at loss of foot contact with the block (usually referred to as block or leaving velocity and acceleration), it is well documented how the ability of an athlete to leave the blocks at a high velocity generally increases with an increase in his/her force application on the blocks (Baumann, 1976; Cousins & Dyson,
2004; Mero & Komi, 1990; Slawinski, Bonnefoy, & Levêque, 2010; Čoh, et al., 2006).
• Peak-force production: faster sprinters have been characterised as being capable of more adequate propulsion on the rear block during their starts compared with slower sprinters (Slawinski, Bonnefoy, & Levêque, 2010). Moreover, skilled sprinters generally apply lower peak force on the rear block compared to the front block, with the rear block forces being exerted more rapidly. Fig. 6 reported the force time-curves measured on the rear and front blocks during the sprint start of a middle-level athlete (Payne & Blader, 1971).
Figure 6 (1.2): Resultant forces measured on the front (ant.) and on the rear (post.) starting blocks, as well as measured on both blocks (total) (adapted from Payne & Blader, 1971).
• Direction of force application: it has been claimed that a good start is characterised by the exertion of high forces in the horizontal direction (Baumann, 1976). The angle between the horizontal and the line joining the CoM to the front toe at the loss of front contact has been reported to range from 32 to 42 deg for skilled sprinters (Mero, Luhtanen, & Komi, 1983). Angles of force application relative to the horizontal have been reported to vary form 43 deg at loss of block contact to 50 deg at toe-off of the first step (Mero, Luhtanen, & Komi, 1983).
• Force impulse: impulse incorporates both block force and block time and it is representative of the average amount of force serving to propel the sprinter and the time over which this force acts. For skilled sprinters horizontal and vertical impulses have been reported to range from 233 to 234 Ns and 172 to 231 Ns, respectively (Mero, Luhtanen, & Komi, 1983; Slawinski, Bonnefoy, & Levêque, 2010). Baumann et al. (1976) also reported that faster sprinters were able to exert a greater impulse in the horizontal direction (263 Ns) than less skilled sprinters (214 Ns). As block time was not significantly different between these groups, the greater impulse exhibited by the elite sprinters was created by a greater average force production. Similar results have been reported recently by Slawinski et al. (2010).
1.2.2 Acceleration or pick-up phase
After the block clearing, the runner accelerates by increasing stride length and stride rate. The pick-up phase ranges from the block clearing to the instant of time in which the athlete attains an upright sprinting position. Its length is about 30 to 50 m in top sprinters during a 100 m race (Volkov & Lapin, 1979; Moravec et al., 1988). Two key aspects have been identified in the acceleration phase: arm action and leg extension (Jones, et al., 2009). As concerns the arm action, Thomson et al. (2009) identified how previous research (Hinrichs, Cavenagh, & Williams, 1987; Mann, Kotmel, & Herman, 2008) documented the arms’ balancing function in relation to the motion of the legs while sprinting. Nevertheless, up to now, no general consensus has been displayed about the amount of elbow and shoulder flexion and extension and no work seems to have specifically analysed the action of the arms within the pick-up phase. Leg extension refers to the hip and knee joints being fully extended prior to the athlete taking-off from each step in order to maximise the force exerted onto the running track. With this respect, it is necessary for both legs to have the same behaviour, symmetrical but alternate (Collier, 2002; Hunter, et al., 2004b). Two more aspects have been reported to be important during the acceleration phase: first contact times: Coh and Tomazin (2006) noted that contact phases become shorter and flight phases longer as the athlete progresses from the starting blocks; second the athlete’s posture: due to the development of running velocity and the subsequent dynamic changes in
running technique, the athletes’ ability to maintain their dynamic posture as opposed to the static posture of the sprint start appears to be crucial (Jones, et al., 2009).
EMG activity
Integrated EMG activity during acceleration has been reported by Mero and Peltola (1989). In that study two male sprinters ran a 100 m simulated race and, in the acceleration phase, there was a 4.8% higher maximal integrated EMG activity during contact than in the maximum constant speed phase. This may imply that neural activation of sprinters achieves its maximum in the acceleration phase.
Kinematics and kinetics
The main kinematic and kinetic parameters which have been investigated during the pick-up phases are hereafter discussed.
• Stance and flight phase duration: mean stance times during the acceleration phase for elite male sprinters have been shown to range from 0.160 s to 0.194 s for the first ground contact out of the blocks (Atwater, 1982; Mero & Komi, 1990; Čoh, et al., 2006), and from 0.150 to 0.181 s for the second ground contact (Atwater, 1982; Čoh, et al., 2006). Flight phases are characterised by lower durations: from 0.06 to 0.07 s for the first flight and from 0.044 to 0.090 s for the second flight phase (Atwater, 1982; Čoh, et al., 2006). Conversely, after the first steps, stance times tend to decrease while accelerating, and flight times to increase (Zernicke & Whiting, 2000).
• Step length: this is defined as the distance between the first contact point of one foot to the first contact point of the controlateral foot (differently to “stride length”, which is the distance between the first contact point of one foot to the first contact point of the same foot, like for example: right-left-right foot contacts). Increasing the length of the first step out of the blocks has been advocated as part of an optimal start (Čoh, et al., 2006). Nevertheless, anterior braking forces associated with the CoM being ahead of the first ground contact point were not significantly higher that that created with shorter steps (Schot & Knutzen, 1992). Moreover, an overly long first step may retard progress of the
sprinter. It has also been shown how the degree of forward lean in the “Set” position had a varying effect on first step length (Schot & Knutzen, 1992). Tab. 2 reports the step length, as well as the stance and flight times for the first ten steps of an elite sprinter during the acceleration phase (Čoh, et al., 2006).
Table 2 (1.2): Step length and ground contact and flight times of a professional sprinter during the first ten steps of the acceleration phase (from Čoh, et al., 2006).