COMPOSANTE SOUTERRAINE DE LA VULNÉRABILITÉ DES ARBRES À LA SÉCHERESSE : EFFET DE LA MICROTOPOGRAPHIE ET DE LA
DISPONIBILITÉ EN EAU SUR LA BIOMASSE ET LA PRODUCTION DE RACINES FINES EN FORÊT TEMPÉRÉE
MÉMOIRE PRÉSENTÉ
COMME EXIGENCE PARTIELLE DE LA MAÎTRISE EN BIOLOGIE
EXTENTIONNÉE DE
L'UNIVERSITÉ DU QUÉBEC À MONTRÉAL
PAR
FLORENCE TANIA TAUC
UNIVERSITÉ DU QUÉBEC À MONTRÉAL Service des bibliothèques
Avertissement
La diffusion de ce mémoire se fait dans le respect des droits de son auteur, qui a signé le formulaire Autorisation de reproduire et de diffuser un travail de recherche de cycles supérieurs (SDU-522 - Rév.0?-2011 ). Cette autorisation stipule que «conformément à l'article 11 du Règlement no 8 des études de cycles supérieurs, [l'auteur] concède à l'Université du Québec à Montréal une licence non exclusive d'utilisation et de publication de la totalité ou d'une partie importante de [son] travail de recherche pour des fins pédagogiques et non commerciales. Plus précisément, [l'auteur] autorise l'Université du Québec à Montréal à reproduire, diffuser, prêter, distribuer ou vendre des copies de [sor:~] travail de recherche à des fins non commerciales sur quelque support que ce soit, y compris l'Internet. Cette licence et cette autorisation n'entraînent pas une renonciation de [la] part [de l'auteur] à [ses] droits moraux ni à [ses] droits de propriété intellectuelle. Sauf entente contraire, [l'auteur] conserve la liberté de diffuser et de commercialiser ou non ce travail dont [il] possède un exemplaire.»
Cette maîtrise fut une expérience de vie très enrichissante. Je tiens à retnercier en premier lieu mes directeurs de recherche, la professeure Audrey Maheu et le professeur Frédérik Doyon, pour leur encadrement et leur soutien. Je remercie également la professeure Angélique Dupuch pour ses précieux conseils en statistiques, ainsi que le chercheur Daniel Houle pour son implication dans le projet.
Je remercie les propriétaires qui m'ont donné accès à leurs massifs forestiers en 2017 et sans qui cette étude n'aurait pu être possible. Mon travail sur le terrain fut particulièrement difficile et je suis très reconnaissante envers toutes les personnes qui ont participé à la récolte de données, tout particulièrement envers mes assistants de terrain Kilian Desjardins et Marie Gautreau, pour leur ténacité, leur soutien et leurs conseils éclairés. Un immense merci à Eva Masson pour avoir été présente du début à la fin. Je n'aurais pas autant apprécié ces années à Ripon sans sa bonne humeur et son soutien permanent. Merci à la communauté isfortienne d'avoir su rendre l'environnement de travail convivial et stimulant, et merci notamment au personnel de soutien composé de Julie Poirier, Jinny Allaire, Régis Pouliot et Srdjan Ostojic.
Je remercie également ma famille qui a été un vrai support tnalgré l'océan qui nous sépare. Je tiens particulièrement à remercier Anna Mazaleyrat qui a su jongler avec tnes moments de joie et de désespoir et n'ajamais cessé de m'encourager.
Merci aux bailleurs de fonds de ce projet, le Conseil de recherches en sciences naturelles et en génie du Canada, MiTACS, le consortium Ouranos, et la Coop des Frontières.
---1
TABLE DES MATIÈRES LISTE DES FIGURES ... v
LISTE DES TABLEAUX ... vii
LISTE DES AB RÉ VIA TI ONS, DES SIGLES ET DES ACRONYMES ... viii
RÉSUMÉ ... ix
CHAPITRE I INTRODUCTION GÉNÉRALE ... 1
1.1 Problématique ... 1
1.2 Mécanismes de mortalité des arbres ... 2
1.3 Facteurs de sensibilité à la sécheresse ... 4
1.4 Facteurs d'exposition à la sécheresse ... 5
1.5 Acclünatation du système racinaire aux conditions de site ... 6
1.6 Réponse du système racinaire à une sécheresse ... 8
1. 7 Objectif de 1' étude ... 10
CHAPITRE II TREE FINE ROOT PRODUCTION AND STANDING CROP DIFFER ACCORDING TO MICROTOPOGRAPHY ... 12
2.1 Introduction ... 14
2.2 Materials and methods ... 17
2.2.1 Study area ... 17
2.2.2 Experimental design ... 19
2.2.3 Statistical analysis ... 23
2.3 Results ... 25
2.3.1 Effect of microtopography on soil physical properties and moisture ... 25 2.3.2 Effect ofrainfall exclusion on soil moisture, fine root daily production and standing cr op ... 2 7
2.3.3 Effect ofmicrotopography on fine root daily production and standing crop
... 30
2.3 .4 Effect of tree species on fine root daily production and standing crop ... 34
2.4 Discussion ... 36
2.4.1 Mounds reduce water availability because of their shape and their soil properties ... 36
2.4.2 Microtopography influences fine root growth but not morphology ... 37
2.4.3 Species influences fine root growth and vertical distribution but to a lesser degree than microtopography ... 40
2.4.4 Rainfall exclusion reduced soil moisture but not sufficiently to produce major stress ... 42
2.4.5 Limitations of the study ... 43
2.5 Conclusion ... 45
CHAPITRE III CONCLUSION GÉNÉRALE ... 46
ANNEXE A COORDINATES OF THE SAMPLING SITES ... 49
ANNEXE B MODELS DESCRIBING CLAY CONTENT AND STONE CONTENT ... 50
ANNEXE C MO DEL DESCRIBING SOIL W A TER CONTENT ... 51
ANNEXE D MO DEL DESCRIBING SOIL W A TER POTENTIAL ... 52
ANNEXEE MODEL DESCRIBING THE EFFECT OF RAINFALL EXCLUSION ON FINE ROOT DAIL Y PRODUCTION ... 53
ANNEXE F MODEL DESCRIBING THE EFFECT OF RAINFALL EXCLUSION ON FINE ROOT STANDING CROP ... 54
ANNEXE G EFFECT OF MICROTOPOGRAPHY AND SPECIES ON THE SRL OF FINE ROOT PRODUCTION AND STANDING CROP ... 55
LISTE DES FIGURES
Figure Page
l.I Vulnérabilité des arbres à la sécheresse à 1 'échelle de 1 'individu ... 4
1.2 Deux mécanismes sous-jacents de la mortalité des arbres par la sécheresse,
tiré de McDowell et al. (2008)... 5
2.1 Location ofthe I6 sampling sites in the study area, Vallée-du-Haut-Saint-Laurent, Quebec, Canada... 20
2.2 Experimental set up of the growth chmnber installed at the base of each tree to measure fine root daily production .. .. .. .. .. .. .. .. .. .. .. .. .. .. .. .. .. .. .. .. .. .. .. .. .. 23
2.3 Differences in the soil a) clay content, b) stone content, c) soil water content (m3·m-3) and d) soil waterpotential (kPa) ofpits and mounds. The diamond is the mean, the central line is the median, edges of the box represent the interquartile range, whiskers represent extreme values that are not considered outliers and points represent outliers ... 27
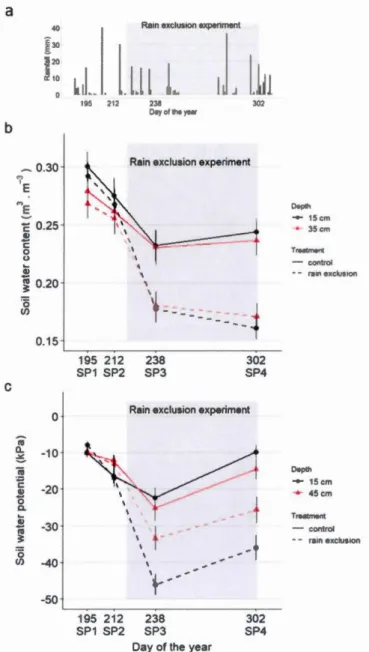
2.4 a) Daily precipitation at the nearest meteorological station during the study period and changes in b) soil water content and c) soil water potential, with and without rainfall exclusion at the four sampling periods (SPI, SP2, SP3 and SP4, represented by the median day of year) ... 30
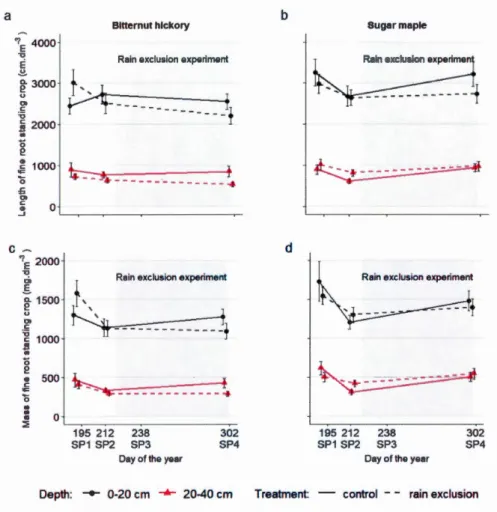
2.5 A vera ge length and mass of the fine root standing crop for bitternut hickory ( a,c) and sugar maple (b,d) with and without rainfall exclusion at 0-20 cm and 20-40 cm deep at the four sampling periods (SPI, SP2, SP3 and SP4, represented by the median day of year). The shaded area represents the period when rainfall exclusion was performed. Error bars represent the standard error. No data for SP3. ... 3I
2.6 a) Length and b) mass of the fine root daily production at four depths (0-1 0, (0-10-20, 20-30, 30-40 cm) and c) length and d) mass of the fine root standing crop at two depths (0-20 and 20-40 cm) in pits and mounds. Error
bars represent the standard errors ... 34
2.7 a) Length and b) mass of the fine root daily production at four depths (0-1 0, (0-10-20, 20-30, 30-40 cm) and c) length and d) mass of the fine root standing crop at two depths (0-20 and 20-40 cm) for sugar maple and bitternut hickory. Error bars represent the standard errors ... 36
LISTE DES TABLEAUX
Tableau
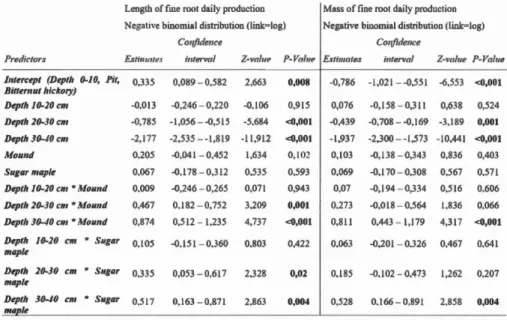
2.1 Generalized linear mixed madel describing the length (cm·dm-2·d-1) and mass (mg·dm-2·d-1) of the fine root daily production as a function of soil depth (0-1 0, 10-20, 20-30 and 30-40 cm), tree species (sugar maple and
Page
bitternut hickory), and microtopography (pit and mound) ... 33 2.2 Generalized linear mixed model describing the length (cm·dm-3) and mass
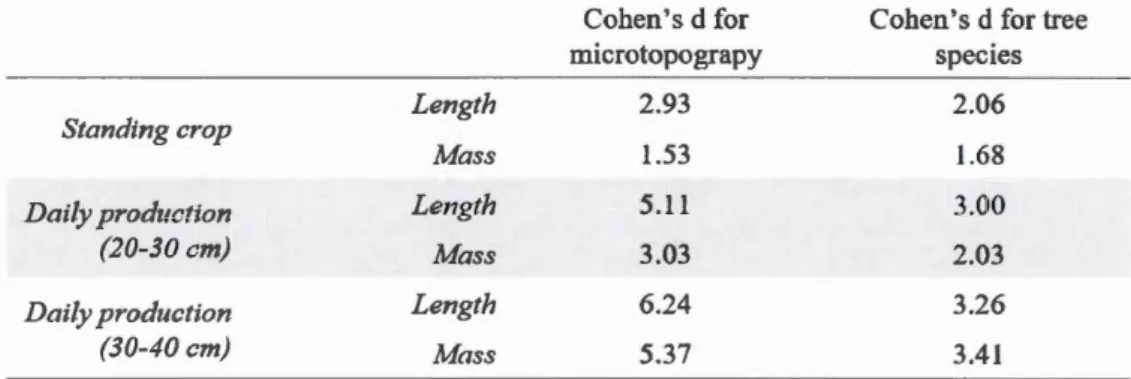
(mg·dm-3) of the fine root standing crop as a function of depth (0-20, and 20-40 cm), tree species (sugar maple and bitternut hickory) and microtopography (pit and mound) ... 33 2.3 Effect size of microtopography and tree species on the fine root standing
crop and daily production using Cohen's d estimate... 37 2.4 Summary of the effect of microtopography, tree species and rainfall
exclusion on the fine root system. The letter ( d) indicates a depth dependent relationship and thus an influence on root vertical distribution. 39
CAC Caryer cordiforme (Carya cordiformis) DOY Jour de l'année(« Day ofyear »)
ERS Érable à sucre (Acer saccharum)
SP Période de récolte(« Sampling Period »)
SRL Longueur racinaire spécifique(« Specifie Root Length »)
RÉSUMÉ
À l'échelle globale, l'intensité et la durée des sécheresses sont amenées à augmenter avec les changements climatiques, favorisant 1 'apparition de stress hydrique, 1 'un des principaux facteurs de mortalité des forêts. Les études sur la réponse des arbres à la sécheresse se concentrent principalement sur les parties aériennes et peu sur les parties souterraines, bien que les racines assurent la fonction vitale du prélèvement en eau. Dans 1 'optique de mieux comprendre la vulnérabilité des arbres à la sécheresse, ce projet vise à déterminer 1 'effet de la microtopographie et de la disponibilité en eau sur les racines fines d'arbres matures en forêt tempérée. Nous avons étudié 1) comment la microtopographie influence la croissance (production et biomasse), la distribution verticale et la morphologie (longueur racinaire spécifique) des racines fines de deux espèces d'arbres en n1ilieu naturel et 2) comment ces traits racinaires répondent à une expérience d'assèchement. Pour ce faire, les racines fines de deux espèces représentatives de la Vallée-du-Haut-Saint-Laurent, l'érable à sucre et le caryer cordiforme, ont été récoltées sur des arbres en position microtopographique de monticule et de creux, pendant cinq mois en 2017. La moitié des arbres ont été soumis
à une expérience d'exclusion des précipitations à partir du mois d'août. Des données sur la production et la biomasse en racines fines à différentes profondeurs ont été obtenues respectivement à 1' aide de chambres de croissance et de carottes de sol. Pour les deux espèces, la production en racines fines en profondeur (20-40 cm) et la biomasse racinaire étaient significativement plus faibles en creux qu'en monticule,
avec une différence de longueur moyenne observée de 43% et 16% respectivement. L'érable à sucre a produit significativement plus de racines en profondeur que le caryer cordiforme avec une différence de longueur moyenne observée de 42%. La microtopographie avait toutefois un effet plus important que 1' espèce sur la longueur de biomasse globale et sur la production de racines fines en profondeur. L'exclusion des précipitations n'a pas eu d'effet sur la production et a conduit à une faible diminution de la biomasse globale. Ces résultats illustrent 1' acclimatation différentiée du système racinaire des arbres face à la microtopographie, avec un système racinaire plus développé pour les arbres de monticules que pour les arbres de creux, ce qui pourrait jouer un rôle crucial dans leur réponse à la sécheresse.
Mots-clés : racines fines, microtopographie, sécheresse, Acer saccharum, Carya cordiformis.
INTRODUCTION GÉNÉRALE
1.1 Problématique
Depuis quelques décennies, les conditions climatiques à l'échelle du globe connaissent
de nombreux changements en raison de l'augn1entation de la concentration des gaz à
effet de serre. Les projections des modèles climatiques montrent que les évènements extrêmes tendent à être plus fréquents, plus intenses et de plus longue durée, dans de
nombreuses régions du monde (Groupe d'experts intergouvernemental sur l'évolution
du climat et al., 2013), le sud du Québec n'y faisant pas exception (Ouranos, 2015). À 1 'échelle globale, 1' intensité et la durée des sécheresses sont amenées à augmenter avec les changements climatiques (Trenberth et al., 2013). Plusieurs définitions du terme sécheresse existent selon le champ d'intérêt, mais de manière générale, celle-ci correspond à une période aux conditions météorologiques plus sèches que la normale (Van Loon, 20 15). Les températures moyennes au Québec ont augmenté de 1 à 3
oc
entre 1950 et 2011 et la tendance se poursuit (Ouranos, 2015). Dans le sud de la province, les scénarios climatiques projettent des conditions plus sèches pendant l'été (Ouranos, 2015), avec une réduction de 20 à 40% de l'humidité du sol à l'horizon 2080 (Houle et al., 20 12). Cette réduction est entre autres occasionnée par un prélèvement accru en eau par la végétation, causé par l'allongement de la saison de croissance (Logan et al., 2011) et l'augmentation de la demande évaporative de l'atmosphère en2
Les événements de sécheresse peuvent entraîner des conditions de stress hydrique chez les plantes, lequel a été identifié comme un des principaux facteurs explicatifs du déclin global des forêts (Allen et al., 201 0). Un arbre connaît un stress hydrique lorsque la quantité d'eau disponible dans le sol devient insuffisante au maintien de ses activités métaboliques. Au Canada, ces conditions de stress ont été associées à une croissance réduite et une mortalité accrue dans la forêt boréale (Hogg et al., 2002 ; Huang et al., 2010; Peng et al., 2011). L'impact du stress hydrique sur la forêt tetnpérée canadienne n'a pas été documenté jusqu'à maintenant, mais des études ont fait état des effets délétères de la sécheresse sur la forêt tempérée européenne et nord-américaine (Bréda et al., 2006 ; Martin-Benito et Pederson, 20 15). Le risque de mortalité accrue des arbres face à la sécheresse est une source d'inquiétude sur les plans économiques, sociaux et environnementaux. Il devient donc important de mieux comprendre comment réagiront les écosystèmes forestiers aux conditions futures auxquelles ils seront exposés, ainsi que le rôle que joueront les différents facteurs abiotiques et biotiques. De telles connaissances favoriseront une gestion territoriale pouvant inclure des mesures d'adaptation tant du point de vue de 1' aménagement forestier que de la conservation
des écosystèmes. Cependant, étudier la vulnérabilité des forêts est complexe et
comporte plusieurs défis. La compréhension des phénomènes de déclin à 1' échelle du
paysage passe en tout premier lieu par une compréhension à 1 'échelle de 1' individu.
1.2 Mécanismes de mortalité des arbres
Différents facteurs prédisposent les arbres d'un peuplement à la vulnérabilité à la sécheresse : les facteurs d'exposition et les facteurs de sensibilité (Figure 1.1 ). Dans le cadre de ce projet, la sensibilité dépend des facteurs propres à l'espèce tandis que les
facteurs d'expositions sont des facteurs liés à l'environnement de développement (site)
et ses fluctuations dans le temps (aléas). La combinaison des facteurs de sensibilité et
à cet impact variera selon la capacité d'adaptation de l'individu, qui comprend sa plasticité phénotypique et la variabilité génétique intraspécifique.
Factem·s d'exposition Impacts Facteurs de sensibilité Capacité d'adaptation
Figure 1.1. Vulnérabilité des arbres à la sécheresse à l'échelle de l'individu.
Les arbres peuvent répondre différemment à des conditions de stress hydrique, notamment en ce qui concerne le fonctionnement hydraulique et le contrôle des stomates (Aubin et al., 2007 ; Bréda et al., 2006). En situation de sécheresse, le fort lien entre la petite quantité d'eau restante et les particules de sol ainsi que la forte demande évaporative accentue la baisse de potentiel hydrique au sein de la plante. Si 1 'eau dans les vaisseaux est soumise à une tension trop importante, cela peut entraîner un phénomène de cavitation, parfois fatal pour l'arbre (Brodersen et al., 2013; Cochard et al., 2002). Afin de minimiser le risque de cavitation, l'arbre peut fermer ses stomates. Cependant, cela limite ensuite les échanges de gaz et l'acquisition de C02 indispensable à la photosynthèse ce qui entraîne une carence en carbone. L'arbre doit alors arriver à un compromis entre minimiser le risque de cavitation et obtenir le C02 nécessaire à son développement (Simonneau et al., 2014). Face à ce compromis, les espèces peuvent adopter un caractère isohydrique ou anisohydrique. Le caractère isohydrique consiste en une fermeture rapide des stomates face à un stress hydrique afin de conserver le potentiel hydrique du xylème constant. Un caractère anisohydrique consiste à tnaintenir les stomates ouverts malgré la baisse du potentiel hydrique afin de privilégier la photosynthèse (Lovisolo et al., 201 0). Une espèce donnée peut également
4 jongler entre ces caractères (Klein, 2014 ). La mortalité des arbres est raretnent induite par un bref épisode de sécheresse (Nishimura et al., 2007), mais, de manière générale, on associe une sécheresse de longue durée à des mortalités par carence en carbone, et
une sécheresse très intense à des mortalités par embolie (Aubin et al., 2007 ; McDowell
et al., 2008) (Figure 1.2). Faible 1 Intensité du stress hydrique Fort
Court Durée du stress hydrique
Agents b;ot;ques
\
---.
1 Amplification+
Défaillance hydJ·ique1
+
Long "" ... -Carence en carboneFigure 1.2: Deux mécanismes sous-jacents de la mortalité des arbres par la sécheresse, tiré de McDowell et al. (2008).
Les sécheresses peuvent également affecter indirectement les forêts en les rendant plus susceptibles à des attaques par les pathogènes et les insectes (Anderegg et al., 2015 ; McDowell et al., 2008 ; Mill ar et Stephenson, 20 15).
1.3 Facteurs de sensibilité à la sécheresse
Dépendamment de l'espèce à laquelle ils appartiennent, les arbres présentent des traits propres qui les rendent plus ou moins sensibles au stress hydrique. Les études mettent en évidence deux grandes stratégies mises en place par les espèces pour lutter contre la
sécheresse: tolérer ou éviter le stress hydrique (Brunner et al., 2015). Les espèces plus tolérantes au stress ont la capacité de synthétiser des solutés et protéines afin de diminuer leur potentiel osmotique et maintenir une turgescence des tissus alors que l'eau est limitée (Claeys et Inze, 2013). Les espèces privilégiant les stratégies d'évitement équilibrent leurs pertes et leurs apports en eau. La limitation des pertes peut se faire par une fermeture contrôlée des stomates et une utilisation interne de 1 'eau plus efficace (Aubin et al., 2016). L'augmentation des apports en eau nécessite une optimisation du prélèvement par les racines. Ainsi, les espèces avec un ratio de biomasse hypogée vs épigée plus important et des racines plus profondes présentent une plus forte résistance à la sécheresse (Kozlowski et Pallardy, 2002). Enfin, face à des sécheresses prolongées, le stockage de carbone non structurel chez certaines espèces est un véritable atout pour prévenir la mortalité par carence en carbone (O'Brien et al., 2014). L'utilisation seule des traits d'une espèce, souvent mesurés dans
des conditions environnementales spécifiques, ne permet pas de prédire avec exactitude
la réponse de l'espèce dans des conditions différentes (Albert et al., 2011). En effet la variation intraspécifique est à considérer et est peu étudiée dans la littérature (Albert et al., 2011 ). Ce biais limite ainsi la compréhension des réponses des individus aux conditions de stress hydrique.
1.4 Facteurs d'exposition à la sécheresse
Les espèces présentent des traits propres qui leur permettent de répondre différemment à des périodes de sécheresse, mais la vulnérabilité d'un individu à la sécheresse varie fortement selon les conditions de sites (Abrams et al., 1998). Les caractéristiques
granulométriques du sol et les facteurs physiographiques, cmnme la microtopographie,
conditionnent fortement 1' exposition des arbres à la sécheresse par leur influence sur
la disponibilité en eau du sol ainsi que sur les phénomènes d'évapotranspiration (Calvet,
2003). Le potentiel matriciel du sol est fortement lié à la texture puisque, selon la taille des particules de sol, la liaison avec les molécules d'eau sera plus ou moins forte (Wang
r
6 et al., 2009). En effet, la liaison des molécules d'eau avec des particules grossières,
comme le sable, est moins forte qu'avec des particules fines, comme l'argile. Ainsi, un sol sableux facilite le drainage et a une faible capacité de rétention de l'eau. Au contraire, un sol argileux peut emmagasiner de plus grandes quantités d'eau, mais une plus grande partie demeure inaccessible pour les plantes en raison des fortes liaisons avec les particules de sol (Wang et al., 2009). La tnicrotopographie, c'est-à-dire la topographie à une échelle fine, a aussi une influence sur la disponibilité en eau dans le sol. Elle se caractérise par la présence d'élévations, des monticules, et de dépressions,
des creux, de petites amplitudes. L'humidité du sol est inversement corrélée à l'élévation du terrain à faible échelle (Born et al., 2015 ; Simmons et al., 2011). Cette plus faible disponibilité en eau pour les plantes dans les zones de monticules pourrait occasionner un stress hydrique accru à cette position microtopographique. L'étude de ces facteurs sur le stress hydrique en milieu naturel comporte une difficulté importante puisqu'ils covarient souvent ensembles. Par exemple, la concentration des sols en argile est généralement plus importante dans les zones sans pente ou avec une topographie concave, menant ainsi à la formation de cuvettes d'accumulation d'eau (Brubaker et al., 1993). De plus, d'un point de vue topographique, les zones de bas de pente présentent généralement des sols d'épaisseur plus importante que les zones de pente ou de haut de pente, et sont plus concentrées en éléments fins (Brubaker et al.,
1993 ; Enoki et al., 1996).
1.5 Acclimatation du système racinaire aux conditions de site
Dans une forêt, les propriétés du sol, de microclimat et de la microtopographie sont très variables à une échelle fine. Les plantes peuvent mettre en place différentes stratégies de développement pour exploiter localetnent cette hétérogénéité et diminuer le risque de stress. Le système racinai re en particulier peut faire preuve d'une grande plasticité dans le moment de sa croissance, sa densité et sa capacité d'absorption (Meier et Leuschner, 2008b ). Ainsi, la plasticité phénotypique des racines permet à des arbres
d'une même espèce, soumis à des conditions climatiques identiques, de présenter des systèmes racinaires différents selon leur position microtopographique et leur accès à l'eau (Fan et al., 2017; Guevara et al., 2010). En effet, il a été maintes fois observé que le ratio de biomasse hypogée vs épigée (root to shoot ratio en anglais) change en fonction de la fertilité et de la disponibilité en eau du sol (Bloom et al., 1985) et donc indirectetnent avec la microtopographie (Anschlag et al., 2008 ; Enoki et al., 1996).
Bien que la littérature soit assez pauvre quant aux données racinaires, comparativement à ce qu'elle fournit sur les organes aériens, certains consensus émergent quant à la distribution, la production et la biomasse racinaire. La fertilité du sol joue un rôle important vis-à-vis de la biomasse racinaire des arbres. Des études en forêt tempérée ont montré une relation négative entre la fertilité du sol (estimée par l'azote disponible) et la biomasse racinaire (Keyes et Grier, 1981 ; Vogt et al., 1987). Différentes études ont montré que l'ajout de nutriments, tels que l'azote, le phosphore, le potassium, le calcium et le magnésium, stimule la croissance racinaire des arbres (Fahey et Hughes, 1994 ; Pregitzer et al., 1993 ). La réponse des arbres à la fertilisation varie toutefois selon 1 'espèce (Leuschner et al., 2004 ). La distribution des racines varie également selon la profondeur, la structure et la texture du sol (Bréda et al., 1995 ; Lucot et Bruckert, 1992). Les racines fines sont le centre d'intérêt étant donné que c'est à ce niveau que s'effectue le prélèvement en eau (avec l'aide de la symbiose avec les champignons mycorhiziens) et de nombreux articles démontrent qu'en forêt feuillue tempérée leur densité diminue en fonction de la profondeur (Bédéneau et Auclair, 1989;
Bouten et al., 1992 ; Bréda et al., 1995 ; Lucot et Bruckert, 1992) à partir d'une profondeur de 20 cm (Lucot et Bruckert, 1992). De plus, Bréda et al. (1995) ont montré que la distribution racinaire était latéralement homogène dans le premier mètre de profondeur de sol, dans une couronne de trois mètres autour du tronc dans le cas d'un peuplement de chênes en Europe. La densité de racines dans chaque couche de sol est inversement corrélée avec la stabilité structurale (i.e. sensibilité des sols à 1' érosion hydrique), qui dépend fortement de la concentration en argile (Bréda et al., 1995). En
8 effet, les racines ne peuvent pas pénétrer dans un sol trop dense et ainsi, dans le cas de sols argileux, la pénétration racinaire est presque inexistante (Veihmeyer et Hendrickson, 1948). Une accumulation de racines peut alors s'observer généralement
juste au-dessus de la couche argileuse (Bouten et al., 1992). On peut donc s'attendre à
ce que la densité racinaire soit plus importante en position de monticules où les sols sont moins argileux et la stabilité structurale est moindre. La production en racines fines a lieu tout au long de saison de croissance et est un phénomène très variable avec les années, car elle dépend fortement des caractéristiques de sol, mais ne semble pas présenter un patron de réponses clair aux fluctuations climatiques de températures et précipitations (Côté et al., 1998). Au cours d'une année, un à deux pics majeurs de production sont souvent observés. Dans le cas d'un seul pic, celui-ci s'observe au printemps ou à 1' été. Dans le cas de deux pics, le premier apparaît au printemps et le
second à la fin de l'été ou à l'automne (Santantonio et Hermann, 1985). En termes de
biomasse, la grande importance des racines fines dans le prélèvement de 1 'eau s'illustre
par Je fait que 81 % du total de la biomasse racinaire se compose de racines de moins
de deux millimètres de diamètre (considéré comme le diamètre maximum pour les racines fines dans la plupart des articles) (Bréda et al., 1995). En moyenne, la biomasse en racine fine est plus importante sur les monticules ce qui illustrerait la plasticité
morphologique de l'espèce à exploiter l'hétérogénéité de l'environnement comme
suggéré par Enoki et al. (1996). La différence de biomasse racinaire entre creux et monticules est exacerbée par une nappe phréatique généralement très haute à la sortie du printemps qui limite le développement racinaire en profondeur dans les positions de creux. Les racines se développent peu et se concentrent en surface afin d'éviter la zone d'anoxie (absence de dioxygène) (Fan et al., 2017).
1.6 Réponse du système racinaire à une sécheresse
Beaucoup d'études ont été menées pour tenter de comprendre la réponse des arbres à la sécheresse. Encore une fois, ces études ont pour la plupart porté sur les parties
aériennes de 1' arbre, mais peu sur les parties souterraines, bien que les prélèvements
d'eau soient effectués au niveau racinaire. De plus, les conditions de site, telles que la
topographie, sont rarement prises en compte dans l'étude de la réponse à la sécheresse.
Pour comprendre les défis d'acclimatation de l'appareil racinaire en situation de stress
hydrique, il est important pour commencer de bien comprendre comment la
disponibilité en eau varie dans les sols. L'eau est plus disponible en surface qu'en
profondeur au début de la saison de croissance due à la recharge printanière. Plus tard
dans la saison de végétation, alors que le sol devient plus sec, le prélèvement en eau se
fait de plus en plus profondément (Bréda et al., 1995 ; Nepstad et al., 1994). Lors de
sécheresse, le compartiment le plus profond devient alors la zone de prélèvement la
plus importante alors que la densité en racine y est plus faible (Bréda et al., 1995 ;
Rambal, 1984). C'est pourquoi les jeunes plantes au système racinaire peu développé
en profondeur sont souvent exposées à une défaillance hydrique (Luo et Chen, 2013 ;
Sparks et Black, 1999).
Les arbres ont développé des stratégies d'évitement au niveau racinaire pour faire face
au stress hydrique. Lorsque l'on aborde la question de stratégie d' évite1nent du stress
hydrique, il est important de bien distinguer les réponses d'un système racinaire adapté
à un climat aride (où les périodes de faible disponibilité en eau sont récurrentes) et les réponses à une sécheresse (au cours desquelles la disponibilité en eau diminue de façon
imprévue sous la normale). En effet, les arbres en zone aride ont évolué afin de
privilégier le prélèvement en eau par rapport à la captation de la lumière. Ils présentent alors généralement un ratio de biomasse hypogée vs épigée plus important et un système racinaire plus développé en profondeur que les arbres de zone plus tempérée
avec une distribution plus ou moins égale des précipitations dans l'année (Choat et al.,
2012 ; Hartmann, 2011 ). De manière similaire, les arbres en zone aride ont
généralement une plus forte longueur racinaire spécifique (SRL, ratio de longueur sur
la masse sèche de racines fines) que les arbres en milieu tempéré, ce qui traduit un
10
et al., 2012). La réponse à une sécheresse occasionnelle en cli1nat tempéré est différente
et consiste à des modifications rapides dans la distribution, la croissance et la
morphologie des racines fines. Du point de vue de la distribution verticale, les études
ont montré un développement des racines en profondeur en réponse à un stress
hydrique en milieu tempéré (Joslin et Wolfe, 2003 ; Persson et al., 1995 ; Torreano et
Morris, 1998). Du point de vue de la croissance et de l'accumulation de bimnasse, le
ratio de biomasse hypogée vs épigée tend à augmenter lors de conditions de sécheresse
(Aspelmeier et Leuschner, 2006; Zang et al., 2014) bien que cette dernière entraîne en
termes absolus une diminution de biomasse en racines fines (Anderegg, 2012 ;
Chenlemuge et al., 2013 ; Gaul et al., 2008 ; Hertel et al., 2013). Sous des conditions
de stress modéré, la production en racines fines est stimulée pour augmenter 1' efficacité
du prélèvement en eau (Gaul et al., 2008 ; Leuschner et al., 2001 ; Meier et Leuschner,
2008a ; Zang et al., 2014). Cependant, quand le stress s'intensifie, cette production
diminue et finit par cesser (Konôpka et al., 2007 ; Meier et Leuschner, 2008b ; Zang et
al., 2014). Enfin, d'un point de vue morphologique, les sécheresses occasionnelles ne semblent pas impacter le SRL (Hertel et al., 2013 ; Meier et Leuschner, 2008b ;
Ostonen et al., 2007). Enfin, il est important de ne pas étudier séparément les traits racinaires, propres à 1 'espèce, et les caractéristiques environnementales dans une étude de vulnérabilité à la sécheresse. C'est en étudiant leurs interactions qu'il sera possible d'évaluer les avantages que les traits confèrent réellement aux arbres afin de lutter contre le stress hydrique.
1. 7 Objectif de 1' étude
Face à la sécheresse, la position microtopographique de creux offre un plus fort taux
d'humidité du sol et apparaît comme un micro-refuge hydrique pour les arbres (Born
et al., 2015; McLaughlin et al., 2017). Toutefois, des taux de mortalité des arbres plus élevés ont été observés dans les dépressions que sur des élévations (Simmons et al.,
les couches superficielles du sol. La faible densité racinaire en profondeur pourrait ainsi rendre les arbres de creux plus vulnérables à des épisodes de sécheresse que les arbres de monticules. Dans l'optique de mieux comprendre la vulnérabilité des arbres à la sécheresse, ce projet vise à déterminer l'effet de la microtopographie et de la disponibilité en eau sur les racines fines d'arbres matures en forêt tempérée.
Authors
CHAPITRE II
TREE FINE ROOT PRODUCTION AND STANDING CROP DIFFER ACCORDING TO MICROTOPOGRAPHY
Florence Tauc 1, Angélique Du puch
1,
Daniel Houle2'3, Frédérik Do yon 1, AudreyMaheu1
1
Institut des sciences de la forêt tempérée, Université du Québec en Outaouais, Ripon, QC, Canada
2 Ministère des Forêts, de la Faune et des Parcs, Québec, QC
Abstract
Water stress is one of the primary drivers of forest mortality at the global scale and with climate change, an increase in drought duration and severity is expected. Given the challenge of in situ root measurements, ecological processes in the rhizosphere have been much less studied than aboveground processes, even though they play a crucial role in the response of trees to drought. Environmental factors at a very local lev el,
such as microtopography, may exert a strong influence on soil water availability during the growing season, but how these factors affect in turn fine root development, and th us the sensitivity of trees to drought, remains, po orly known. W e studied 1) how microtopography influences fine root growth (standing crop and daily production),
vertical distribution and morphology (specifie root length) for two tree species in natural forest stands and 2) how these root traits respond to water limitations. We replicated an experiment in 16 sites in the temperate forest of southern Quebec, Canada,
where four sugar maple (Ac er saccharum) and four bitternut hickory (Carya
cordiformis) mature trees were selected in each site, half in pits and half in mounds. To
simulate drought conditions, we performed a rainfall exclusion with plastic covers at half of the sampled trees for three months. W e used growth chambers to monitor fine root daily production at the base of each tree through the summer of 2017 and we used soil cores to measure the fine root standing crop. For both species, the fine root production in the deeper soillayer (20-40 cm) and the standing crop were significantly lower in pits than in mounds, with respectively a 43% and 16% reduction in terms of observed length. Sugar maple produced significantly more fine roots in the deeper soil layer (20-40 cm) than bitternut hickory, with a 42% difference between the two species in terms of length. While effect sizes of tree species and microtopography were both important, microtopography had a greater influence on the overall standing crop length and the fine root production at deep soil layers. The water exclusion experiment did not affect fine root production and led to a slight reduction in the standing crop, despite a moderate but statistically significant reduction in soil water content and potential. These results highlight the distinct acclimation of the fine root system of trees to microtopography, which could play a crucial role regarding the response of trees to drought.
Keywords: fine root daily production, fine root standing crop, microtopography,
rainfall exclusion, temperate forests, fine root growth cham ber, Acer saccharum, Carya cordiformis.
14
2.1 Introduction
Drought severity and duration are projected to increase with climate change at the global scale. Although methodological issues still need to be addressed to enhance our level of confidence in projections in regards to droughts (Seneviratne et al., 2012 ;
Trenberth et al., 2013), an increase in dry conditions is expected in many regions of the world, including North America (Dirmeyer et al., 2013 ; Houle et al., 2012). Soil moisture drought, defined as a deficit in the root-zone soi] moisture (Van Loon, 2015), has led to increased mortality and reduced growth for trees of boreal (Peng et al., 2011) and temperate forests (Bréda et al., 2006 ; Brzostek et al., 2014 ; Martin-Benito and Pederson, 2015). Climatic scenarios point towards an intensification ofthe problem in coming years (Charney et al., 2016; Girardin et al., 2016). As a result, there has been growing research to understand ecological processes controlling drought sensitivity in order to inform forestry adaptation strategies (Chaves et al., 2003 ; D'Orangeville et
al., 2018; Hamanishi and Campbell, 2011 ; Phillips et al., 2016).
The fine root system is responsible for water and nutrient uptake and is a key determinant of the drought sensitivity of trees (Phillips et al., 2016). This sensitivity can be described as the short-term physiological response of trees to drought. While recent work has helped elucidate aboveground factors influencing drought sensitivity
(Hoffmann et al., 2011 ; McDowell et al., 2008), belowground factors have been much
Jess studied given challenges associated with root measurements in the field. Studies have highlighted two main strategies that trees have developed to avoid damage to cellular functions wh en facing water limitations: 1) tolerate dehydration and 2) a void stress from low water potentials (Brunner et al., 20 15). On the one hand, trees adopting a drought tolerance strate gy develop protective solutes and proteins to decrease osmotic potential of cells and maintain turgor in water-limited conditions (Claeys and Inze, 2013 ). On the other hand, trees adopting a drought avoidance strate gy act to balance water Joss and uptake by the tree, either by reducing water ]osses through stomatal
closure or by enhancing water uptake through roots. The present study focuses on the root system and the role it could play in a drought avoidance strategy.
When assessing drought avoidance mechanisms, a clear distinction should be made between the response to arid climatic conditions vs. unpredictable drought events. Under an arid climate, trees have evolved to prioritize water uptake over light interception and th us generally have higher root-to-shoot ratios and deeper root systems than species adapted to temperate conditions (Allen et al., 2010; W. Chen et al., 2013 ; Choat et al., 2012; Comas et al., 2012; Hartmann, 2011 ; West et al., 2012). Vegetation growing under a water-litnited climate also evolved to a greater specifie root length (SRL, ratio of fine root length to dry mass) (Brunner et al., 2015; W. Chen et al., 2013; Comas et al., 2012, 20 13). Indeed, the SRL describes the trade-off between resource acquisition and conservation (Weemstra et al., 20 16) as a large SRL favars resource acquisition by increasing the volume of soil explored and the surface area of roots in contact with the soil. Under a temperate climate, droughts are unpredictable events and the response of vegetation goes through short-term modifications of the growth (standing crop and production), morphology (SRL) and vertical distribution of the fine root system. In terms of vertical distribution, an expansion of the root system towards deeper soil horizons has been observed for trees growing under a temperate climate and subject to water limitations (Joslin and Wolfe, 2003 ; Persson et al., 1995 ; Torreano and Morris, 1998). In terms of growth, research shows that drought triggers a shift in resource allocation that favars roots rather than shoots in trees. The root-to-shoot ratio tends to increase when facing water limitations (Aspelmeier and Leuschner, 2006 ; Zang et al., 2014) although drought still causes a reduction in the fine root biomass oftrees (Anderegg, 2012 ; Chenlemuge et al., 2013 ; Gaul et al., 2008; Hertel et al., 20 13). Un der mode rate water limitations, fine root production generally increases as young roots are more efficient at water uptake (Gaul et al., 2008 ; Leuschner et al., 2001 ; Meier and Leuschner, 2008a ; Zang et al., 2014). As the water limitations become severe, fine root production decreases and ultimately stops (Konôpka et al.,
16 2007 ; Meier and Leuschner, 2008b ; Zang et al., 2014). In terms of morphology, the SRL appears relatively insensitive to drought (Hertel et al., 2013 ; Meier and Leuschner,
2008b ; Ostonen et al., 2007) although insight from arid ecosystems suggests that water
limitations favor a higher SRL.
Environmental factors controlling soil water availability exert a strong influence on the sensitivity of trees to drought, with recent work suggesting that local site conditions have a greater impact than species on the response oftrees (D'Orangeville et al., 2018; Martin-Benito and Pederson, 2015). For example, soil moisture conditions prevailed over species-specific differences to exp lain variations in the drought resistance of trees
at the continental scale (Gazol et al., 2017). Environmental factors also play a key role
on root development, thus also affecting the sensitivity of trees to drought. In fact,
Weemstra et al. (2016) have argued that a root-economic spectrum is ill-suited to
understand root trait coordination and instead, they proposed a multidimensional root
trait framework that takes into account environmental constraints on root development such as water and nutrient availability as well as soil chemistry and structure. In forests,
environmental factors such as soil properties, microclimates and microtopography vary
widely at small scale (J. Chen et al., 1999), thus having the potential to influence root
development. However, we still lack a clear understanding of how these site
characteristics shape root development and influence drought sensitivity. For example,
microtopography locally influences soil moisture in forests and mounds (i.e. small-scale topographie elevations with a convex shape) are generally drier th an pits (i.e.
small-scale topographie depressions with a concave shape). Indeed, mounds are
generally made up of soil of a smaller partie le size than pits (Fan et al., 20 17), which reduces the soil's water retention capacity. Additionally, the slope of mounds favors drainage (Wang et al., 2009) which also limit soil water retention. Microtopography influence on seedling establishtnent has long been studied (Anschlag et al., 2008 ; Born et al., 2015 ; Cornett et al., 1997 ; Messier and Kimmins, 1992) but very little information is available on its influence on the root development of mature trees.
The objectives of this research are to understand 1) how microtopography influences fine root growth vertical distribution and morphology for bitternut hickory ( Carya cordiformis) and sugar maple (Acer saccharum), two North American temperate tree species and 2) how these root properties respond to drought.
(1) Given its influence on soil moi sture, we hypothesize that microtopography will influence the fine root system of trees. On the one hand, we expect that mounds, with a convex microtopography that favars drainage, will have a lower water availability than pits during the growing season. On the other hand, we expect trees in mounds to have a more extensive fine root system (larger daily production, larger standing crop, larger SRL, greater rooting depth) than in pits. This would illustrate different acclimations of the fine root system to micro-environmental conditions, that could potentially reduce the vulnerability to drought by enabling trees in mounds to avoid water deficits.
(2) W e hypothesize that water stress will lead to an overall reduction of the fine root daily production and standing crop oftrees. Based on hypothesis 1, we expect a larger reduction in pits than in mounds given that trees in mounds are better prepared to face water limitations with their more extensive root system than pits.
2.2 Materials and methods
2.2.1 Study area
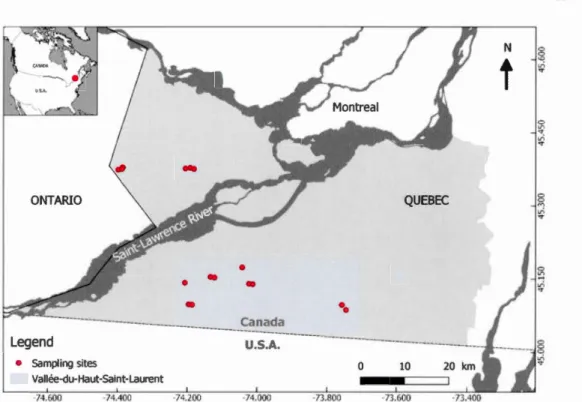
This study took place in the region of Vallée-du-Haut-Saint-Laurent in southern Quebec, Canada (Fig. 2.1). In proximity to the Saint-Lawrence River, a wide plain is found with a maximum elevation of 40 rn and going further inland, two small hills, Covey Hill (343 m) and Rigaud (220 rn), can be found. The natural bedrock of the region is mainly composed of dolomitic complexes and sandstone. The area close to the Saint-Lawrence River is covered by marine deposits and they are replaced by
18 morainal deposits as the distance from the river increases (Delage and Gangloff, 2007 ;
Gagné, 2010 ; Meilleur et al., 1992, 1994 ). The area has been highly impacted by
human activities sin ce the beginning of the 19th century and it resulted in a fragmented landscape (Bouchard and Domon, 1997 ; Meilleur et al., 1992). Agriculture prevails in the region (53% of land cover), with isolated forest patches scattered across the landscape (26% of land cover). The region is part of the sugar maple-hickory bioclimatic domain (Grandtner, 1966) and forests are mainly composed of hardwood and mixed stands (56% and 25% respectively) (Gagné, 2010). The region is characterized by a humid continental climate according to the updated Koppen-Geiger Classification (Peel et al., 2007). The average annual temperature is 6. 7°C (Environment Canada, station 7025745, years 1981-2010) with large variations throughout the year, ranging from an average temperature of -9.3°C in January to 20.9°C in July. Precipitations are evenly distributed throughout the year and the average annual precipitation is 965 mm (17% as snow). In the year 2017, when the study was conducted, the spring was exceptionally wet with rainfall between April and June reaching 382 mm compared to an average of257 over the 1981-2010 period. At the opposite, rainfall recorded in September was relatively low (35 mm) compared to the 1981-2010 average (91 mm). The average temperature from May to November (14.5°C) was relatively similar to the long-term average (14.1 °C) reported in previous years.
Lege nd
• Sampling sites
Vallée-du-Haut-Saint-Laurent
-74.600 -74.400 U.S.A. 0 -74.200 -74.000 N §
t
"'
"<r ~ <t"'
<t 10 -73.600Figure 2.1: Location of the 16 sampling sites in the study area, Vallée-du-Haut-Saint-Laurent, Quebec, Canada.
2.2.2 Experimental design
Our study focused on the fine root system of two deciduous tree species commonly found in the region: the bitternut hickory ( Carya cordiformis) and the sugar maple (Acer saccharum). Sugar maple is the dominant tree species in the study area and is found in association with other species like bitternut hickory (Brisson et al., 1988). We selected 16 sampling plots throughout the study region (Fig. 2.1, AnnexA) in mature forest tracts (patch size >26 ha) with no sign of recent disturbances and a sufficient number oftrees of the two studied species. Study sites had to exhibit a distinct pit-and-mound microtopography. To guide site selection, we assessed microtopographic patterns using a map of the topographie position index (TPI). The TPI reflects the mean difference in elevation between a focal point (the cell center) and the points at the end of equidistant radii. That map was obtained using a fine scale (resolution= 50 cm)
20 digital elevation model derived from LiDAR data and then computing the TPI for each cell. For this computation, we used eight rad ii ( 45° between two adjacent rad ii) of 8 rn long. Sampling plots also had to be located on morainic surficial deposits with moderate soi] drainage. A first list of candidate sites was visited and validated based on species composition and site ecological classification to limit environmental variability. An additional criterion for site selection was ease of access given sites had to be visited numerous times during the summer and a final selection was conducted to retain 16 sites.
At each site, we selected four mature trees (20 cm :S Diameter at Breast Height < 45 cm) for each of the two studied species (sugar maple and bittemut hickory). Half of them were located in pits (small-scale topographie depression, pit depth of about 2 rn) and half of them in mounds (small-scale topographie elevation, minimum mound height of 2 rn). Microtopography has often been studied in the context oftree fall pits and mounds. Instead, in our study, we focused on trees at the top or bottom of small ridges and multiple trees could be found on the same pit or mound. We measured the microtopographic position of trees by calculating the difference in elevation between the base of each tree and six points located at 8 rn from it in six directions ( 60° between two adjacent radii). A positive total of these differences corresponded to a mound position, and inversely, a pit position.
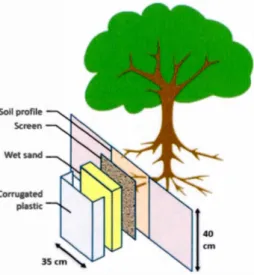
To simulate the effect of drought conditions, we installed a rainfall exclusion deviee on half of the trees for each site. To do so, we followed the method designed by Belien et al. (2012) and we set up transparent polyethylene canvas covering a 3.65 rn radius around each selected tree. During the exclusion deviee installation, we tnade sure to tightly wrap the canvas at 1.2 to 1.5 m high to the trunk, so the stem flow would be intercepted. We tightened the edge of the canvas at different points around the tree to ens ure a stnooth and continuo us flowing surface. W e installed this rainfall exclusion deviee at the end of July 2017 such that it was operational from day ofyear (DOY) 220
to 312. We conducted this experiment under a BACI (Before-After Control Impact) design. This approach let us compare data before and after the impact, using impacted trees paired with control trees (Smith, 2014). Each site was visited four times during the study period, twice before and twice after the rainfall exclusion deviee installation,
to collect data on the fine root system and the soit moisture: the first sampling period spanned from DOY 186 to 205 (median= 195), the second from DOY 206 to 219 (median= 212), the third from DOY 234 to 242 (median= 238) and the fourth from DOY 292 to 312 (median= 302).
We sampled fine roots (defined as roots measuring less than 1 mm in diameter) at the base of each tree to characterize three root traits: growth (measured through the daily production and standing crop), vertical distribution and morphology (measured through the SRL). We measured fine root daily production using in situ growth chambers, also referred to as root ingrowth-core (Addo-Danso et al., 2016), dug in June (DOY 157 to 172). At a distance from the base of the tree equivalent to two thirds of the tree crown,
we dug a 40 cm deep and 60 cm wide cham ber in the ground. W e cleaned and leveled the profile surface of the cham ber that faced the tree and removed ail visible fine roots from it (Fig. 2.2). We installed a 40 cm deep and 35 cm wide fiberglass fly screen (mesh of 1 mm) on the cleaned profile. We then installed a corrugated plastic panel at 2.5 cm from the fly screen and filled the gap between the profile covered with the screen and the corrugated plastic panel with fine wet sand (0.1 mm < diameter <
0.25 mm). This constituted a growth chamber of a volume of3.5 L (40 cm X 35 cm X 2.5 ctn) where fine roots can grow freely. This design was highly inspired by rhizotron technology (Côté et al., 1998), but with a greater collecting surface (area of the screen
= 1400 cm2
). We collected fine roots in the growth chambers twice in 2017, before and after the rainfall exclusion (second and fourth sampling periods). Each time, we collected fine roots at four depths in the cham ber (0-1 0, 10-20, 20-30, 30-40 cm) which provided information about the vertical distribution of fine root daily production.
22
Figure 2.2: Experimental set up of the growth chamber installed at the base of each tree to 1neasure fine root daily production.
To measure the fine root standing crop, we extracted soil cores three times during the
summer: at the first two sampling periods, before the rainfall exclusion, and at the
fourth sampling period, after rainfall exclusion. For each sampling period, we used
cylinders ( diameter
=
5 cm) to collect soil cores at depths of 0-20 cm and 20-40 cm ata distance of2 to 2.5 rn from selected trees. Samples were dried in a forced-air oven at 60°C for 12 hours and then immersed in water to facilitate the separation ofroots from
the soil (Bonzon and Picard, 1969). We then sieved the samples to extract fine roots.
We washed fine roots collected from both protocols (daily production and standing crop) with water and then scanned them between two glass panes at a resolution of 600 dpi. Fine roots were then dried in a forced-air oven at 60°C for 24 hours and
weighted (Mettler Toledo Balance, precision +/-1 mg). We processed scanned images
with the WinRHIZO software (Arsenault et al., 1995) to obtain the length of fine roots.
Using these measurements, we computed the SRL as the ratio between the total length
To quantify the effect of the rainfall exclusion on soil moi sture, we measured the soil volumetrie water content and soil water potential at each of the four sampling periods at fixed locations. For each tree, we measured the soil water content at depths of 15 cm and 3 5 cm at a distance of 1 and 3 rn north and south from the tree base (total of eight measurements per tree per site visit) with a portable soil moisture probe (FieldScout
TDR 100, Spectrum Technologies Inc., precision+/- 0.1 m3·m-3). These measurements
provided information about the amount of water stored in the soil, but not about its
availability to plants, which is better assessed with soil water potential measurements.
Using tensiometers (Irrometer company Inc., model SR, precision +/- 2 kPa), we
measured soil water potential at depths of 15 and 45 cm at each of the four sampling
periods. To do so, we drilled at the beginning of the study, two holes that match length
and diameter oftensiometers in the soil, between the growth chamber and the tree. We
drilled them at approximately 20 ctn from the growth chamber and we covered them
with rocks in-between site visits. For each measurement, tensiometers were left for at
least one hour in the soil to allow the potential to equilibrate between the soil and the
tensiometer. During transportation between sites and trees, the ceramic tip of
tensiometers was subtnerged in water.
When creating the growth chambers, we collected soil samples at depths of 10 and 30 cm, in order to conduct particle size analysis (i.e. two soil samples per tree). For each site, we measured in the laboratory the partie le size distribution of the soil samples poo led per depth and microtopography (i.e. four analyses per site) using the hydrometer
procedure (Kroetsch and Wang, 2008). We evaluated stone content visually at the base
of each tree on the field with a stone content diagram (Rowell, 1994 ).
2.2.3 Statistical analysis
To determine whether the clay content (n = 64) and stone content (n=128) differed between microtopographic positions (pit vs. mo und) and depth (1 0 cm vs. 30 cm; effect
24 a beta distribution (link = logit), which is adapted to analyze response variables expressed as proportions (Ferrari et Cribari-Neto, 2004). The site was included into the model as a random effect to take into account the autocorrelation between trees on the same site. We used a GLMM with a beta distribution (link = logit) for soil water content, and with a negative binomial distribution (link
=
log) for soil water potential, to assess the influence of microtopography (pit vs. mound), tree species (sugar maple vs. bittemut hickory), soil depth and rainfall exclusion (control vs. exclusion) on soil moisture. Given soil water potentials are expressed as negative values, we performed the analysis on absolute values. Given our BACI design, the main effect of rainfall exclusion treatment is of little interest in our model and we evaluated the effect of the rainfall exclusion on soit moisture by assessing the significance of the interaction between the sampling period (SPI, SP2, SP3 and SP4) and the rainfall exclusion treatment. To evaluate if this rainfall exclusion effect is similar betweenmicrotopographic positions, we included the three-way interaction sampling period x
rainfall exclusion treatment x microtopography. For both soil water content and
potential, the tree identifier nested within site nested within date was included as random variables.
W e th en conducted two analyses on the same dataset to answer our two hypotheses about the effect of microtopography and rainfall exclusion on the fine root system. Due to convergence issues, we did not use one model to test the two hypotheses. W e used GLMMs to assess the effect of the rainfall exclusion on the daily production and standing crop variables (fine root length, mass and SRL). We observed over-dispersed frequency distributions for the length (n
=
896) and mass (n=
896) of daily production. As such, we rounded values to the nearest integer and used a negative binomial distribution (link=
log) to analyze these two response variables. When assessing the effect of rainfall exclusion on the daily production, we included the number of days between sampling periods (log transformed) as an offset variable to take the time lapse differences between samplings at each site into account. The offset variable makesmode! adjustments white being constrained to have a regression coefficient of 1 (Hilbe, 2011). We used a GLMM with a gamma distribution (link = log) to describe the SRL (n = 758) of daily production and to describe the length (n = 725), mass (n = 725) and SRL (n = 725) of standing crop. Given our BACI design, we evaluated the effect of the rainfall exclusion by assessing the significance of the interaction between the sampling period and the rainfall exclusion treatment. Moreover, to evaluate if this effect is depth, microtopography or species dependent, we included three-way interactions (sampling period x rainfall exclusion treatment x depth, sampling period x rainfall exclusion treatment x microtopography and sampling period x rainfall exclusion treatment x species). Finally, tree identifier nested within site was included as random variable for ali analyses. W e did not include sampling period as a random variable because it was included as a fixed variable. We evaluated the effect of the microtopography, species and depth on fine root production (length, mass, and SRL) and standing crop (length, mass and SRL) in a different analysis. We used the same distributions than previously. In the models, we included two-way interactions depth x microtopography and depth x species. We included the number of da ys between sampling periods (log transformed) as an offset variable for the tnodels of length and mass of daily production. Tree identifier nested within site nested within sampling period was included as random variable. When microtopography and species significantly influenced fine root production or standing crop, we compared their relative effect size by computing Cohen's d estimates (Cohen, 1988). We performed ali the GLMMs with the Rpackage ghnmTMB (Berg et al., 2017).
2.3 Results
2.3.1 Effect ofmicrotopography on soil physical properties and moisture
A cross our study sites, soil clay content increased with depth (P <0.00 1, Annex B). Microtopography significantly influenced the soil texture: mounds had a lower clay
26 content than pits (P = 0.004, Annex B), especially at a greater depth (P
= 0.0498
,Annex B). For example, the clay content of pits was on average twice that of mounds at a 30 cm depth (23% for pits vs. 12% for mounds, Fig. 2.3a). Stone content was higher in mounds than in pits (P <0.00 1, Annex B), with an average content of22% in mounds compared to 11% in pits (Fig. 2.3b ).
a b 60 60 ~
l
~ 40 8 10crn ëcu 40 ë • 30cm ë 0 0 0 0 iV20~
~ 20 0 ë3 êi) 0 Pit Mo und Pit Mou nd Microtopography Microtopographyc ~ d "i'E 0.6 li! 0
r
f
o. ME ~ ~ -25 ~ 0.4 I)J 15cm c: t;:J 15cm cu • 35cm cu 1 • 45cm ë R-50 0 0 Îii Îii 0.2 iii iii ~ -75 ~ ·c; ~ 0.0 (/) Pit Mo und Pit Mound Microtopography MicrotopographyFigure 2.3: Differences in the soil a) clay content, b) stone content, c) soi] water content (m3·m-3) and d) soil water potential (kPa) ofpits and mounds. The diamond is the mean, the central line is the median, edges of the box represent the interquartile range,
whiskers represent extreme values that are not considered outliers and points represent outliers.
Throughout the summer, measurements at depths of 10 and 30 cm show that soil water content was significantly lower in mounds than in pits (P <0.00 1, Annex C), with an average of0.2 m3·m-3 in mounds compared to 0.3 m3·m-3 in pits (Fig. 2.3c). Similarly,
measurements at depths of 15 and 45 cm show that soil water potential was lower in mounds than in pits (P <0.00 1, Fig. 2.3d, Annex D). In addition, both soil water content
and potential decreased slightly with depth (water content: P < 0.001; water potential: P <0.001, Fig. 2.3, Annex C, Annex D). Overall, water content was lower for sugar maple than bitternut hickory (P = 0.030, Annex C) but water potential, which describes water availability from a biological standpoint, was sitnilar (P = 0.721, Annex D).
2.3.2 Effect of rainfall exclusion on soil moisture, fine root daily production and
standing crop
Looking at the pseudo-R2
, our models assessing the effects of the rainfall exclusion on
the length and mass of the fine root daily production (AnnexE) explained 54% of variance (fixed factors 31 %) and 50% of variance (fixed factors 28%), respectively.
Our models assessing the effects of the rainfall exclusion on the length and mass of the
fine root standing crop (Annex F) explained a greater proportion of variance,
respectively 68% (fixed factors 58%) and 62% (fixed factors 54%). Explanatory variables in our models describing the SRL of the daily production or standing crop
(AnnexE, Annex F) did not exp lain more than 10% of variance. Given such a sm ali
proportion, we could not make any conclusions on the effect of the rainfall exclusion on the SRL of the fine root production and standing crop.
According to the weather station (7025745), total rainfall throughout the study period cumulated 118 mm before the installation of the rainfall exclusion deviee, at the end of the second sampling period, and 240 mm afterwards (Fig. 2.4). The rainfall exclusion experiment significantly reduced soil water content at the fourth sampling period (DOY = 302: P <0.001, Fig. 2.4, Annex C) and soil water potential at the third and fourth sampling periods (DOY = 238: P = 0.007; DOY = 302: P = 0.005, Fig. 2.4, Annex D). For example, the rainfall exclusion reduced soil water content on average by about 0.10 m3·m-3 at the fourth sampling period (Fig. 2.4b). While the reduction in soil water content was similar at both depths, we observed a larger reduction in soil water potential near the surface: we observed an average reduction of 29 kPa at 15 cm compared to 18 kPa at 45 cm (Fig. 2.4c ). Overall, soil moisture reduction due to rainfall
28 exclusion experiment was similar between pits and mounds in terms of water content (sampling period 3: P
=
0.244; sampling period 4: P=
0.283, Annex C) and water potential (sampling period 3: P=
0.579; sampling period 4: P=
0.232, Annex D).Even though the rainfall exclusion experiment reduced the soit water content and water potential, it did not significantly influence the fine root production, whether described in terms of length, mass or SLR (see AnnexE for coefficient estimates and p-value for each predictor). This Jack of effect holds whatever the depth, the species or the microtopography considered. In contrast, the length and mass of the standing crop were significantly reduced after the rainfall exclusion experiment (interaction treatment x 4th sampling period: P
=
0.047, mass: P=
0.011, Annex F). Between the second and fourth sampling periods, the average length of the fine root standing crop increased from 1794 cm·dm-3 to 1886 cm·dm-3 for control trees while it decreased from1780 cm ·dm-3 to 1625 cm ·dm-3 for trees with rainfall exclusion (Fig. 2.5). Similarly,
we observed a small decrease in the standing crop mass for trees with rainfall exclusion (891 mg·dm-3 before exclusion and 840 mg·dm-3 after exclusion) white it increased for
control trees (886 mg.dm-3 to 925 mg·dm-3
, Fig. 2.5). This decrease in the standing
crop mass of rainfall restricted trees was species-dependent; it was more important for bitternut hickory than for sugar maple (interaction treatment x species x sampling period 4: P
=
0.041, Annex F, Fig. 2.5c-d).a
40 Ram exclusion expenment
Ê3o
l
Ll
l
.s. _20L.
I.I
Jil
a: 101
~
I
l.
_
1 L.J 9S 212 238 302 Day of he ar b- 0.30 Rain exclusion experiment
7 E "'E Oep•
--
Sem ë 0.25.
35cm cv ë Traatment 0 0 - c.ontrol Q) -• ra1n e clusJon ~ 0.20 \ \ ·a 1 (/) =: --0.15 195 212 238 302 SP1 SP2 SP3 SP4 c 0 Rain exclusion experiment 'iil Q.. -10 6 -;;; Deptf> ~--
Sem C1) -20 45cm 0 o. (ii Tru ent ni -30 _ ... - conirol 3: - - ra10 exclusJon ·a 1 (/) -40 1 -50 195 212 238 302 SP1 SP2 SP3 SP4Day of the year
Figure 2.4: a) Daily precipitation at the nearest meteorological station during the study period and changes in b) soil water content and c) soil water potential, with and without rainfall exclusion at the four sampling periods (SPI, SP2, SP3 and SP4, represented by the median day of year).


![Figure 2.3: Differences in the soil a) clay content, b) stone content , c) soi] water content (m 3 ·m - 3 ) and d) soil water potential (kPa) ofpits and mounds](https://thumb-eu.123doks.com/thumbv2/123doknet/2785273.65637/36.904.275.660.357.692/figure-differences-content-content-content-potential-ofpits-mounds.webp)