Computer Based Technique to Detect Depression in
Alzheimer Patients
by
Bashar ABDALLAH
THESIS PRESENTED TO ÉCOLE DE TECHNOLOGIE SUPÉRIEURE IN
PARTIAL FULFILLMENT OF THE REQUIREMENTS FOR THE DEGREE
A MASTER’S DEGREE WITH THESIS IN INFORMATION
TECHNOLOGY ENGINEERING
M.A.SC.
MONTREAL, MARCH 16, 2020
ÉCOLE DE TECHNOLOGIE SUPÉRIEURE UNIVERSITÉ DU QUÉBEC
This Creative Commons licence allows readers to download this work and share it with others as long as the author is credited. The content of this work can’t be modified in any way or used commercially.
BOARD OF EXAMINERS THIS THESIS HAS BEEN EVALUATED BY THE FOLLOWING BOARD OF EXAMINERS
Sylvie Ratté, PhD, Thesis Supervisor
Département de génie logiciel et des technologies de l’information à l’École de Technologie Supérieure at École de technologie supérieure
Simon Drouin, PhD, President of the Board of Examiners
Département de génie logiciel et des technologies de l’information à l’École de Technologie Supérieure at École de technologie supérieure
Luc Duong, PhD, Member of the jury
Département de génie logiciel et des technologies de l’information à l’École de Technologie Supérieure at École de technologie supérieure
THIS THESIS WAS PRENSENTED AND DEFENDED
IN THE PRESENCE OF A BOARD OF EXAMINERS AND PUBLIC FEBRUARY 11 2020
Techniques Informatiques Pour Détecter LA Dépression Chez Des Patients Alzheimer
Bashar ABDALLAH
RÉSUMÉ
La dépression est fréquente chez les patients atteints de la maladie d'Alzheimer (MA), plus particulièrement aux stades précoce (déficience cognitive légère) et moyen de la maladie. On estime que 30% des patients atteints de la MA souffrent de dépression. Cet état dépressif a souvent pour effet d'aggraver la maladie car il peut engendre un déclin cognitif. Il n'existe cependant pas de test officiel permettant de diagnostiquer la dépression chez les patients atteints de la maladie d'Alzheimer, ce qui représente un défi pour la communauté médicale. Cette recherche vise à aider les communautés médicales à relever ce défi en présentant des modèles d'apprentissage automatique qui classent les patients atteints de MA et de déficience cognitive légère en deux classes (dépressive et non dépressive). Pour réaliser cette étude, nous avons choisi 276 participants (âge moyen 70,9 ans) provenant du Corpus de Pittsburgh, Dementia Bank.
Pour réaliser cette étude, nous avons choisi 276 participants (âge moyen 70,9 ans) provenant du Corpus de Pittsburgh, Dementia Bank. La voix de l'intervieweur et les silences sont supprimés des enregistrements audio en tant que tâche de prétraitement. Différentes caractéristiques sont extraites du discours du patient pour accomplir cette tâche. Par exemple, MFCC, Spectral Centroid, Spectral Roll-Off Point, etc. Nous avons utilisé et comparé trois techniques de classification traditionnelles, SVM, Random Tree et Random Forest, et un réseau de neurones artificiel (ANN). La méthode de bootstrap est utilisée pour résoudre le biais d'échantillonnage puisque 70% des patients ne souffrent pas de dépression.
D'après les résultats, l'ensemble des caractéristiques calculées à partir des MFCC est plus approprié avec les classificateurs basés sur une arborescence (Random Tree, Random Forest); le classificateur Random Tree a obtenu la plus grande exactitude de classification (91,3%). Alors que les autres caractéristiques, dites standards, sont plus appropriées avec les machines à vecteurs de support (SVM) que les classificateurs basés sur des arbres; où SVM atteint 89,1% d’exactitude, 91,1% de rappel et 89,1% de précision.
En conclusion des résultats de la recherche, le classifieur Random Tree a obtenu les taux de performance de classification les plus élevés - avec 91,3% d'exactitude, de rappel et de précision - en utilisant les caractéristiques MFCC (écart-type et Kurtosis).
Computer Based Techniques To Detect Depression In Alzheimer Patients Bashar ABDALLAH
ABSTRACT
Depression is common among Alzheimer's patients in the early and middle stages of Alzheimer, it is estimated that 30% of Alzheimer patients are suffering from depression. Depression in Alzheimer patients can lead to more cognitive decline. There is no official test that diagnoses depression in Alzheimer patients which is a challenge for the medical communities. This research aimed to help the medical communities in this challenge, by presenting machine learning models that classify AD and MCI patients into two classes (depressive and non-depressive). 276 participants (mean age 70.9) are selected from the Pitt Corpus of Dementia Bank.
The interviewer’s voice and the silences are removed from the audio records as a preprocessing task. Different features are extracted from the patient's speech to achieve this task. For instance, MFCC’s, Spectral Centroid, Spectral Roll-Off Point, and others. We used three traditional classification techniques (SVM, Random Tree, and Random Forest). The Artifical Neural Networks (ANN) is used also to provide an idea of how this project can be extended. Bootstrapping method is used to solve the sampling bias – 70% of the patients are not suffering from depression.
From the results, MFCC’s features set is more appropriate with tree-based classifiers than SVM, where the Random Tree classifier achieved the highest classification accuracy (91.3%). While the other features set are more appropriate with SVM than tree-based classifiers, where SVM achieved 89.1% accuracy, 91.1% recall, and 89.1% precision. As a conclusion of the research results, the Random Tree classifier performed the highest classification performance rates – with 91.3% for accuracy, recall, and precision - using MFCC’s features (Standard Deviation and Kurtosis).
TABLE OF CONTENTS
Page INTRODUCTION ...1 CHAPTER 1 LITERATURE REVIEW ...3 CHAPTER 2 DETECTING DEPRESSION IN ALZHEIMER’S DISEASE AND MCI BY
SPEECH ANALYSIS ...9 2.1 Introduction 9 2.1.1 Alzheimer Disease ... 9 2.1.2 Depression ... 10 2.1.3 Related Work ... 11 2.2 Methods 13 2.2.1 Dataset ... 13 2.2.2 Feature Extraction ... 14 2.2.3 Classification ... 15 2.3 Results 16 2.3.1 Experiment A ... 16 2.3.2 Experiment B ... 17 2.3.3 Experiment C ... 19 2.4 Discussion 20 2.5 Conclusion 22 CHAPTER 3 DISCUSSION ...23 3.1 Overfitting 23
3.2 Deep learning for detecting depression on Alzheimer’s patients 25 CONCLUSION ...29 LIST OF BIBLIOGRAPHICAL REFERENCES ...31
LIST OF FIGURES
Page
Figure 1.1 Overview of the methodology ...6
Figure 1.2 SVM classifier discription ...6
Figure 1.3 SVM polynomial function ...7
Figure 1.4 ANN description ...8
Figure 2.1 Feature groups in this research ...15
Figure 2.2 Classification Results of Experiment A Subset 1 ...16
Figure 2.3 Classification Results of Experiment A Subset 2 ...17
Figure 2.4 Classification Results of Experiment B Subset 1 ...18
Figure 2.5 Classification Results of Experiment B Subset 2 ...18
Figure 2.6 Classification Results of Experiment B Subset 3 ...19
Figure 2.7 Experiment C results ...20
Figure 3.1 The First Experiment Results of ANN ...26
Figure 3.2 The Second Experiment Results of ANN ...26
Figure 3.3 The Third Experiment Results of ANN ...27
LIST OF TABLES Page Table 3.1 Overfitting test results ...24
INTRODUCTION
Alzheimer's disease (AD) is a type of dementia that causes various problems related to memory, thinking skills and behavior, it is ranged between 60 to 80 percent of dementia patients are suffering from Alzheimer's (Alzheimer’s Association, 2018). Alzheimer's symptoms can include mood and behavior changes, serious problems with memory loss, disorientation and others (Alzheimer’s Association, 2018). Over time the symptoms become more aggressive which led the patients by years to lose his cognitive skills (Alzheimer’s Association, 2018). Alzheimer's probably progresses from many factors, such as genetics, lifestyle, and environment (Alzheimer’s Association, 2018). Moreover, scientists have considered the age as a factor where most of Alzheimer patients are 65 years old and more (Alzheimer’s Association, 2018).
In the early and middle stages of Alzheimer's, depression is very common among the patients (Alzheimer’s Association, 2018). For the reason that Alzheimer’s can generate the same depression symptoms, detecting depression in Alzheimer’s is a challenging task (Alzheimer’s Association, 2018). For instance, apathy, impaired thinking, loss the interest in activities, trouble concentrating are shared symptoms to both Alzheimer's and depression (Alzheimer’s Association, 2018). For the reason that there is no official test to diagnose depression in Alzheimer patients, the physicians rely on the following methods to diagnose depression: mental and physical tests, interviews with family members and medical history (Alzheimer’s Association, 2018).
Based on the above, this research aimed to help the medical communities to overcome the challenges of detecting depression in Alzheimer patients. Machine learning techniques are used to classify Alzheimer patients into two classes (depressive AD and Non-depressive AD). Three traditional Machine Learning classifiers (Random Tree, Random Forest, and Support Vector Machine) and the Artificial Neural Network are used to accomplish this task. Several audio features such as MFCC’s, Zero Crossing, and Spectral Centroid are extracted from Alzheimer’s patients' speech. This research has two objectives, the first objective is to
2
determine the most performant classification technique in distinguishing AD or MCI depressed patients and AD or MCI non-depressed patients. The second objective is to determine the most appropriate subset features for this task.
This thesis is organized as the following: The first chapter is the literature review, this chapter introduces Alzheimer’s disease, and covers many aspects such as Alzheimer’s stages, symptoms, facts, and statistics. Moreover, the medical community challenges in detecting depression in Alzheimer patients. The dataset, the cookie theft test and the evaluation scale of depression (Hamilton Depression Rating Scale) are covered in this chapter. By the end of this chapter, there is a diagram shows the methods accomplished for this research.
The second chapter is a journal article was written and submitted in the Journal of Alzheimer's disease. Several issues are covered in this article such as the research problem, the related work, and some facts about depression and Alzheimer’s. Moreover, the research methodology and results are explained in this chapter. The third chapter is a general discussion that discusses the obtained results. An Overfitting test is covered in this chapter to validate the research results. Moreover, detecting depression in Alzheimer patients using the Artificial Neural Network (ANN) is covered. The last chapter in this thesis is the Conclusion, in this chapter, a brief of the research problem, methods, results, and future work are covered
CHAPTER 1
LITERATURE REVIEW
The proportion of older people in society has increased as a result of recent healthcare evolution. This increment has extended the prevalence of Alzheimer patients worldwide. According to (Alzheimer’s Association, 2018), it is estimated that by 2050, the number of people with Alzheimer’s dementia (65 and older) may grow to 13.5 million patients. Furthermore, healthcare costs will grow up to 1.1 trillion dollars in 2050. To minimize the costs and to help the medical community to overcome several challenges, it’s essential to find a mechanism to detect Alzheimer’s at an early stage. Several hypotheses are trying to explain the cause of Alzheimer’s, where the cause is still unknown (Alzheimer’s Association, 2018). The Amyloid hypothesis is a hypothesis that assumes the extracellular of amyloid-beta (Aβ) is the cause of Alzheimer (Hardy & Allsop, 1991). Another hypothesis, which is the genetic hypothesis, assumes that the cause of Alzheimer’s is genetic (by inheritance) (Wilson et al., 2011). According to (L. et al., 2012), detecting Alzheimer’s disease at an early stage is essential because treatment may be most useful. Because there is no tool to detect Alzheimer on an early stage, the physicians diagnose patients based on some clinical tests; those test includes physical test, Neurological exam, Medical history, and others (Alzheimer’s Association, 2018). Also, other factors aid the diagnosing process, such as the symptoms. There are around 10 signs – symptoms that can help the physician to diagnose Alzheimer According to (Alzheimer’s Association, 2018). For instance, when the patient begins to suffer from the impact of poor memory on his daily activities, or start to face difficulty in achieving the daily task, language problems, problems with abstract thinking, and other unnatural cognitive declines.
It is essential to differentiate between Alzheimer’s and Mild cognitive impairment (MCI), which is a neurological disorder that may occur in older adults who are suffering from cognitive impairments with minimal impairment in instrumental activities of daily living (Petersen et al., 2018). The clinical evaluation is necessary to diagnose MCI (Grundman et al., 2004); also, neuroimaging (Smailagic et al., 2015), blood tests, and neuropsychological testing
4
are used on diagnosing (Morris et al., 2001). The Lifestyle considered as a factor that may reduce the risk of Alzheimer’s, people who are involved in several activities such as reading, crossword puzzles, and other intellectual activities are less risk to get Alzheimer’s disease (M. Tucker & Stern, 2011). Moreover, education may play a significant role in delaying AD symptoms without changing the duration of the disease (Paradise, Cooper, & Livingston, 2009).
In the early stages, the patient starts facing some problems with his language, where these problems characterized by decreasing vocabulary and fluency works; this could make his language weak (Förstl & Kurz, 1999) (Taler & Phillips, 2008). In the middle stages of Alzheimer’s, the cognitive decline becomes more significant than before, which affects several daily activities such as shopping, dressing, and others (Alzheimer’s Association, 2018). With an increasing need for more care and aid (Alzheimer’s Association, 2018). Late-stage of Alzheimer (called severe), the patient needs twenty four hours daycare, where the person loses his ability to communicate (Alzheimer’s Association, 2018).
Depression considered a common Illness for Alzheimer patients in the early and middle stages (Alzheimer’s Association, 2018). Diagnosing depression for Alzheimer patients is challenging, where dementia (Alzheimer) shared some symptoms with depression (Alzheimer’s Association, 2018). For instance, the following symptoms are common for both depression and Alzheimer: Apathy, loss of interest in activities and hobbies, impaired thinking, and others (Alzheimer’s Association, 2018). Diagnosing depression for Alzheimer patients includes the following: reviewing the medical history of patients, mental and physical examination, and talk to the family members (Alzheimer’s Association, 2018). The treatment for depression exists where the treatment could be a Non-drug approach or drug approach; the decision-maker is the physician.
Several scales are used by physicians to evaluate depression. In this research, depression is evaluated by the Hamilton Depression Rating Scale (HAM-D or HDRS), which is a questionnaire used by physicians to rate the depression level of the participants (HAMILTON, 1960). The scale is divided into five groups; the first group is the participant score between 0 and 7; in this case, they considered healthy participants (Zimmerman, Martinez, Young,
5
Chelminski, & Dalrymple, 2013). In the second group, their total score ranged between 8 and 13; this group considered as mild depression (Zimmerman et al., 2013). In the third group, their total score ranged between 14 and 18; this group considered moderate depression (Zimmerman et al., 2013). In the fourth group, their total score ranged between 19 and 22; this group considered a severe depression (Zimmerman et al., 2013). The last group is composed of the participants that score 23 or more; the patients in this group are considered to suffer a very severe depression (Zimmerman et al., 2013).
The data used in this research is a part of the Dementia Bank (Pitt corpus), which is a shared database that consists of multimedia data for Alzheimer patients, MCI, and Control participants (Becker, Boiler, Lopez, Saxton, & Mcgonigle, 1994). The Cookie Theft picture description task examined all participants in this research. This test is achieved by asking the participants to describe a picture. In this picture, a mother is cleaning the dishes while her children are trying to steal some cookies. This test is from the Boston Diagnostic Aphasia Examination (Goodglass, H., & Kaplan, 1983). Various research is achieved on the machine learning field that used the Cookie theft description task. For instance, the reference (Fraser, Rudzicz, & Hirst, 2016) used the Cookie theft description task to detect depression in Alzheimer patients. Also, reference (Hernández-Domínguez, Ratté, Sierra-Martínez, & Roche-Bergua, 2018) used this test to automatically evaluate the performance of Alzheimer patients during picture description tasks.
This research used machine learning to classify Alzheimer patients into two classes (Depressive and Non-depressive) patients by speech analysis. The following diagram in figure 1.1 presents an overview of our methodology.
6
Figure 1.1 Overview of the methodology
From figure 1.1, four supervised learning algorithms are used in this research. Support vector machine (SVM) is one for these four, this algorithm takes the features and draws a hyperplane that separates the data. The following figure (1.2) shows how SVM work.
Figure 1.2 SVM classifier discription
The best hyperplane is the one that maximizes the margins from both classes. For nonlinear data, the kernel function can be changed to polynomial. The following figure (1.3) shows how the polynomial kernel function works.
7
Figure 1.3 SVM polynomial function
The second supervised learning algorithm is random tree, which is a decision tree classifier. This tree uses the nodes as a point to select the path based on some criteria. The third supervised learning algorithm in this research is the random forest. This classifier consists of a large number of individual decision trees, each tree it does the classification individually, the class that has the most votes become the final prediction. The last supervised learning algorithms is the artificial neural network (ANN). This classifier is used as extended work to open the door for future work. The following figure (1.4) shows how ANN works.
8
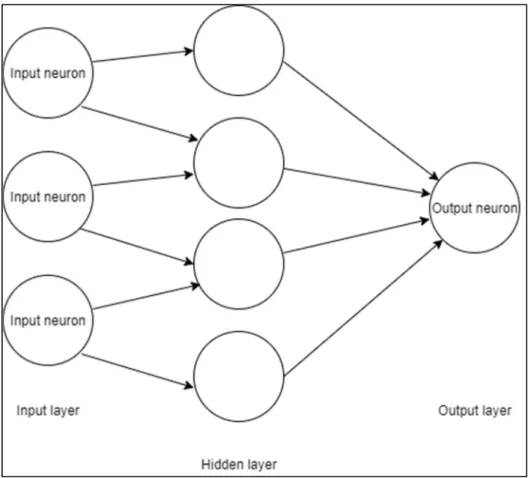
Figure 1.4 ANN description
This classifier consists of a group of neurons with paths between them, the data are introduced to ANN by the input layer. In the middle, there is a hidden layer where all the processing happens, and then the data are passed to the output layer.
9
CHAPTER 2
DETECTING DEPRESSION IN ALZHEIMER’S DISEASE AND MCI BY SPEECH ANALYSIS
Bashar Abdallah, Sylvie Ratté
Department of Software and IT Engineering, Ecole de technology supérieure, Montreal, Canada
Paper submitted for publication in Journal of Alzheimer’s Disease, December 2019.
2.1 Introduction
2.1.1 Alzheimer Disease
While a certain amount of cognitive decline is part of a healthy aging process, many older seniors worldwide suffer from a sharp cognitive decline caused by Alzheimer’s disease (AD) and other types of dementia. AD, in particular, poses many challenges both at the individual and societal levels. First, it has a direct impact on patients, as well as their loved ones, because as the disease progresses, a greater and greater burden is put upon the circle of relatives, friends, and acquaintances. Second, the high number of patients exerts economic and social pressure on society since related medical care becomes more expensive. Indeed, in 2017, the estimated total costs associated with all individuals with AD or other dementias was $259 billion (Alzheimer’s Association, 2018). Furthermore, the percentage of total deaths due to Alzheimer’s disease is greater than those for both breast cancer and prostate cancer combined (Alzheimer’s Association, 2018), 1 out of 3 seniors dies of AD or other dementia types (Alzheimer’s Association, 2018).
Alzheimer’s disease usually progresses gradually, and in three general stages. At the Mild (early) stage, patients may still be able to accomplish familiar tasks, and might notice mild cognitive changes such as difficulty remembering the names of new people (Alzheimer’s Association, 2018). The disease then reaches the Moderate stage, which can last many years.
10
During this stage, symptoms evolve, and worsen; the patient feels moody, is more forgetful, and has more and more difficulty accomplishing familiar tasks. Overall, the patient is losing the ability to perform regular daily tasks, including those involving several mental skills such as planning and keeping track of recent events. The disease gradually progresses until it reaches a Severe stage, in which patients lose the ability to speak and respond to the environment.
Diagnosing AD is notoriously tricky; with the assessment failure percentage reaching as high as 50% (Boise, Neal, & Kaye, 2004). One of the challenges is identifying the early signs of AD among patients that are believed to be in the Mild Cognitive Impairment (MCI) stage. According to (Gauthier et al., 2006), several studies suggest that the percentage of MCI among people 65 and older ranges between 3 and 19%. With MCI, changes are not severe enough to affect daily life functions. However, people diagnosed with MCI are more likely to develop Alzheimer’s disease than people without MCI, and the rate at which MCI will progress to Alzheimer’s disease lies between 10% and 15% annually(Grundman et al., 2004).
2.1.2 Depression
While “feeling sad” is a typical transitional emotion, depression is a severe medical illness since it profoundly affects how patients feel, the way they think, and how they act. This illness can lead patients to lose their motivation to carry out normally enjoyable activities or to lose the ability to function at work or home. One out of fifteen adults can be affected by depression in any given year, and one of six people will experience depression at some time in their life (American Psychiatric Association, 2013).
A patient can be diagnosed with depression after two weeks following the appearance of symptoms. Symptoms can include the following: changes in appetite, thoughts of death or suicide, slowed movements and speech, and difficulty thinking, concentrating, or making decisions (American Psychiatric Association, 2013).
Moreover, in cases of major depression, feelings of worthlessness and self-loathing are common (American Psychiatric Association, 2013). Fortunately, depression is a treatable
11
disease; and between 80 and 90% of patients respond to treatment (American Psychiatric Association, 2013).
According to (Lee & Lyketsos, 2003), around 30-50% of AD patients suffer from depression. This further complicates the task of diagnosing AD since both illnesses share some symptoms. For example, both induce poor concentration, impaired attention (Korczyn & Halperin, 2009), apathy (Lee & Lyketsos, 2003), and changes in eating and sleeping patterns (Thorpe, 2009). Suffering from both MCI and depression can augment the risk of developing Alzheimer’s disease by a factor of two (or more) when compared to non-depressed MCI patients (Modrego & Ferrández, 2004). Consequently, cognitive decline is more significant among Alzheimer’s patients who are suffering from depression than for patients without depression (Lyketsos et al., 1997)(Milwain & Nagy, 2005)(Shim & Yang, 2006). Detecting and treating depression in AD patients helps diagnose AD more accurately, and can further improve patients’ prognosis.
2.1.3 Related Work
Many machine learning models have been proposed to distinguish depressed from non-depressed patients (Hosseinifard, Moradi, & Rostami, 2013) (Asgari, Shafran, & Sheeber, 2014), on the one hand, and AD from non-AD (Fraser, Meltzer, & Rudzicz, 2015),(M. TANVEER et al., 2019). On the other. Most models, particularly those for depression, are based on the use of several audio features, such as speech segments and fundamental frequency. For AD detection, textual features, such as lexical richness, are mostly preferred – see (M. TANVEER et al., 2019) and references therein. In (Hosseinifard et al., 2013), the authors used a non- linear analysis of EEG signals as a feature to discriminate 45 depressive patients from 45 control subjects; none of the participants was suffering from AD. The classification model had a 90% classification accuracy using the Regression classifier.
(Asgari et al., 2014) Used several audio features and some textual features to detect depression in non-AD subjects. Their best SVM classifier achieved a 74% accuracy. The authors in (Alghowinem et al., 2013) used hybrid classifiers to detect depression from the
12
spontaneous speech of 60 participants (again non-AD). The hybrid classifier consisted of SVM and GMM; this hybrid classifier were fed by several audio features such as MFCC, Pitch, Intensity, etc. The model had a 91.6 % classification accuracy. (Fraser et al., 2015) achieved an 81% classification accuracy in distinguishing AD patients from healthy people using both audio and linguistic features. A logistic regression classifier was used to perform this task with several linguistic features, such as parts of speech. In a recent work on depression detection in AD patients, the same authors (Fraser et al., 2016) used both acoustic and linguistic features to study the impact of depression on the detection of Alzheimer’s disease, by classifying participants into depressive and non-depressive groups. In the experiment, the best model achieved a 65.8% classification accuracy using the Logistic Regression classifier. As can be seen, both detection tasks (AD vs non-AD, depressive vs non-depressive) are tricky, and highly dependent on the context of the data used.
Our research aimed to assist the medical community in detecting depression in Alzheimer’s patients and patients with MCI. Therefore, we used speech data recorded during the Picture Description Task -same data used in (Fraser et al., 2016), a task widely used to detect signs of AD. Our approach was also based on machine learning techniques, but involves three steps: the cleaning of the audio feed, the feature extraction process, and the classification phase. Since it is generally agreed that many signs of depression are hidden in the speech signal, while AD signs are more present in the textual content per se, we added a cleaning phase to reduce the audio to the patients’ speech moments. The classification phase separates the patients into two sets, depressed and non-depressed. Our exploration aims to answer two questions that are limited to AD and MCI patients: 1) which classification technique performs best in distinguishing depressed patients from non-depressed patients? 2) which features subset is the most appropriate for this task?
13
2.2 Methods
2.2.1 Dataset
This section describes the dataset used in this paper. This dataset is part of the DementiaBank’s (DB) Pitt Corpus (Becker et al., 1994), a shared database consisting of multimedia data that contains 309 participants suffering from various types of dementia, including AD and MCI. It also contains 218 Control participants. 518 for Alzheimer’s patients, MCI, and Control participants.
To answer our two questions, we extracted 276 MCI or AD patients (165 females and 111 males) from the DB based on the availability of HAM-D results. Since that MCI symptoms are close to the early signs of AD, MCI and AD are included in this research, while the other types of dementia excluded. The average age of our participants was 70.9. Within that subset, 194 of the participants has AD, while the rest were suffering from both depression and AD. All the participants performed the Cookie Theft picture description task, a test that is part of the Boston Diagnostic Aphasia Examination (Goodglass, H., & Kaplan, 2001).
The Hamilton depression rating scale (HAM-D) is used in DB to rate the depression level in participants (HAMILTON, 1960). If the total score for a participant is between 0 and 7, the participant is non-depressed; a score equal to or greater than 8 is an indicator that the participant is depressed (Zimmerman et al., 2013). For our AD patients, their HAM-D ranged between 0 (normal) and 20 (severe depression) with a 5.9 average for the non-depressed patients (70%, 194 patients), and an average of 10.6 for our depressed patients (30%, 82 patients).
Since many signs of depression are hidden in the speech signal, we preprocessed the audio stream of each patient. First, we removed the parts where the interviewer was speaking. Second, we removed pauses – the intervals during which patients stop talking – irrespective of whether these pauses contained silence or audio noises. We thus concentrated our analysis on the patients’ voices.
14
2.2.2 Feature Extraction
This section describes the process of extracting audio features and the features used. We extracted two groups of features using the jAudio framework in both cases (McEnnis, McKay, Fujinaga, & Depalle, 2005). Since Standard low-level features (SLL) are more likely to achieve high-performance rates in classifying the speech audio (Breebaart & McKinney, 2004), we hypothesize that they could perform well in detecting depression. Our first group, group 1, contains the following features:
• Spectral Centroid: a short-time Fourier transform performed frame by frame along the time axis (Li, Sethi, Dimitrova, & McGee, 2001).
• Spectral Roll-Off Point: the frequency below which 85% of the energy in the spectrum is located. It is often used as an indicator of the skewness of the frequencies present in a window (Breebaart & McKinney, 2004).
• Root Mean Square: the amplitude of a window (Breebaart & McKinney, 2004).
• Zero Crossings: the number of time-domain zero crossings within the processing window (Li et al., 2001).
• Mel-Scale Frequency Cepstral Coefficient (MFCC): describes a spectrum window (Breebaart & McKinney, 2004).
• Method of Moments: This feature consists of the first five statistical moments of the spectrograph: the area (zeroth order), the mean (first-order), the Power Spectrum Density (second-order), the Spectral Skew (third-order), and the Spectral Kurtosis (fourth-order) (Breebaart & McKinney, 2004).
We did not extract the entire SLL feature set because some of the features cannot be extracted using jAudio, in addition to which we wanted to keep the feature extraction process as simple as possible. The method of moments feature is extracted to study the impact of its addition to our feature set; moreover, it is a step allowing the discovery of some other features that can improve the performance of the classification.
15
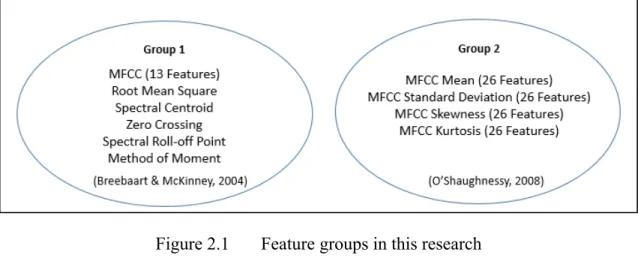
Since MFCC is one of the most used features in speech recognition (O’Shaughnessy, 2008), our second group, group 2, is composed solely of features derived from it; it contains the mean, the standard deviation, the kurtosis, and the skewness. The following figure (2.1) shows the feature groups which used in this research.
Figure 2.1 Feature groups in this research
2.2.3 Classification
This section describes the machine learning tools and the classification techniques used in this paper. To quickly test a variety of classifiers, we used the Waikato Environment for Knowledge Analysis (Hall et al., 2009). After some preliminary testing, we choose to compare three classifiers: Support vector machine (SVM) (Smola & Schölkopf, 2004), Random Forest (RF) (Breiman, 2001), and Random Tree (RT) (Drmota, 2009).
To solve the imbalance of the data (and therefore the sampling bias) – 70% of the data set is non-depressive, while 30% are depressive – we applied a Bootstrapping procedure. Contrary to other methods, bootstrapping is a nonparametric resampling procedure that does not assume a normal distribution. It consists in repeatedly sampling the data and estimating the effect of each resampled dataset (Preacher & Hayes, 2008). For our evaluation, we used 10-fold cross-validation. Our 276 patients were classified as Depressed (194 with Hamilton score equal to
16
or greater than 8) and Non-depressed (Hamilton score between 0 and 7) classes (Zimmerman et al., 2013).
2.3 Results
To study the effects of the audio feature extractions on the machine learning classifiers, we constructed two (2) experiments. Experiment A used subsets of the features in group 1, while experiment B used different subsets of features in group 2.
2.3.1 Experiment A
This experiment was executed on two (2) subsets; which both subsets used the features of group 1. After testing several subsets of this feature group, these two subsets are selected based on the classification performance. The kernel function which used in this experiment for SVM is the radial basis function
• Subset 1
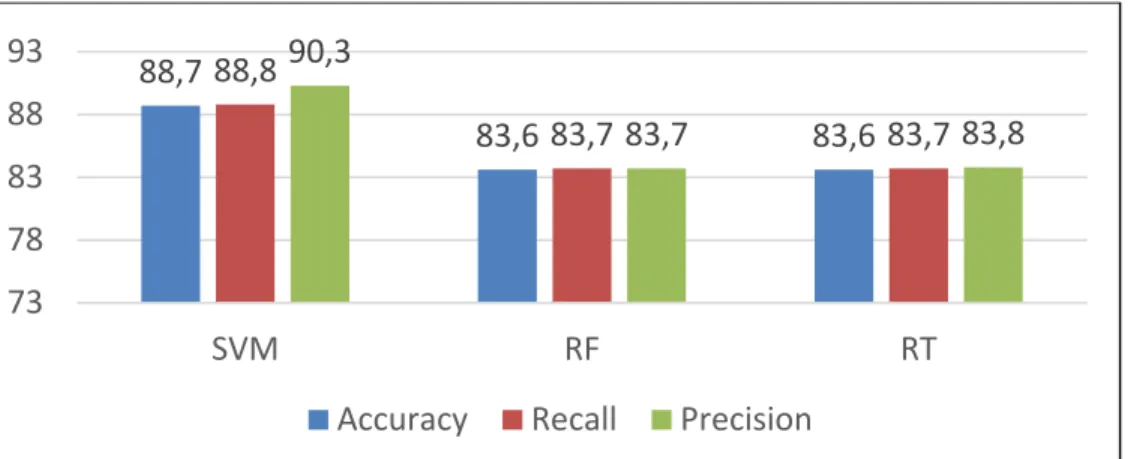
This subset contained the following features: Spectral Centroid, Root Mean Square, Zero Crossings, and MFCC. The results are shown in Figure 2.2.
Figure 2.2 Classification Results of Experiment A Subset 1 88,7 83,6 83,6 88,8 83,7 83,7 90,3 83,7 83,8 73 78 83 88 93 SVM RF RT
17
From figure 2.2, the SVM classifier reported the highest classification performance rates as following: accuracy (88.7%), recall (88.8%), and precision (90.3%). Therefore, SVM is ranked first, ahead of the other two (2) classifiers (i.e., Random Tree and Random Forest).
• Subset 2
This feature set contained the same features of the first subset to which we added the Spectral Roll-Off point and Method of the moment. Figure 2.2 shows the results.
Figure 2.3 Classification Results of Experiment A Subset 2
From Figure 2.3, the SVM classifier once again reported the highest classification performance rates as follows: accuracy (89.1%), recall (91.1%), and precision (89.1%). Therefore, SVM is ranked first, ahead of the other two (2) classifiers. We can observe a general improvement in the performance of all classifiers, and especially with the Random Tree and Random Forest.
2.3.2 Experiment B
This experiment was executed on three (3) subsets of features. Each subset consisted of different combinations of MFCC features (Average, Standard deviation, Kurtosis, and Skewness). After testing several subsets of this feature group, these two subsets are selected based on the classification performance. The kernel function which used in this experiment for SVM is the polynomial function
89,1 86,5 85,5 91,1 86,6 85,5 89,1 86,8 85,5 73 78 83 88 93 SVM RF RT
18
• Subset 1
This subset contained the Average, Standard Deviation, Kurtosis, and Skewness of MFCC.
Figure 2.4 Classification Results of Experiment B Subset 1
From Figure 2.4, the SVM classifier reported the highest classification performance rates as follows: accuracy (85.8%), recall (85.9%), and precision (86%). Therefore, SVM is ranked first, ahead of the other two (2) classifiers.
• Subset 2
This Subset contained the Standard Deviation, Kurtosis, and Average of MFCC.
Figure 2.5 Classification Results of Experiment B Subset 2
85,885,9 86 85,585,585,5 84,784,8 84,8 73 78 83 88 93 SVM RF RT
Accuracy Recall Precision
85,8 86,5 89,1 85,9 86,6 89,1 86 86,6 89,2 73 78 83 88 93 SVM RF RT
19
From Figure 2.5, the Random Tree classifier reported the highest classification performance rates as follows: accuracy (89.1%), recall (89.1%), and precision (89.2%). Therefore, Random Tree is ranked first, ahead of the other two (2) classifiers. The changes in this subset (excluding MFCC Skewness features) did improve the classification performance, especially the Random Tree classifier.
• Subset 3
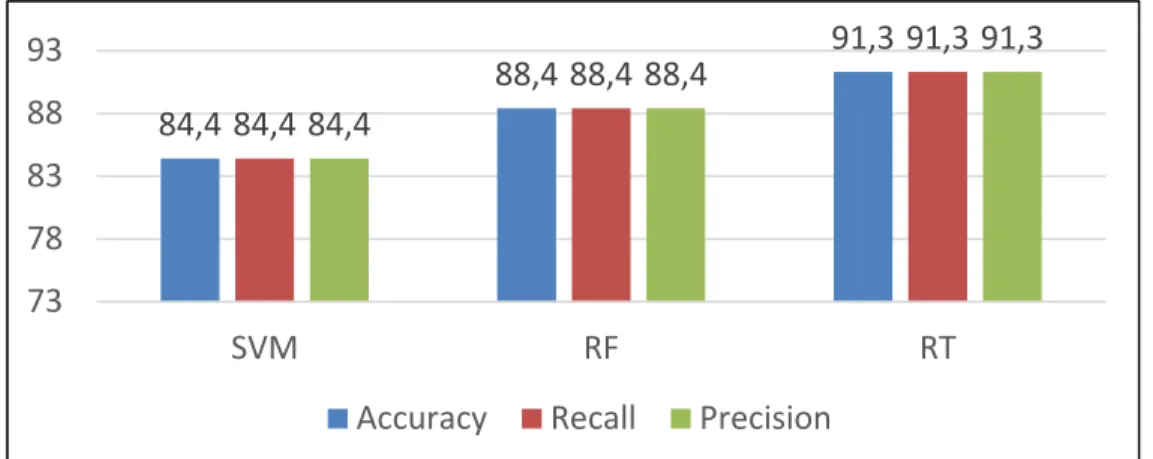
This subset consists of only two features, Standard Deviation, and Kurtosis of MFCC
Figure 2.6 Classification Results of Experiment B Subset 3
From figure 2.6, the Random Tree classifier reported the highest classification performance rates as follows: accuracy (91.3%), recall (91.3%), and precision (91.3%). Therefore, the Random Tree is ranked first, ahead of the other two (2) classifiers. This improvement is the result of excluding the MFCC Average features from this subset.
2.3.3 Experiment C
This experiment aimed to compare our research methods with (Fraser et al., 2016) by using their classifier (logistic regression). The second features group (see figure 2.1) is used in experiment C because it shows the highest classification performance in this research. Three feature subsets are used to achieve this experiment, the first subset contained the Average, Standard Deviation, Kurtosis, and Skewness of MFCC. The second subset contained the
84,4 88,4 91,3 84,4 88,4 91,3 84,4 88,4 91,3 73 78 83 88 93 SVM RF RT
20
Standard Deviation, Kurtosis, and Average of MFCC. While the third subset contained the Standard Deviation and Kurtosis. The following figure (2.7) shows the classification performance using the second feature group with logistic regression classifier.
Figure 2.7 Experiment C results
From figure 2.7, the first feature subset performed the highest classification performance (82.9% classification accuracy 83% recall and precision) using logistic regression classifier. While the third subset achieved the lowest classification performance (62.6% accuracy, 62.7% recall and precision).
2.4 Discussion
In this section, we are going to discuss the result of our experiments and show how these results could be improved. As shown in the previous section, the recommended features (linear data) (see section 2.2.2) achieved generally high classification performances. From Figures 2.2 and 2.3 (Results of Experiment A), SVM achieved the highest classification performance, while the Random Tree achieved the lowest.
The second part of experiment A (see subset 2 of experiment A) shows some improvement in the classification performance. This improvement is the result of adding the Method of moment
82,9 75 62,6 83 75,2 62,7 83 75 62,7 50 60 70 80 90
Subset 1 Subset 2 Subset 3
21
and the Spectral Roll-Off point features. Which seem to be more compatible with SVM than with tree-based classifiers.
The results are in agreement with (Breebaart & McKinney, 2004); these features are appropriate for speech classification, but experiment B (section 2.3.2) shows that MFCC is more appropriate to the specific task of depression classification. From figures 2.4, 2.5, and 2.6, the classifiers can provide at least 82.9% classification accuracy. These results are compatible with the discussion in (O’Shaughnessy, 2008), to the extent that the features of MFCC are the most used in speech recognition systems because they achieve high performances.
The first part of experiment B (see subset 1 of experiment B) SVM achieved the highest classification performance, while the Random Tree classifier achieved the lowest. We eliminated some features (Skewness and Average) in the second and third parts of experiment B to evaluate the effectiveness of these features. After this elimination (see figures 2.4-2.6), the classification accuracy reached up to 91.3% for the Random Tree classifier. From these results, the features of MFCC (linear data) would appear to be more appropriate for the tree-based classifiers than for SVM.
The reference (Fraser et al., 2016) performed the same task (detect depression in Alzheimer patients). Using a subset of 130 AD patients (we used 276), the authors achieved 65.8% classification accuracy using a Logistic Regression classifier. They introduce many features, including MFCC's and linguistic features. In experiment C (see section 2.3.3), the Logistic Regression classifier is used, to compare our research strategy with them. The results show that, the same classifier achieved better classification performance when the silence moments and the interviewer's voice are removed from the audio streams. Also, some factors aided to achieve better performance, for example, the features are selected based on the literature review. Moreover, all the available data in the dataset are used in this research.
22
2.5 Conclusion
The objective of this paper was to establish a starting point for increasing the performance of machine learning models using speech analysis to classify depressive Alzheimer’s patients from their non-depressive counterparts. We compared the performances of three classification techniques using two different groups of features, one having two subsets of some Standard Low-Level (SLL) features with (13) MFCC, and the other using three subsets of (26) MFCC features. The results show that the Random Tree classifier achieved the best classification performance with (26) MFCC features (Standard Deviation and Kurtosis), while SVM achieved the best classification performance with the first features group (see section 2.2.2). Moreover, the results of this research confirm that the audio features selection has a significant effect on classification results.
Most of our AD patients were not suffering from depression, which made the dataset unbalance. This challenge was solved by using a bootstrapping method to balance the classes, with bootstrapping (resampling with replacement) allowing machine learning models to gain an enhanced understanding of the various biases and variances.
For future work, we recommend studying the behavior of tree classifiers (Random Tree and Random Forest) because many research papers suggest that they are unstable, and could be affected by slight modifications of the data used. Moreover, we recommend implementing the same task by employing a balanced dataset, and by testing the different features subsets and classifiers in another language. The feature sets can be extended with the Auditory Filter Bank Temporal Envelopes (AFTE) feature set, which was a feature set that ranked second in speech classification performance based on the results of (Breebaart & McKinney, 2004).
Acknowledgment
The research presented in this paper was financially supported by NSERC (Natural Sciences and Engineering Research Council of Canada) RGPIN-2018-05714 within the project “Pattern recognition for the detection and monitoring of verbal and non-verbal alterations in Alzheimer's disease”.
CHAPTER 3
DISCUSSION
3.1 Overfitting
The objective of a good machine learning model is to generalize from the training data to any new data from the problem area. Machine learning models are trained on a set of training data, and the same model must be tested on new data (test set). This process is used to evaluate the model performances—to measure how well the model achieves on that test set. The problem is that when a machine learning algorithm is implemented, there is a possibility that the model may fit the noises of the data. This could happen when the model starts to remember various peculiarities of the training data rather than finding a general rule. This challenge is called Overfitting (D1Etterich, 1995). A good fit in machine learning is achieved (also call sweet spot) when the model fits between underfitting and overfitting. Underfitting is when a model achieves poor performance on the training data and poor generalization to other data.
To avoid overfitting, we used cross-validation with 10 folds. However, our machine learning models were tested to guarantee that overfitting does not exist, and they fit on the sweet spot. This test starts by selecting 20 Alzheimer patients randomly, 10 of them are depressive patients, and the other 10 are not. The model is tested by the 20 Alzheimer patients, while trained by the rest (256 Alzheimer patient). This process had repeated 10 times, each time a new test set is employed (20 New Alzheimer patients) with the consideration that the 20 patients are tested for the first time. Table 3.1 displays the test results.
24
Table 3.1 Overfitting test results Experiment Number SVM Random Tree Random Forest 1 70% 75% 90% 2 90% 85% 85% 3 90% 90% 85% 4 80% 95% 95% 5 80% 90% 90% 6 80% 85% 90% 7 80% 80% 80% 8 75% 80% 80% 9 80% 85% 85% 10 75% 90% 90% Standard Deviation 0.06 0.059 0.048 Average 80% 86% 87%
From table 3.1, our machine learning models are on the sweet spot—both overfitting and underfitting do not exist. We found the standard deviation of our classifiers' accuracy—the 10-time test to evaluate the stability of the classifiers. From table 3.1, the Random forest shows the most stability (0.04 standard deviation) on comparing with Random Tree and SVM. While the SVM classifier shows the lowest stability with 0.06 standard deviation.
The research strategy is divided into four steps, the first step in the research strategy is to employ all the participants based on the availability of their HAM-D test results. The second step is cleaning the data from the interviewer's voice and the silent moments. This step is to focus more on the participant's voice where the depression exists. Moreover, most of the silent moments contain many background noises. The third step is feature selection, in this research, the features are selected based on the literature review, these features are recommended in the
25
literature review for speech classification. the last step is testing a wide group of machine learning classifiers. Several machine learning classifiers are tested in this research, the best three performant classifiers are mentioned in this research. The following table is to compare the approaches used in this research with (Fraser et al., 2016).
Table 3.2 Comparison with Fraser et 2016
Fraser et al., 2016 This Research Main Objective Classify depressive AD
from Non-depressive
Classify depressive AD from Non-depressive
Participants 130 276
Cleaning the data from Pauses
No Yes
Feature Selection N.A Based on LR
Classifiers 1 3
Classification Accuracy 65.8% 91.3%
3.2 Deep learning for detecting depression on Alzheimer’s patients
In this section, we are looking to implement the task of classifying Alzheimer's patients into depressive AD and Non-Depressive AD using deep learning. Specifically, this section is a result of several experiments that are achieved using the Artificial Neural Network (ANN) to classify Alzheimer’s patients based on audio features. The same dataset used in chapter 2 (276 AD and MCI patients) is used to implement the task using ANN. These experiments are aimed to provide an idea of how this project can be extended. The results of these experiments can be used as a starting point for future research. This section is not to compare machine learning and deep learning.
26
The following audio features are employed to implement the first experiment: spectral centroid, root-mean square, zero crossings, and MFCC. Figure 3.1 shows the classification performance of ANN-based in the first experiment
Figure 3.1 The First Experiment Results of ANN
From figure 3.1, ANN achieved 72.5% classification accuracy with 75% recall and 71.1% Precision. To study the effectiveness of feature selection, on the second experiment, the feature set is changed. The following features are employed to implement the second experiment: spectral centroid, spectral roll-off point, Root mean square, zero crossings, MFCC, and Method of Moment. Figure 3.2 shows the classification performance of ANN-based in the second experiment.
27
From Figure 3.2, ANN achieved 75.1% classification accuracy with 76% recall and 62 precision. After adding the audio features Spectral roll-off point and Method of Moment, the classification accuracy has improved by (2.6%) and (1%) recall. While the precision recorded (9%) decrement. To study the effectiveness of feature selection on the classification performances, we implemented the third experiment using the following audio features: spectral centroid, spectral roll-off point, Root mean square, zero crossings, and MFCC. Figure 3.3 shows the classification performance of ANN-based in the third experiment.
Figure 3.3 The Third Experiment Results of ANN
From figure 3.3, ANN achieved 77.1% classification accuracy with 80% recall and 62% precision. After eliminating the method of moment audio feature from the feature set, the classification accuracy has improved by (2%) and (4%) recall, while the precision has not changed. The results indicate that spectral roll-off point is essential for audio classification. Where the difference between the first experiment and the third in terms of the features is the Spectral roll-off point, this difference increased the classification accuracy by (4.6%) and the recall by (5%). Therefore, we recommend using the feature set of the third experiment for related tasks and settings. Since ANN requires more data (larger dataset), and to generalize the research results, we recommend extending this study by employing a larger dataset. Also, this work can be extended by building a Convolutional Neural Networks (CNN) model to classify
28
depressive AD participants from Non-depressive AD patients and explore the classification accuracy, recall, and precision with ANN.
CONCLUSION
This research aimed to classify Alzheimer patients into depressive and non-depressive based on analysis of their speech during the Picture Description Task. We retained 276 audio records of AD patients from the Dementia Bank dataset to perform this research, of which 30% are suffering from depression. The audio features are extracted from the participant’s speech after removing the interviewer’s voice, the silences, and the noise in the signal. Our experiment was divided into two parts. The first part intended to compare three standard machine learning algorithms: Random Tree, Random Forest, and SVM. The second part was exploratory. It consisted of testing an Artificial Neural Networks (ANN) model.
For the first part, the performances (accuracy, recall, and precision) of Random Tree, Random Forest, and SVM classifiers are explored using various sets of audio features. The results reveal that MFCC’s features achieved the overall highest performance and are more appropriate with tree-based classifiers than with SVM. On the other hand, the Standard Low-Level features recommended in (Breebaart & McKinney, 2004) are more appropriate with SVM than with tree-based classifiers. These results are part of an article submitted to the Journal of Alzheimer’s disease. In the second part, we used an Artificial Neural Network (ANN) to establish a starting point for using ANN for detecting depression in Alzheimer patients. The recommended features by reference (Breebaart & McKinney, 2004), are only used to classify the participants into depressive and non-depressive. The results reveal that ANN needs more data (larger dataset) to perform this task with high classification accuracy.
The contributions of this research can be summarized in three points. The first contribution is feature selection, this process is achieved based on the literature review and previous research. The second contribution is cleaning the data from the interviewer's speech and the silent moments, this process helped to focus on the patient’s voice where the depression exists. The third contribution is employing the bootstrapping method (resample with replacement) to solve the problem of the unbalanced dataset, where 70% of patients are not suffering from
30
To validate the results of this research an Overfitting test is archived (see chapter 3, section 3.1). The result of this test shows that both random tree and random forest are stable, where both perform high-performance rates (accuracy, recall, and precision) even when the data is changed.
This research can be extended by employing more audio features such as Pitch, delta spectrum magnitude, pitch strength, band energy ratio, and others. Moreover, Auditory Filterbank Temporal Envelopes (AFTE) features can be employed, based on the results of reference (Breebaart & McKinney, 2004). The future work for this research can be accomplished by using another dataset that includes more depressive Alzheimer patients, and with a dataset in another language. This research can be a starting point for using machine learning and speech analysis to aid the medical communities in detecting depression in Alzheimer’s patients.
LIST OF BIBLIOGRAPHICAL REFERENCES
Alghowinem, S., Goecke, R., Wagner, M., Epps, J., Gedeon, T., Breakspear, M., & Parker, G. (2013). A comparative study of different classifiers for detecting depression from spontaneous speech. ICASSP, IEEE International Conference on Acoustics, Speech and
Signal Processing - Proceedings, 8022–8026.
https://doi.org/10.1109/ICASSP.2013.6639227
Alzheimer’s Association. (2018). Alzheimer’s Facts and Figures Report | Alzheimer’s Association. Alzheimer’s Association.
American Psychiatric Association. (2013). DSM-5 Diagnostic Classification. In Diagnostic
and Statistical Manual of Mental Disorders.
https://doi.org/10.1176/appi.books.9780890425596.x00diagnosticclassification
Asgari, M., Shafran, I., & Sheeber, L. B. (2014). Inferring clinical depression from speech and spoken utterances. IEEE International Workshop on Machine Learning for Signal
Processing, MLSP. https://doi.org/10.1109/MLSP.2014.6958856
Becker, J. T., Boiler, F., Lopez, O. L., Saxton, J., & Mcgonigle, K. L. (1994). The Natural History of Alzheimer’s Disease: Description of Study Cohort and Accuracy of Diagnosis.
Archives of Neurology. https://doi.org/10.1001/archneur.1994.00540180063015
Boise, L., Neal, M. B., & Kaye, J. (2004). Dementia Assessment in Primary Care: Results From a Study in Three Managed Care Systems. The Journals of Gerontology Series A:
Biological Sciences and Medical Sciences. https://doi.org/10.1093/gerona/59.6.m621
Breebaart, J., & McKinney, M. F. (2004). Features for Audio Classification. https://doi.org/10.1007/978-94-017-0703-9_6
Breiman, L. (2001). Random forests. Machine Learning. https://doi.org/10.1023/A:1010933404324
D1Etterich, T. (1995). Overfitting and Undercomputing in Machine Learning. ACM
Computing Surveys (CSUR). https://doi.org/10.1145/212094.212114
Drmota, M. (2009). Random trees: An interplay between combinatorics and probability. In
Random Trees: An Interplay Between Combinatorics and Probability.
https://doi.org/10.1007/978-3-211-75357-6
Förstl, H., & Kurz, A. (1999). Clinical features of Alzheimer’s disease. European Archives of
Psychiatry and Clinical Neuroscience. https://doi.org/10.1007/s004060050101
Fraser, K. C., Meltzer, J. A., & Rudzicz, F. (2015). Linguistic features identify Alzheimer’s disease in narrative speech. Journal of Alzheimer’s Disease, 49(2), 407–422. https://doi.org/10.3233/JAD-150520
Fraser, K. C., Rudzicz, F., & Hirst, G. (2016). Detecting late-life depression in Alzheimer’s
disease through analysis of speech and language. 1–11.
https://doi.org/10.18653/v1/w16-0301
Gauthier, S., Reisberg, B., Zaudig, M., Petersen, R. C., Ritchie, K., Broich, K., … Saeed, M. (2006). International Psychogeriatric Association Expert Conference on mild cognitive impairment. Lancet (London, England). https://doi.org/10.3115/1654641.1654645 Goodglass, H., & Kaplan, E. (1983). The Assessment of Aphasia and Related Disorders (2nd
edition). In Boston diagnostic aphasia examination booklet.
32
Thal, L. J. (2004). Mild Cognitive Impairment Can Be Distinguished from Alzheimer Disease and Normal Aging for Clinical Trials. Archives of Neurology. https://doi.org/10.1001/archneur.61.1.59
Hall, M., National, H., Frank, E., Holmes, G., Pfahringer, B., Reutemann, P., & Witten, I. H. (2009). The WEKA Data Mining Software : An Update. ACM SIGKDD Explorations
Newsletter.
HAMILTON, M. (1960). A rating scale for depression. Journal of Neurology, Neurosurgery,
and Psychiatry. https://doi.org/10.1136/jnnp.23.1.56
Hardy, J., & Allsop, D. (1991). Amyloid deposition as the central event in the aetiology of Alzheimer’s disease. Trends in Pharmacological Sciences. https://doi.org/10.1016/0165-6147(91)90609-V
Hernández-Domínguez, L., Ratté, S., Sierra-Martínez, G., & Roche-Bergua, A. (2018). Computer-based evaluation of Alzheimer’s disease and mild cognitive impairment patients during a picture description task. Alzheimer’s and Dementia: Diagnosis,
Assessment and Disease Monitoring. https://doi.org/10.1016/j.dadm.2018.02.004
Hosseinifard, B., Moradi, M. H., & Rostami, R. (2013). Classifying depression patients and normal subjects using machine learning techniques and nonlinear features from EEG signal. Computer Methods and Programs in Biomedicine, 109(3), 339–345. https://doi.org/10.1016/j.cmpb.2012.10.008
Korczyn, A. D., & Halperin, I. (2009). Depression and dementia. Journal of the Neurological
Sciences. https://doi.org/10.1016/j.jns.2009.02.346
L., G., L., M., W., T., S., de S., R., Z., E., P., … P., M. (2012). Alzheimer’s disease markers, hypertension, and gray matter damage in normal elderly. Neurobiology of Aging.
Lee, H. B., & Lyketsos, C. G. (2003). Depression in Alzheimer’s disease: Heterogeneity and related issues. Biological Psychiatry. https://doi.org/10.1016/S0006-3223(03)00543-2 Li, D., Sethi, I. K., Dimitrova, N., & McGee, T. (2001). Classification of general audio data
for content-based retrieval. Pattern Recognition Letters. https://doi.org/10.1016/S0167-8655(00)00119-7
Lyketsos, C. G., Steele, C., Baker, L., Galik, E., Kopunek, S., Steinberg, M., & Warren, A. (1997). Major and minor depression in Alzheimer’s disease: Prevalence and impact.
Journal of Neuropsychiatry and Clinical Neurosciences.
https://doi.org/10.1176/jnp.9.4.556
M. TANVEER, RICHHARIYA, B., KHAN, R. U., RASHID, A. H., KHANNA, P., PRASAD, M., & LIN, C. T. (2019). Machine learning techniques for thyroid disease diagnosis - A review. ACM Transactions on Multimedia Computing, Communications and
Applications., 9(28), 0–28. https://doi.org/10.17485/ijst/2016/v9i28/93705
M. Tucker, A., & Stern, Y. (2011). Cognitive Reserve in Aging. Current Alzheimer Research. https://doi.org/10.2174/1567211212225912050
McEnnis, D., McKay, C., Fujinaga, I., & Depalle, P. (2005). Audio: A feature extraction library. ISMIR 2005 - 6th International Conference on Music Information Retrieval. Milwain, E. J., & Nagy, Z. (2005). Depressive symptoms increase the likelihood of cognitive
impairment in elderly people with subclinical Alzheimer pathology. Dementia and
Geriatric Cognitive Disorders. https://doi.org/10.1159/000080971
Modrego, P. J., & Ferrández, J. (2004). Depression in patients with mild cognitive impairment increases the risk of developing dementia of Alzheimer type: A prospective cohort study.
33
Archives of Neurology. https://doi.org/10.1001/archneur.61.8.1290
Morris, J. C., Storandt, M., Miller, J. P., McKeel, D. W., Price, J. L., Rubin, E. H., & Berg, L. (2001). Mild cognitive impairment represents early-stage Alzheimer disease. Archives of
Neurology. https://doi.org/10.1001/archneur.58.3.397
O’Shaughnessy, D. (2008). Invited paper: Automatic speech recognition: History, methods and challenges. Pattern Recognition. https://doi.org/10.1016/j.patcog.2008.05.008
Paradise, M., Cooper, C., & Livingston, G. (2009). Systematic review of the effect of education on survival in Alzheimer’s disease. International Psychogeriatrics. https://doi.org/10.1017/S1041610208008053
Petersen, R. C., Lopez, O., Armstrong, M. J., Getchius, T. S. D., Ganguli, M., Gloss, D., … Rae-Grant, A. (2018). Practice guideline update summary: Mild cognitive impairment report of theguideline development, dissemination, and implementation. Neurology. https://doi.org/10.1212/WNL.0000000000004826
Preacher, K. J., & Hayes, A. F. (2008). Asymptotic and resampling strategies for assessing and comparing indirect effects in multiple mediator models. Behavior Research Methods,
40(3), 879–891. https://doi.org/10.3758/BRM.40.3.879
Shim, Y. S., & Yang, D. W. (2006). Depression as prognostic factor: 6 months follow-up in a geriatric institution. Archives of Gerontology and Geriatrics. https://doi.org/10.1016/j.archger.2005.11.002
Smailagic, N., Vacante, M., Hyde, C., Martin, S., Ukoumunne, O., & Sachpekidis, C. (2015). 18F-FDG PET for the early diagnosis of Alzheimer’s disease dementia and other dementias in people with mild cognitive impairment (MCI). Cochrane Database of
Systematic Reviews. https://doi.org/10.1002/14651858.CD010632.pub2
Smola, A. J., & Schölkopf, B. (2004). A tutorial on support vector regression. Statistics and
Computing. https://doi.org/10.1023/B:STCO.0000035301.49549.88
Taler, V., & Phillips, N. A. (2008). Language performance in Alzheimer’s disease and mild cognitive impairment: A comparative review. Journal of Clinical and Experimental
Neuropsychology. https://doi.org/10.1080/13803390701550128
Thorpe, L. (2009). Depression vs. dementia: how do we assess? The Canadian Review of
Alzheimer’s Disease and Other Dementias.
Wilson, R. S., Barral, S., Lee, J. H., Leurgans, S. E., Foroud, T. M., Sweet, R. A., … Bennett, D. A. (2011). Heritability of different forms of memory in the late onset alzheimer’s disease family study. Journal of Alzheimer’s Disease. https://doi.org/10.3233/JAD-2010-101515
Zimmerman, M., Martinez, J. H., Young, D., Chelminski, I., & Dalrymple, K. (2013). Severity classification on the Hamilton depression rating scale. Journal of Affective Disorders. https://doi.org/10.1016/j.jad.2013.04.028