Science Arts & Métiers (SAM)
is an open access repository that collects the work of Arts et Métiers Institute of
Technology researchers and makes it freely available over the web where possible.
This is an author-deposited version published in: https://sam.ensam.eu Handle ID: .http://hdl.handle.net/10985/11235
To cite this version :
Thierry PALIN-LUC, Serge LASSERRE, J-Y. BERARD - Experimental Investigation on the Significance of the Conventional Endurance Limit of a Spheroidal Graphite Cast Iron - Fatigue & Fracture of Engineering Materials & Structures - Vol. 21, n°2, p.191–200 - 1998
Any correspondence concerning this service should be sent to the repository Administrator : archiveouverte@ensam.eu
EXPERIMENTAL INVESTIGATION ON THE SIGNIFICANCE OF THE
CONVENTIONAL ENDURANCE LIMIT OF A SPHEROIDAL
GRAPHITE CAST IRON
T. Palin-Luc,1 S. Lasserre1 and J.-Y. Berard2 1Ecole Nationale Supe´rieure d’Arts et Me´tiers, CER de Bordeaux,
Laboratoire Mate´riaux Endommagement Fiabilite´ (LA.M.E.F.), Esplanade des Arts et Me´tiers, F-33405 Talence Cedex, France
2RENAULT, Direction de l’Inge´nierie des Mate´riaux, 860 quai de Stalingrad, F-92109 Boulogne Cedex, France
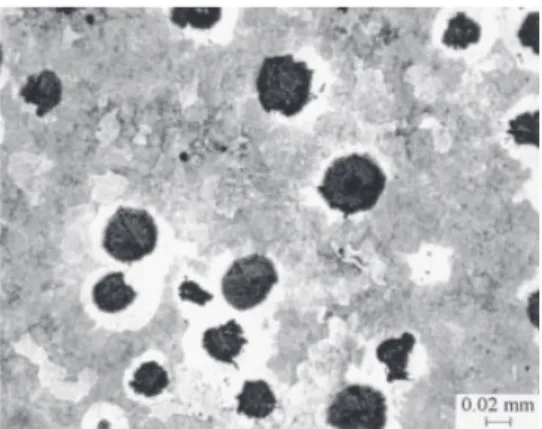
Abstract—Fatigue tests were performed on a spheroidal graphite cast iron in four point plane bending under constant stress amplitude and block loading conditions. The microstructure of this material has a ‘bull’s eyes’ appearance, i.e. the spheroids of graphite are surrounded by ferrite and these nodules and ferrite zones are included in a pearlitic matrix. Scanning electronic microscope observations were carried out at different fractions of life for constant stress amplitude loadings above and below the conventional endurance limit. Non-propagating micro-cracks were observed at a stress level equal to the conventional endurance limit. These observations showed that another limit can be defined below the conventional endurance one, i.e. one below which micro-cracks were not observed to initiate in the matrix. These cracks were found to arrest at the ferrite/pearlite interface when the material was tested below this new limit. This concept was used to rationalize fatigue results from tests with loading in blocks above and below the conventional endurance limit.
Keywords—Cast iron; High cycle fatigue; Endurance limit; Small load cycles; Crack initiation; SEM observations.
NOMENCLATURE a=half-surface crack length
A=elongation at failure in tension c=crack depth of a surface crack E=Young’s modulus
Kmax=maximum of the stress intensity factor during a loading cycle Rs=stress ratioS=stress amplitude in fully reversed plane bending
Sd=endurance limit in fully reversed plane bending (cylindrical specimen)
Sd(sq)=endurance limit in fully reversed plane bending (specimen with square cross-section) Sm=maximum tensile strength
Y0.02=yield stress with a plastic strain of 0.02%n=Poisson ratio INTRODUCTION
Many mechanical parts of components which require a high reliability are produced in spheroidal graphite cast iron: crankshafts, connecting rods, suspension arms, gears, etc. They are usually subjected to variable amplitude loading and design departments have to use cumulative damage rules to predict their fatigue life. Random loading, as applied on industrial components, is very often below the conventional endurance limit of the material. Gassner [1] showed that small cycles ( below the endurance limit) participate in the damage process. According to the authors, the Lemaitre and Chaboche cumulative high cycle damage rule [2,3] is the only one which predicts the influence of these small cycles when larger cycles have been previously applied. But the effect
of these cycles on the lifetime of spheroidal graphite cast iron is not very well understood. The aim of this work is to understand the effect of small cycles on the lifetime of the material as a function of their amplitude.
Several studies have already proved that the endurance limit of a spheroidal graphite cast iron is not a limit of damage initiation but is a limit of the non-propagation of micro-cracks [4–6]. In order to try to understand the damage processes of such a material when loaded around its conventional endurance limit, scanning electronic microscope (SEM) observations have been performed in the study reported here using the interrupted test technique. Furthermore, cumulative damage tests under two stress amplitudes (alternatively applied on specimens in blocks until failure) were rationalized using the observations of the damage process under constant amplitude loading.
SCANNING ELECTRON MICROSCOPE OBSERVATIONS Material and specimens
The test material was a spheroidal graphite cast iron with a pearlitic matrix (close to FGS 800-2 AFNOR standard) as used in the production of engine crankshafts. Ferrite was localized around the spheroids of graphite, with the ferrite and nodules included in a pearlitic matrix. This structure is called ‘bull’s eyes’ (Fig. 1). The chemical composition of this material was as follows (wt%): C=3.50–3.90, Si=1.80–2.80, Mn=0.85, Cu=0.03, Sn=0.01, Ni=0.03, S<0.02, P<0.05. After the heat treatment of heating and holding at 920°C for 1–2 h, slow cooling at 870°C for 3–4 h, then air cooling, the main mechanical characteristics of this cast iron are as follows: Young’s modulus=164.9 GPa, Poisson’s ratio=0.275, Proof (0.02%) stress=320 MPa, Sm=795 MPa, A=9%, Sd=280 MPa, Sd(sq)=268 MPa.
All the specimens used in this study were machined from the counterbalances of crankshafts after casting and the heat treatment described above. Parallelepiped blocks were cut in the counterbalances as indicated in Fig. 2(A) and then specimens were machined from these blocks to dimensions shown in Fig. 2(B). The testing area was ground and polished with emery paper of 1000 grade and finished with diamond powder (2mm grain size).
A resonance electro-dynamic testing machine was used for fatigue tests under fully reversed plane bending at an operating frequency of about 110 Hz.
(A)
(B)
Fig. 2. (A) specimen locations in the crankshaft counterbalance; (B) geometry of specimens (dimensions in mm).
Experimental procedure
Five specimens of square cross-section (Fig. 2(B)) were loaded in fully reversed four point plane bending under constant stress amplitude. Their conventional endurance limit (infinite life) under this loading is Sd(sq)=268 MPa. Four stress amplitudes were chosen: 280, 268, 230 and 180 MPa. According to the S–N curve of the material the probabilities of failure before 106 cycles under the stress amplitudes 280 and 268 MPa, respectively, are: 0.50 and 0.12. For 230 and 180 MPa these probabilities of failure are less than 3×10⁻⁶ which are low enough to consider that the behaviour of the specimens loaded under these amplitudes was not representative of any phenomenon linked with the endurance limit. Each specimen was loaded under one of these stress amplitudes and then observed in the SEM during test interruptions. However, under 268 MPa two specimens were tested.
The testing area of all the specimens was observed at six different damage levels: virgin specimen (before any loading), after 5×10⁴, 1.5×10⁵, 3×10⁵, 4.5×10⁵ and 106 cycles. No micro-crack was observed at the surface of any of the specimens before testing. After 106 cycles two observation series were done: before and after nital etching of the test area in order to distinguish ferrite from pearlite.
Crack initiation
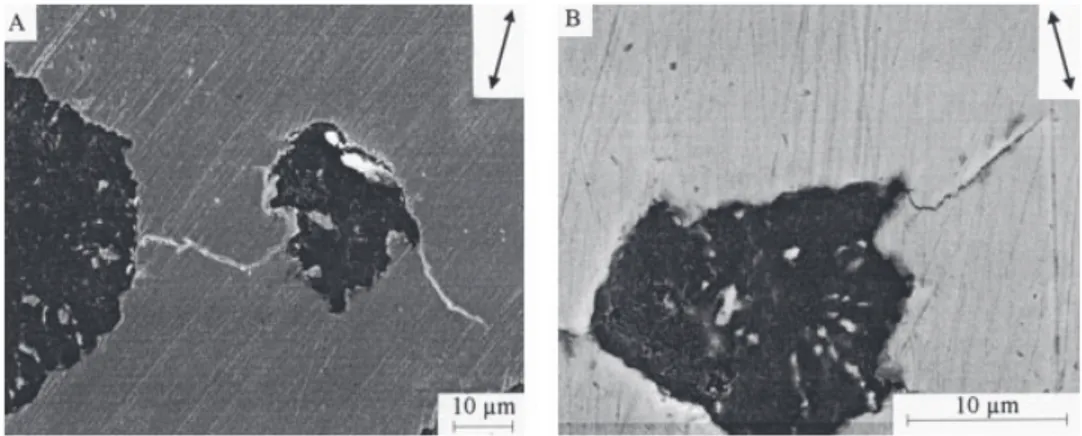
Cracks were found to initiate around the graphite nodules; this is already well-known [4–7]. But these observations also showed that micro-cracks usually initiated at spheroids which are in one of the following situations:
(i) either the distance between two spheroids is less than 20mm which is approximately the diameter of spheroids (Fig. 3(A));
(ii) or the shape of the spheroid is very irregular and a micro-crack initiated at a spheroid sharp edge (Fig. 3(B)).
The high stress concentrations generated by the spheroids in these two cases explained the crack initiation behaviour.
It has to be noted that micro-cracks existed after only 50,000 cycles even on the specimen loaded at the endurance limit (268 MPa) and at 230 MPa. Damage (in terms of micro-cracks) initiated very early in the life of the specimen. But before 300,000 cycles no micro-crack longer than 10mm was observed on the specimen loaded at 180 MPa.
Crack growth
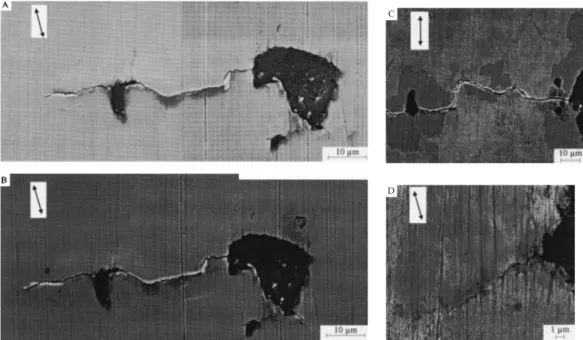
Under the three higher stress levels (280, 268 and 230 MPa) several micro-cracks initiated and propagated between zero and 150,000 cycles. After this number of cycles, micro-cracks did not evolve significantly (see Fig. 4(A) and (B)). On the specimen loaded at 180 MPa, the micro-cracks which appeared between 150,000 and 300,000 cycles did not grow, even after 106 cycles. They were always very small (Fig. 4(D)).
The observations on specimens after a nital etching showed that micro-cracks had propagated across the pearlitic matrix of the material when the specimens were loaded at the three higher stresses (see example in Fig. 4(C)). On the specimen loaded at the lower stress amplitude, 180 MPa, micro-cracks never propagated across the matrix, i.e. they never propagated through the boundary between ferrite and pearlite even after 106 cycles of loading (Fig. 4(D)).
It can be concluded that the matrix of the material keeps its mechanical integrity when the material is loaded at 180 MPa even after 106 cycles. For higher stress amplitudes, micro-cracks will initiate within the pearlitic matrix.
Evolution of the surface density of micro-cracks
Counting of the micro-cracks on the surface of the specimens at different damage levels was performed to quantify the previous qualitative observations. The surface of the counting area was 0.705 mm2, it was observed at a magnification of 120 times. The same location on each specimen
Fig. 3. SEM observations of a specimen surface loaded at (A) 280 MPa, (B) 268 MPa; each after 50,000 cycles. Arrows indicate loading direction.
Endurance limit of a spheroidal graphite cast iron
C
D
Fig. 4. SEM observations of a specimen surface. Arrows indicate loading direction. (A) loaded at 268 MPa for 150,000 cycles, (B) loaded at 268 MPa for 106 cycles. (C) 268 MPa for 106 cycles; after a nital etching.
(D) 180 MPa for 106 cycles; after a nital etching.
was scanned. The evolution of the surface density of micro-cracks as a function of the number of cycles is shown in Fig. 5.
For the specimen loaded at a stress amplitude of 180 MPa, the surface density of micro-cracks increases more slowly than for the other specimens loaded at higher stresses. The first micro-cracks appear between 150,000 and 300,000 cycles for a stress amplitude of 180 MPa while they initiate before 50,000 cycles for the higher stress amplitudes as shown in Fig. 5.
Furthermore, the curves in Fig. 5 flatten out and have an horizontal asymptote. It seems to prove that the number of micro-cracks does not evolve when the number of loading cycles tends to infinity (>106 cycles). This conclusion has to be moderated because the counting method used
to draw these curves did not take into account the micro-cracks which have coalesced between two observation stages. When two micro-cracks coalesced only one micro-crack was counted. Nevertheless, this disadvantage of the method is not important for the significance of Fig. 5 for the number of cycles below 300,000. Up to this number only a few coalescences were observed; at the lowest stress amplitude no coalescence was ever observed.
The curves shown in Fig. 5, corresponding to the two specimens loaded at 268 MPa, are somewhat different from each other. This difference is probably due to the very large scatter of the number of cycles to failure when the stress level is near the endurance limit. On one of these two specimens a macro-crack was detected after 933,500 cycles in the fatigue testing machine; the test was stopped. This specimen was probably a ‘weak specimen’.
Damage evolution in terms of micro-cracks is different for a specimen loaded at 180 MPa compared with those loaded at 230 MPa or at higher stresses.
CUMULATIVE DAMAGE TESTS T esting method
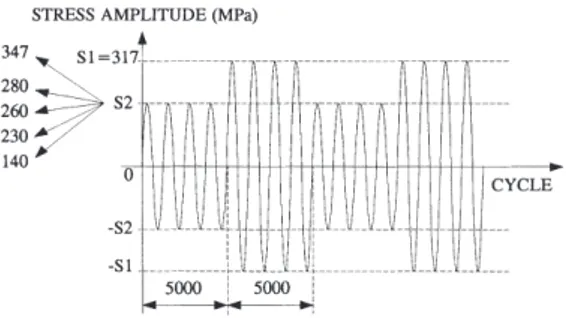
Cumulative damage tests, in a stress-block format, have been done on smooth cylindrical specimens (Fig. 6) in the same material as before. The specimens were ground; the roughness of the median torus is such that Ra<0.2 mm. This torus creates a theoretical stress concentration factor of 1.07 in bending. Each specimen was loaded in four point plane bending; each loading was composed of two different types of blocks (low and high) alternatively applied to the specimen until failure (Fig. 7). The block duration was fixed at 5000 cycles. Transition between two blocks was less than 10 cycles at the operating frequency of 50 Hz. This can be neglected when compared with the duration of one block.
These tests were done on a closed-loop servo-hydraulic multiaxial fatigue testing machine designed at LA.M.E.F. [8]. This machine measures the stiffness variation of the specimen to detect a macro-crack and then stops the test. Using this technique, cracks of 0.5 mm in depth can be detected over a cross-sectional area of 80 mm2.
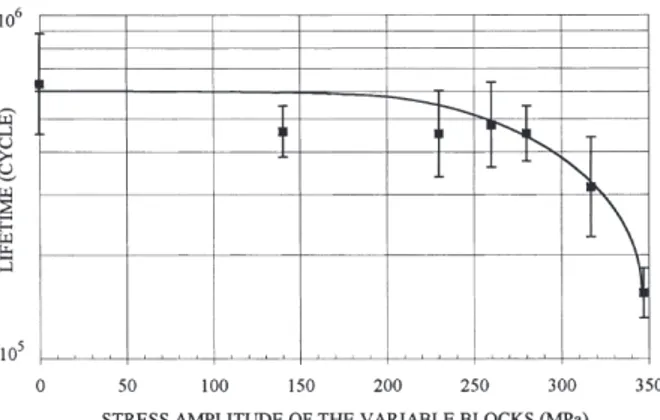
Five test series were carried out. Several loadings were applied on 50 specimens (10 in a series). One type of block was fixed to a fully reversed stress amplitude S1 of 317 MPa (above the endurance limit), the corresponding median life on the S–N curve is 315,000 cycles. Five different stress amplitudes S2 were tested for the second type of block: 140, 230, 260, 280 and 347 MPa (Fig. 7). In plane bending, the conventional endurance limit of the specimens used (Fig. 6) is Sd=280 MPa; this is different from the limit of the specimens with a square cross-section Sd(sq) [9]. Under a loading where the two blocks have the same amplitude (317 MPa) the lifetime is
Fig. 6. Specimen used for cumulative damage tests Fig. 7. Loading in blocks. S1 is the same for all the (dimensions in mm). specimens, S2 is specimen-dependent.
given by the S–N curve under constant amplitude. Under a loading where the low stress amplitude is equal to zero the lifetime is supposed to be twice the lifetime under only the high amplitude S1, i.e. 630,000 cycles.
T est results and discussion
The cumulated frequency method was used to analyse these results. Before using this method the Kolmogorov Smirnov [10] and the Shapiro Wilk [11] statistical hypothesis tests were used to verify that lifetime can be considered as a log-normal variable under this type of loading [9].
Fatigue test results are shown in Fig. 8. This figure shows the lifetime as a function of the different stress amplitudes S2 used in tests. The points represent the median lives, the bar lines show the standard deviation of the lifetime. Note that 68% of the test results are within each scatter band.
Figure 8 shows that the total life of the specimens under block loading (with blocks below the endurance limit) is shorter than the expected life if these blocks did not contribute to the damage process. On the tested spheroidal graphite cast iron specimens, blocks below the endurance limit participate in damage when they are applied to specimens with other blocks above the endurance limit. Furthermore, the curve of Fig. 8 proves that when the amplitude of the low blocks is higher than about 210–250 MPa, their influence is more significant than when they are below 210 MPa. According to these test results, it seems that a new limit exists below the conventional endurance limit. The influence of blocks with a stress amplitude between this new limit and the endurance one is very important on the lifetime of the material. This is not the case for stress amplitudes below this new limit.
DISCUSSION Crack initiation sites
In many papers [4,5,7,12] it has been shown that the endurance limit of spheroidal graphite cast iron is related to the propagation of micro-cracks initiated from microshrinkages, not from nodules. In the present study, the fracture surfaces of specimens were examined by SEM but no microshrinkage was observed. The observed crack initiation sites were large graphite nodules and irregularly shaped graphite clusters at or near the surface of the specimens; such initiation sites are well known [4,7]. A possible explanation of no microshrinkage is linked to the location where
specimens were cut from the crankshafts. Specimens were produced from cast iron which was located far from the geometric centre of the crankshaft (Fig. 2). In such an area of the component, which is not the last solidification area of liquid metal, there is very little chance to find microporosi-ties. On the contrary, when the specimens are machined at the centre of cast rods [4,6,12] or from large blocks [7] there is a greater probability to have porosities because specimens are made with the last solidified metal.
According to this explanation one can think that this study is relevant to either a cast iron produced in very good casting and cooling conditions or a cast iron located in component areas without porosities.
Crack growth
To try to explain and quantify why micro-cracks are arrested we calculated the values of the stress intensity factor by using linear elastic fracture mechanics since all the tests were carried out at a stress level below the yield strength of the material.
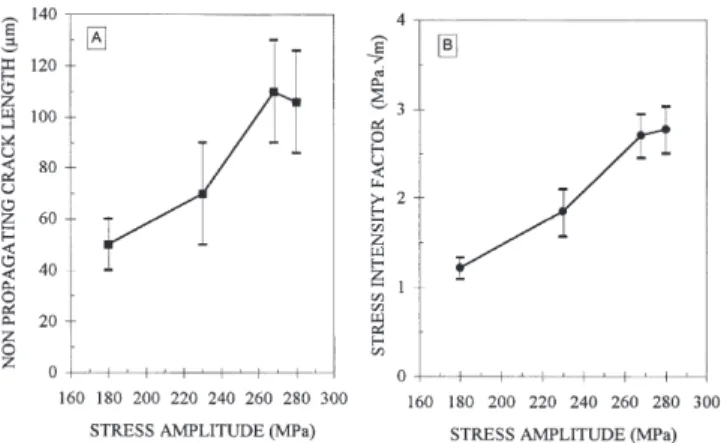
A number of assumptions have to be made about the equilibrium shape of the observed micro-cracks. We have supposed (as proposed in [4] and [6]) that micro-cracks are in one of the configurations illustrated by Fig. 9. Even if the apparent size of a nodule at the surface is small we suppose, as suggested in [6], that the nodules behave like holes which give rise to the formation of a crack on their equatorial plane. With this assumption, Fig. 10(A) illustrates the non-propagat-ing crack length (2a) observed on the surface of the tested specimens versus the stress amplitude.
Fig. 9. Three-dimensional aspect of a micro-crack around a spheroid (from [4,6]).
Fig. 10. The effect of stress amplitude on (A) non-propagating crack length, 2a, and (B) maximum value of the stress intensity factor.
Each scatter band represents 68% of the measured crack lengths 2a (5 to 10 micro-cracks at each stress amplitude.
For a plate specimen, with finite thickness t, in a bending configuration the real crack shape at equilibrium is a semi-circle [13] such that c/a=1. By using the results of Scott and Thorpe [13] we have plotted in Fig. 10(B) the maximum of the stress intensity factor, Kmax, versus the stress amplitude applied to the specimen; dark marks represents the Kmax value corresponding to the mean value of crack length, each segment shows the scatter associated with the scatter of crack length (values calculated with 5 to 10 micro-cracks). These values of Kmax were calculated at the intersection AA∞ between the nodule and the specimen surface (Fig. 9), where its value is higher than along the other parts of the particule contour [6].
The fatigue tests reported in this study were done in plane bending with Rs=Smin/Smax=−1. It is difficult to compare the previous values of Kmax with the values given in the literature because they are usually given for a stress ratio Rs>0. Nevertheless, we can see in Fig. 10(B) that at the endurance limit (Sd(sq)=268 MPa) of the specimen Kmax=2.7 MPa앀m for cracks arrested in the pearlitic matrix. This value is close to the threshold value reported in [6] for tests with plate specimens loaded in plane bending (Rs=0.1) at their endurance limit, i.e. Kmax=3.1 MPa앀m; this value corresponds to short cracks ( length of about 0.1 mm) arrested in the matrix of a ferritic spheroidal graphite cast iron. For the micro-cracks which are arrested at the interface between ferrite and pearlite (specimen loaded at 180 MPa) the stress intensity factor is small, Kmax# 1 MPa앀m, compared with the corresponding value at the endurance limit. We can conclude that this is an approximate value of the threshold of the stress intensity factor for micro-cracks arrested at the ferrite/pearlite interface for a bull’s eyes cast iron.
All the previous calculations of stress intensity factors overestimate the true values because the nodule planes were considered as cracks [6]. Nevertheless, these values are in agreement with the literature.
CONCLUSIONS
The SEM observations performed have confirmed that many micro-cracks exist at the surface of specimens loaded at their endurance limit; the threshold value of the stress intensity factor corresponding to micro-cracks arrested in pearlite is in agreement with data presented in the literature. These micro-cracks initiate very quickly, i.e. as early as the first 50,000 cycles.
These observations have shown that for the spheroidal graphite cast iron tested in fully reversed four point plane bending a new limit (around 210 MPa) can be defined below the conventional endurance limit (268 MPa). Below this new limit, the matrix of the material keeps its mechanical integrity, i.e. there is no micro-crack even after 106 cycles of loading. The threshold value of the stress intensity factor corresponding to this new limit is three times lower than the threshold value at the endurance limit. This low threshold corresponds to the arrest of micro-cracks at the interface between ferrite and pearlite in this bull’s-eyes cast iron.
The results of the cumulative damage tests show that stress cycle blocks below the usual endurance limit contribute to crack propagation. Their influence on the lifetime of the material is very important if their amplitude is between 210 and 268 MPa for this material, i.e. between the new limit shown by SEM observations and the conventional endurance limit.
Many other tests and observations have to be done, in torsion for instance, and under variable amplitude loadings in order to determine if these conclusions can be extended to other types of loadings. It would be very interesting to test other materials with the same procedure. SEM observations with the interrupted test technique under variable amplitude loadings have also to
be carried out. Such work should help us to best understand the influence of small cycles ( below the conventional endurance limit) on the lifetime in high cycle fatigue and variable amplitude loading.
Acknowledgements—This work was carried out as part of a research contract with the Materials Engineering Department of RENAULT and so RENAULT is gratefully acknowledged for enabling the authors to do this work. The authors are thankful to D. Bouffet and J. P. Charlopeau for performing the SEM observations.
REFERENCES
1. E. Gassner (1977) Fatigue resistance of various materials under random loading. In: Proc. 9th ICAF Symposium. LBF-TR 136, S.3.5/1.34.
2. J. Lemaitre and J. L. Chaboche (1978) Aspect phe´nome´nologique de la rupture par endommagement. J. Me´canique Appl.2, 317–365.
3. M. Chaudonneret and J. L. Chaboche (1986) Fatigue life of notched specimens. In: Proc. Int. Conf. on Fatigue of Engineering Materials and Structures. Sheffield, UK, pp. 503–509.
4. P. De Roo and P. Clement (1987) Influence des petits de´fauts sur la re´sistance en fatigue d’une fonte GS ferritique. Fonderie—Fondeur d ’Aujourd ’hui64, 30–37.
5. F. De Mestral and L. Haenny (1985) Comportement en fatigue oligocyclique d’une fonte GS de traitement thermique. Me´moires et Etudes Scientifiques, Revue de Me´tallurgie, March, 109–119.
6. P. Clement, J. P. Angeli and A. Pineau (1984) Short crack behaviour in nodular cast iron. Fatigue Fract. Engng Mater. Struct.7, 251–265.
7. C.-K. Lin, P.-K. Lai and T.-S. Shih (1996) Influence of microstructure on the fatigue properties of austempered ductile irons—I. High-cycle fatigue. Int. J. Fatigue18, 297–307.
8. T. Palin-Luc and S. Lasserre (1994) Multiaxial fatigue testing machine under variable amplitude loading of bending and torsion. In: Recent Advances in Experimental Mechanics, Vol. 2 (Edited by J. F. Silva Gomes et al.). A. A. Balkema, pp. 965–970.
9. T. Palin-Luc (1996) Fatigue multiaxiale d’une fonte GS sous sollicitations combine´es d’amplitude variable. Ph.D. thesis, E.N.S.A.M. CER de Bordeaux, France.
10. M. Schwob and G. Perache (1969) T raite´ de fiabilite´. Masson et Cie, Paris.
11. AFNOR (1991) Etude de la normalite´ d ’une distribution. Norme NF X 06-050, Paris.
12. B. Ostensson (1973) Influence of microshrinkage cavities on the endurance limit of nodular cast iron. J. Iron Steel Inst.211, 628–631.
13. P. M. Scott and T. W. Thorpe (1981) A critical review of crack tip stress intensity factors for semi-elliptic cracks. Fatigue Fract. Engng Mater. Struct.4, 291–309.