HAL Id: dumas-02975357
https://dumas.ccsd.cnrs.fr/dumas-02975357
Submitted on 22 Oct 2020HAL is a multi-disciplinary open access archive for the deposit and dissemination of sci-entific research documents, whether they are pub-lished or not. The documents may come from teaching and research institutions in France or abroad, or from public or private research centers.
L’archive ouverte pluridisciplinaire HAL, est destinée au dépôt et à la diffusion de documents scientifiques de niveau recherche, publiés ou non, émanant des établissements d’enseignement et de recherche français ou étrangers, des laboratoires publics ou privés.
Evaluation of the impact of Atlantic salmon ecological
restoration in the Garonne-Dordogne basin thanks to
DNA fingerprints
Louarn Fauchet
To cite this version:
Louarn Fauchet. Evaluation of the impact of Atlantic salmon ecological restoration in the Garonne-Dordogne basin thanks to DNA fingerprints. Life Sciences [q-bio]. 2020. �dumas-02975357�
Evaluation de l’impact de la restauration
écologique du saumon Atlantique dans le bassin
Garonne-Dordogne grâce aux empreintes
génétiques
Par : Louarn FAUCHET
AGROCAMPUSOUEST CFR Angers CFR Rennes
Année universitaire : 2019 - 2020 Spécialité : Ingénieur agronome
Spécialisation : Sciences halieutiques et Aquacoles
Option : Aquaculture
Mémoire de fin d’études
d’Ingénieur de l’Institut Supérieur des Sciences agronomiques, agroalimentaires, horticoles et du paysage
de Master de l’Institut Supérieur des Sciences agronomiques, agroalimentaires, horticoles et du paysage
d'un autre établissement (étudiant arrivé en M2)
Soutenu à Rennes le 18 septembre 2020
Devant le jury composé de : Président : Dominique OMBREDANE Maître de stage : Anastasia BESTIN,
Enseignants référents : Dominique OMBREDANE et
Etienne RIVOT
Autres membres du jury : Sophie Launey
Les analyses et les conclusions de ce travail d'étudiant n'engagent que la responsabilité de son auteur et non celle d’AGROCAMPUS OUEST
Ce document est soumis aux conditions d’utilisation
«Paternité-Pas d'Utilisation Commerciale-Pas de Modification 4.0 France» disponible en ligne
REMERCIEMENTS
Ce projet n’aurait pas abouti sans l’aide de mes précieux encadrants que je souhaite remercier au cours de ces quelques lignes. En premier lieu je voudrais remercier toute l’équipe de MIGADO qui m’a accompagnée au cours du stage. Merci à Stéphane Bosc, toujours à l’écoute qui a pu répondre à mes nombreuses interrogations tout au long du stage, même les plus complexes. Merci aussi à Isabelle Caut pour ses encouragements et félicitations et sa visite des installations de MIGADO en Dordogne au mois de mars. Enfin merci aux techniciens et chargés de mission de MIGADO, notamment Olivier Menchi, grâce à qui j’ai pu avoir accès aux nombreuses données de ces dernières années. Je remercie aussi bien évidemment Anastasia Bestin ma maître de stage qui m’a accompagné au long de ce stage, et qui malgré le peu de contact visuel dû au confinement a toujours su m’orienter dans la bonne direction pour la rédaction de ce rapport de stage. Merci aussi à Pierrick Haffray, également membre du SYSAAF pour son implication croissante dans le projet, qui m’a permis d’aller plus loin dans ce stage et de voir au-delà du simple rapport scientifique, à savoir les enjeux écologiques mais aussi politiques et économiques de ces actions de restauration écologique. Je souhaite aussi remercier Guillaume Evanno qui m’a accompagné sur les aspects génétiques du projet et notamment qui m’a apporté de l’aide sur les nombreux logiciels à ma disposition. Il aura été de très bon conseil. Enfin merci à Marc Vandeputte qui m’a aidé sur tous les aspects du projet et qui par son exigence de correction a permis de rendre ce rapport tel qui l’est aujourd’hui.
LIST OF FIGURES
Figure 1: Evolution of Atlantic salmon fisheries and aquaculture in tons Figure 2: Atlantic salmon life cycle
Figure 3. Salmon rivers in France – Where and what is being done. Figure 4: Study workflow since 2008
Figure 5: MIGADO production scheme
Figure 6: Maps showing stocking area (a). Number of stocked fish (b)
Figure 7: Monitored and sampled population –Average for years 2012 to 2019
Figure 8: Comparison between stocked salmons and their assigned migrants in the basins and
the rivers of the study between 2008 and 2015
Figure 9: Sea-winter population structure comparison between homed and strayed salmon –
Year 2008-2015
Figure 10: Relation between F1 migrants sea-age phenotype and F0 sea-age phenotype Figure 11: Number of years spent in the F0 Bergerac center in average for each spawning year Figure 12: Comparison between the spawn participation and the produced migrants for F0
females, depending their number of years spent in hatchery. 2008-2015
Figure 13: Effective size of the F0 broodstock and genetic diversity loss between F0 and F1 Figure 14: Number and proportion of wild born and hatchery born salmons in the basins
LIST OF TABLES
Table 1: Assignment rate for F1 offspring
Table 2: Distribution of sea winters (SW) in the sampled (Sam.) and monitored (Mon.) Atlantic
salmon population in the Garonne Dordogne basin from 2012 to 2019
Table 3: Assigned migrants and headcount stocked between 2008 and 2015. Table 4: Genetic diversity indices for all groups of salmon
Table 5: Genetic diversity indices for returning migrants (cohorts 2010 to 2019)
LIST OF ANNEX
Table of contents
1. Introduction ... 1
2. Materials and Methods ... 6
2.1 MIGADO production scheme ... 6
2.1.1 Population monitoring ... 7
2.1.2 Fish trapping ... 7
2.1.3 Breeding plan creation ... 7
2.1.4 Stocking strategy ... 9
2.2 Parentage assignment as a monitoring tool ... 11
2.2.1 Principles of parentage assignment ... 11
2.2.2 Assignment power of the microsatellite panel ... 11
2.2.3 Identification of wild-born individuals from known parents ... 11
2.3 Data analysis... 12
2.3.1 Sampling analysis ... 12
2.3.2 Stocking analysis ... 12
2.3.3 Straying rate analysis ... 12
2.3.4 Sea-winter phenotype analysis ... 13
2.3.5 Broodstock and breeding plan evaluation ... 13
2.3.6 Evaluation of genetic diversity loss between generations ... 13
2.3.7 Genetic analysis of the population in the basin ... 13
2.3.8 Software used ... 14
3. Results ... 14
3.1 Study validation ... 14
3.1.1 Validation of the parentage assignment panel ... 14
3.1.2 Sampling validation in terms of age at sea structure ... 15
3.2 Analyses of the stocked population ... 16
3.2.1 What does influence the return rate? ... 16
3.2.2 What does influence straying rate? ... 18
3.2.3 Sea winter population structure. ... 19
3.3 Impact of breeding strategies on genetic variability. ... 20
3.3.1 F0 breeding plan and outcomes ... 20
3.3.2 Genetic variability of F0 broodstock and impact on F1 enclosed breeders. ... 22
3.3.3 F1 breeding plan and outcomes. ... 22
3.3.4 Genetic variability of F1 captive broodstock and impact on F2 generation. ... 22
3.4.1 Assessment of natural spawning level in Ariège ... 23
3.4.2 Return of wild born salmon ... 23
3.4.3 Specific and global genetic variability of the population. ... 26
4. Discussion ... 27
4.1 A very high efficiency of the microsatellite panel ... 27
4.2 A high conservation of genetic variability through the whole rearing process. ... 29
4.2.1 No loss of variability in the F0 broodstock through years ... 29
4.2.2 A limited loss of genetic diversity between generation that could be overestimated ... 29
4.2.3 No loss of variability from F1 broodstock to F2 returning migrants ... 30
4.3 Breeding possible improvement in hatcheries ... 30
4.4 The stocking program, may modify sea-age structure of the population ... 31
4.5 The study confirms that the “fry stage is an efficient stage for restocking ... 32
4.6 Stocking in the Dordogne river IS LESS efficient... 32
4.7 One generation in captivity does not decrease return rate ... 33
4.8 The river and the Single Sea-Winter age may influence straying rate ... 33
4.9 Return of wild born salmon ... 34
4.10 Potential information for other conservation programs ... 35
1
1. Introduction
This work, realized as part of a Master’s degree in aquaculture science for the association MIGADO with the support of INRAE (National Research Institute for Agronomy and Environment) and SYSAAF (French Poultry and Aquaculture Breeders Technical Center), aims to assess the efficiency of the stocking program of Atlantic salmon (Salmo salar, Linnaeus 1758) in the Garonne-Dordogne basin since 2008 by using genetic markers. The access to this tool, allowing an individual tracking, offers an opportunity to analyze the practices and their impact to propose improvement in the stocking program.
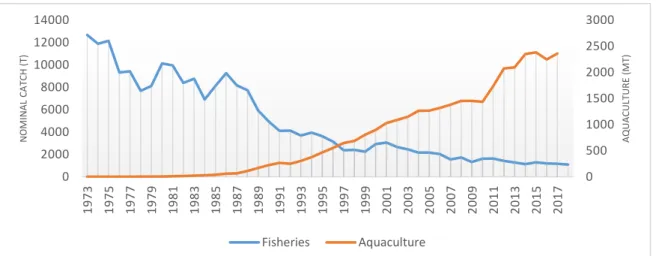
Nearly one million tons of salmonids are caught each year since 2010. For almost all species, captures remain stable or are increasing since the 80’s (FIGIS), except catches of Atlantic salmon. Since 1973, when the highest total nominal catch was reported with 12 670 tons, captures have continued to decrease, reaching only 1 090 tons in 2018. (Figure 1) (ICES, 2019). This species inhabits a wide range of habitats, from high Arctic to Spain (Aas, 2011) and has experienced widespread population declines over the last century (Parrish et al., 1998; ICES, 2019). Identified threats are climate change, habitat depletion (e.g destruction of spawning areas) and destruction of the river ecological continuity (Forseth et al., 2017). Also, a recent study has underlined that high density genomic data clearly segregated significantly declining and non-declining populations of North-Atlantic salmon (Lehnert et al., 2019). The rise of Atlantic salmon aquaculture (Figure 1) has also been seen as a threat for wild Atlantic salmon population (especially through farm escapees and spread pathogens.) (Glover et al., 2017; Wringe et al., 2018). It is nowadays performed at a large scale in both hemispheres, specifically in Norway and Chile where the production reaches respectively more than 1.2 million tons and 0.6 million tons today (FIGIS), and it is currently the most cultivated salmonid in the world (FAO, 2020).
Figure 1: Evolution of Atlantic salmon fisheries and aquaculture in tons (Source: FIGIS)
To restore wild depleted or vanished populations of Atlantic salmon many solutions are-tested and applied. As an anadromous fish, it spends a minimum of one year in freshwater before the downstream migration and 1 to 5 years at sea before its upstream migration (Figure
2). The part of its life cycle in freshwater ecosystems is very important because the Atlantic
salmon spawns in very particular area (Aas, 2011). Freshwater ecosystems are among the most threatened and the most fragile ecosystems in the world (Dudgeon et al., 2006). Moreover, a recent study on fish species sensitivity ranks the salmonids species as high sensitive species for habitat destruction (van Treeck et al., 2020). Therefore, the restoration of wild salmon habitats is one of the key options to save Atlantic salmon population.
0 500 1000 1500 2000 2500 3000 0 2000 4000 6000 8000 10000 12000 14000 1973 1975 1977 1979 1981 1983 1985 1987 1989 1991 1993 1995 1997 1999 2001 2003 2005 2007 2009 2011 2013 2015 2017 A QU A CUL TU R E (M T) N O M IN A L CA TCH (T ) Fisheries Aquaculture
2 Figure 2: Atlantic salmon life cycle (Source: MIGADO)
In case there is still wild salmon in the river, restocking is hazardous and the top priority is to restore the salmon habitats (Waples & Do, 1994). It has also been recently demonstrated that stocking fails to increase fish production where wild fish populations and suitable habitat remains (Bacon et al., 2015). However, in case of an extinct population, captive-breeding and re-stocking are very important tools to restore the population. Leber in 2013 defines re-stocking as the “release of cultured juveniles into wild population(s) to restore severely depleted spawning biomass to a level where it can once again provide regular, substantial yields” (Leber, 2013). Re-stocking is described here with terms that are used for production. Indeed, hatchery programs were firstly made to compensate for fisheries depletion (Saltveit, 2006). Nevertheless, nowadays many re-stocking programs have as first aim the ecological restoration because populations are on the edge of extinction or even became extinct. Hatchery programs to restore local salmonids populations have accumulated the last 50 years.
The first documented genetic study on a re-stocking program was on brook trout (Salvelinus fontinalis, Mitchill 1814) (Flick & Webster, 1964). This study was conducted with trout domesticated for many generations, as were later studies on other salmonids (Allendorf & Phelps, 1980; Hansen, 2002; Jonsson & Jonsson, 2006; McLean et al., 2003). A loss of both genetic diversity and fitness in the wild was observed in all those studies because of supplementation with domesticated fish. Although Dannewitz et al., (2004) reported no difference in the reproductive success in the wild between hatchery produced and wild-born brown trouts (Salmo trutta, Linnaeus 1758) most of studies conducted on this subject led to rather negative outcomes with less marine survival, and less reproductive success for hatchery-reared fish. (Jonsson et al., 2003; Miller et al., 2004; Waples & Drake, 2004; Araki et al., 2007; Thériault et al., 2011; Satake & Araki, 2012). To reduce issues with hatchery fish, re-stocking programs have attempted to reduce the time and the number of generations spent in captivity (Reisenbichler & McIntyre, 1977; Frankham, 2008). Studies showed that re-stocking with only first generation hatchery fish lowers potential negative impacts on fitness (Schroder et al., 2008; Berejikian et al., 2009; Ford et al., 2016). According to some studies, using wild fish as broodstock has no negative impact on fitness and results in lower adaptation to captivity (Hess et al., 2012; Baskett & Waples, 2013). The best approach is therefore to minimize genetic adaptation to hatchery conditions by using individuals caught in the wild (Williams & Hoffman, 2009). However, even with a single generation of hatchery breeding, some studies noticed that hatchery-origin fish produced less juveniles per parent when spawning naturally than did wild-origin fish (Williamson et al., 2010; Christie et al., 2014) but also less survival between life
3
stages (Kennedy et al., 2012). However, a study conducted by Chilcote et al., (2011) even suggested the impact of using hatchery fishes descending from “wild-type” brood stock (with 1 generation in captivity) is not less negative than using domesticated breeders. This short-term adaptation of salmonids to captivity was demonstrated by Christie et al., (2012). They estimated that fish from first generation hatchery had twice the reproductive success of wild fish when spawning in captivity, which is clearly an adaptation to captivity. Also, juveniles from hatchery reared parents with only six months in captivity showed significant differences in terms of growth, migratory behavior and genetic variability than offspring of wild fish (Christie et al., 2016; Horreo et al., 2018). A short-term captivity may thus be enough to initiate changes that are usually related to domestication.
Besides the reduced population fitness through adaptation to captivity, Aprahamian et al., (2003), summarized others risks associated with stocking, including the competition between wild and hatchery juveniles in terms of habitat use and food (underlined in Kostow & Zhou, (2006)) and threats to local genetic integrity. Indeed, the high level of local adaptation of salmonids has to be considered in restocking programs, that must be managed considering that the hatchery broodstock is “a genetic integrated component of an existing natural population” (Mobrand et al., 2005).
Therefore, many hatchery programs have underlined the importance of the use of wild but also local broodstock. The frequency of local adaptation in salmonids was evaluated between 55% and 70% (Fraser et al., 2011).Using local and wild fish had already been suggested by Reisenbichler & McIntyre, (1977) : “The genetic difference can be reduced by using native wild fish which are adapted to that particular stream system for brood stock to initiate the hatchery program and in subsequent generations”. The efficiency of selecting native wild stock to build the brood stock has been shown in many studies. A study showed that local population had 1.2 times average fitness advantage relative to foreign population (Fraser et al., 2011). Survival rate of non-natives from ova to return as an adult is in general less than the survival rate from native salmon (McGinnity et al., 2004; Araki et al., 2007; Araki et al., 2008). Whereas intense stocking of non-native fishes can alter a population genetic structure and cause a disturbance of allelic variability (Marie et al., 2010), the use of local wild fish for hatchery brood stocks can minimize those effects (Berejikian et al., 2009; Berntson et al., 2011; Christie et al., 2014; Bacon et al., 2015).
Selecting a brood stock by taking only wild and local fish does not avoid all issues for the conservation of an extinct or depleted wild population. Another important parameter to consider is the effective population size of the broodstock of the remaining population (hatchery and wild), called Ne. It is one of the several concepts introduced into population genetics by
Sewall Wright (Wright, 1931). Ne is crucial in determining the level of conservation of the
genetic variability between two generations in a population, and the effectiveness of selection relative to drift (Charlesworth, 2009). Ne is often far lower than the number of breeders in the population when pedigree information and adapted management of mating to avoid inbreeding are missing. (Frankham, 1995). Ne is linked with the Ryman-Laikre effects (R-L) which is “an
increase in inbreeding and a reduction in total effective population size in a combined captive-wild system, which arises when a few captive parents produce a large number of offspring” (Ryman & Laikre, 1991). The R-L effect has been widely documented (Aho et al., 2006; Blanchet et al., 2008; Horreo et al., 2008; Anderson et al., 2013; Mestral et al., 2013) and has to be avoided to not deplete the genetic make-up of the population (hatchery and wild populations). Some studies have examined the effective number of breeders in the context of hatchery programs. For example McLean et al., (2008) calculated an effective number of
4
breeders ranging from 11% to 31% of the census size of the population. The number of F0 parents that contribute to the released F1 generation is therefore very important. A small brood stock size will also create more inbreeding. As mentioned by Duchesne & Bernatchez (2002) : “The census size of captive populations is the single most important parameter determining the genetic consequences of supportive breeding”. It was supported by later studies that advised a high refreshment rate of the brood stock each year (Blanchet et al., 2008; Favé et al., 2008). A recent study (Christie et al., 2014) found that inbreeding could account at most for a 1-4% reduction in the fitness of hatchery fish relative to wild fish under the genetic practices applied in this case.
Although the estimation of the effective population size or the effective number of breeders is difficult to determine in natural populations as pedigree is unknown and impossible to trace back (Araki et al., 2007), estimating it in the context of stocking program became easier thanks to the development of genetics in recent decades. The genomics revolution has improved our understanding of the Atlantic salmon population with a large increase in the number of genetic markers for parentage assignment, from dozens to 104 - 106 (Waples et al., 2020). Parentage assignment is used since the end of the 80’s to build the pedigree of plants or animals (Meagher, 1986; Adams et al., 1992; Kaufman et al., 1998; Randall et al., 2007; Waser & Hadfield, 2011; Peterson et al., 2014) and in aquaculture (Vandeputte & Haffray, 2014). The monitoring of wild fish populations by using genetic tools has been reviewed by Araki & Schmid (2010) and the study showed that microsatellite loci are widely used for parentage assignment since the 2000’s,. This method provides a good way to assign offspring to their parents and therefore to determine their origin, hatchery or wild (Jeong et al., 2007; Eldridge & Killebrew, 2008; Shikano et al., 2008). It is then easier to know how the stocking program is working and to estimate reproductive success, survival rate by distinguishing both groups. Microsatellite parentage analysis is also useful to estimate the effective population size that contributes to the census size of the juvenile population (Jeong et al., 2007). This method minimizes the two types of error identified by (Araki & Blouin, 2005) : Type A or 1 when failing to assign a true parent, or Type B or 2 error when assigning a false parent. The more microsatellite loci, the more this method is accurate (Harrison et al., 2013) to maximize parentage assignment. Several software for parentage assignment have been developed based on two different methods, either on exclusion (e.g Vitassign (Vandeputte et al., 2006)) or maximum likelihood (e.g CERVUS (Kalinowski et al., 2007), AccurAssign (Boichard et al., 2014), and recently APIS (Griot et al., 2020)). Progress in parentage assignment with microsatellites enable to monitor stocking programs and their efficiency. For example Horreo et al., (2011), following all recommendations, meaning large-sized, wild and local brood stock, calculated that re-stocking yielded only a 10% increase of the wild Atlantic salmon population size. Another study observed a long term demographic boost of the population in Chinook salmon (mean of 4.56 times in the first generation and mean of 2.52 in the second generation) (Janowitz‐Koch et al., 2019). According to these results overgeneralization on efficiency of stocking program must be avoided. The present study focuses on a stocking program that takes place in the Garonne-Dordogne basin in France.
In France, Atlantic salmon is on the red list of IUCN (International Union for Conservation of Nature) since 1995 and ranks as “near threatened” (IUCN). Indeed, the distribution range of this species has been seriously reduced as it collapsed in most of the large rivers systems like the Rhine, the Seine or the Garonne and Dordogne during the 19th century
(Thibault, 1994). In the 2000’s the Atlantic salmon was mainly found in three areas only: in the Armorican Massif (Brittany and Normandy), in the Loire River and in the Basque Country (Baglinière et al., 2010). To curb the stock depletion, the French government took measures in
5
the late 70’s and created a plan to preserve the Atlantic Salmon in 1976. Following those measures, obligatory reporting of catches was established in 1987 and in 1994, COGEPOMI (Comité de Gestion des Poissons Migrateurs: Management Committee of Migratory Fish) has been created in 8 French basins to set up PLAGEPOMI (Plan de Gestion des Poissons Migrateurs: Management Plan of Migratory Fish). As established by (Perrier et al., 2013), the French Atlantic salmon populations are clearly delineated in 5 genetic groups (Upper Normandy, Lower Normandy, Brittany, Loire-Allier and Adour). Therefore, in France, salmon populations are managed per basin with the COGEPOMI and with the help of local or regional associations to conduct the PLAGEPOMI. Many rivers and basins are today concerned with salmon restoration as shown in Figure 3. In the Garonne-Dordogne basin following industrialization and the building of hydropower dams, the salmon population totally vanished between the end of the 19th century and the beginning of the 20th century (Caut et al., 2018). As
the autochthonous population had disappeared, it was therefore necessary to introduce salmons from other sources. The first wild strains used were those available from Canada, Scotland and Norway. This strategy was rapidly changed to favor local wild strains from Loire-Allier and Adour-Gaves. This stocking strategy was successful and a small population of Atlantic salmons has established. Therefore, in 1995, a breeding center for salmon conservation was built in Bergerac (Dordogne) to develop a captive broodstock with trapped wild migrating spawners from Dordogne and Garonne. Since then, local fish, all supposedly originating initially from hatchery-reared salmon from Loire-Allier and Adour-Gaves populations and caught in the Garonne-Dordogne basin, are being used to produce juveniles to supplement the population in the two basins.
Figure 3. Salmon rivers in France – Where and what is being done. Adapted from Baglinière, 2013
In 2006, the genetic practices of MIGADO association were audited by SYSAAF in the GENESALM national project. GENESALM was managed by the French fish farmer association Comité Interprofessionnel des Produits de l’Aquaculture (CIPA) and the Club de la Chartre des Salmonidés de Repeuplement (CCSR) with INRA, CNRS, SYSAAF and Labogena as partners. This project analyzed breeding practices of the main French restocking programs of Atlantic salmon (Rhein, Dordogne-Garonne, Brittany, Adour-Gaves, Loire-Allier) and
6
brown trout based on wild parents. Several aspects were considered (Haffray et al., 2008) to minimize creation inbreeding by captivity such as reproduction practices (use of extender for gamete conservation and fertilization, sperm/ova ratio, success of incubation) mating design, generation interval, number of parents, sex-ratio, sanitary practices, traceability, staff training, external expertise or capture of innovations as sperm cryopreservation. For the MIGADO restoration project several actions were proposed: the use of DNA parentage assignment to evaluate the impact of breeding practices and monitor its activity, the limitation of the number of years in captivity of F0 wild parents, the increase in number of wild parents, an improved balance of the wild parents sex-ratio, the maximization of the number of families created by systematic partial factorial mating design, secured data collection by using an adapted database system, systematic and automatic individual tagging of F0 and F1 broodstock by electronic transponder, systematic collection of fin samples in alcohol in baredcoded tubes for extensive genotyping with the microsatellite panel developed and automated in GENESALM by Labogena genotyping laboratory for parentage assignment, adapted incubation and rearing practices in order to be able to trace back origins of the parents to evaluate the efficiency of different restocking practices (sites, stage at restocking, headcounts, year, age of the parents, …).
The objectives of the present study are: 1) the evaluation of the efficiency of restocking through the improvements proposed by GENESALM project and implemented by MIGADO, 2) the assessment of the genetic impact of hatchery born fish on the wild born population, 3) the estimation of the level of natural spawning, and 4) the establishment of guidelines and advice for the future.
2. Materials and Methods
This study is based on the Atlantic salmon population of the Garonne-Dordogne basin that is currently being restored. The restoration program is operated by MIGADO. It is based on salmon breeders caught in the wild, called F0 broodstock and their enclosed offspring F1 used also as breeders. The study workflow is presented in Figure 4. The data date back to the salmon spawning season of winter 2007-2008 following SYSAAF audit in the GENESALM project. Since 2010, all salmon migrants that are trapped at the control stations during their upstream migration are genotyped. Those fish can be either released offspring of previously hatchery reared fish of the program or wild salmon stemming from wild reproduction. Parentage assignment with 9 microsatellite loci has been initially used to determine the origin of all genotyped migrants (see details later).
SW : Sea Winter
Figure 4: Study workflow since 2008 (Source: MIGADO)
7 2.1.1 Population monitoring
Since 1995, to follow the evolution and the distribution of the salmon population in the Garonne-Dordogne basin, monitoring stations have been settled in fish passes all along the rivers. The most downstream stations are at the Tuilières dam (Saint-Capraise-de-Lalinde, France), 200 km away from the ocean and 10 km upstream to Bergerac (France) for the Dordogne river and on the Golfech (France) nuclear power station dam 270 km away from the ocean and 20 km upstream to Agen (France) for the Garonne River. These stations are equipped with fish video counter working permanently. They provide an exact number of migrants that return above each station. The individuals that pass through the control stations can colonize the upstream spawning areas. The video systems are coupled with an image analysis software that allows to determine the total length (+- 2 cm) (TL) of each individual which is correlated to the number of winter at sea of the fish (Gardner, 1976; Hutchings & Jones, 1998). Therefore, we are able to estimate for each salmon its numbers of winter at sea. The following size-classes have been used:
- If TL <= 65 cm: 1SW
- If 65 < TL < 75 cm and passing Golfech or Tuilières before 1st June: 2SW
- If 65 < TL < 75 cm and passing Golfech or Tuilières after 1st June: 1SW
- If 75 < TL < 85 cm: 2SW - If TL > 85 cm: 3SW
2.1.2 Fish trapping
Monitoring stations are also equipped with trapping devices used to catch salmon during their upstream migration. Trapped fish have migrated at sea and have thus gone through some natural selection pressure. Trapping takes place at the counting stations of Tuilières (Dordogne) and Golfech (Garonne). Once captured and anesthetized, a piece of fins (caudal or pectoral) was sampled by individuals in Eppendorf tubes, containing ethanol (96%). All samples were genotyped by LABOGENA-DNA laboratory (Jouy-en-Josas, France). A part of the captured and sampled fish is sent to the F0 breeding center in Bergerac. The other part is released directly upstream the monitoring stations. The Bergerac breeding center can hold a broodstock of 150 F0 breeders. The proportion of captured and kept fish vary among years between 10% and 25% of the video monitored population for the Dordogne River and between 17% and 80% for the Garonne River. Since 2014, only in the Garonne River, a maximum of monitored fish are trapped and sampled. Fish from the Garonne River that are not kept as F0 broodstock for the stocking program are directly brought by truck, 200 km upstream Golfech to spawning areas in the Ariège River. Therefore, those fish have a facilitated access to the spawning areas in the river and a greater chance to spawn naturally.
2.1.3 Breeding plan creation
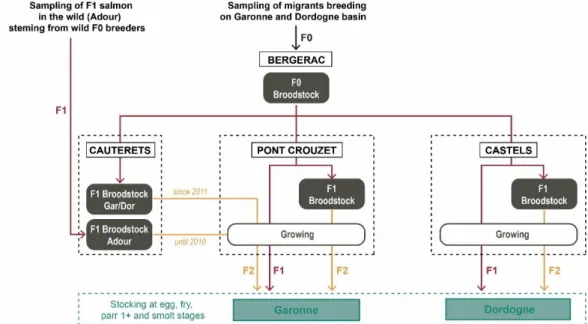
The MIGADO production scheme (Figure 5) uses a mix of F1 and F2 fish derived from the Bergerac F0 broodstock.
Creation of the F1 generation
Wild fish that are caught each year in both rivers and reared in captivity to Bergerac breeding center are called the “F0 generation”. The yearly turnover rate of the F0 broodstock in Bergerac is around 40% which can vary following the number of trapped fish in the rivers on a given year. The broodstock can produce a maximum of 750 000 eggs by year. These eggs are used for two main goals: About 3000 eggs, are sent to the 3 F1 multiplication centers of
8
Castels (24), Cauterêts (65) and Pont-Crouzet (31) that produce F2 eyed eggs from the “F1 generation” breeders. They are called F1 captive breeders because they reach maturity in the river-based fish farms in captivity, without any wild and marine phase in their life cycle. The remaining F1 eyed eggs produced (> 99%) are released at different life stages in the rivers for direct stocking.
Figure 5: MIGADO production scheme (Source: MIGADO)
The following protocol is used to produce F1 eyed eggs at Bergerac breeding center: Each F0 individual is identified through an electronic transponder at its first spawn. Its electronic identifier is collected in the SYSAAF INFAQUA database system by electronic tag reader connected to the computer holding the MIGADO data base. This guarantees traceability in recording the different fish used in the different mating plans throughout their life in the farm. Indeed, each fish can spawn a maximum of five times in the F0 breeding center, the spawn of one female is fertilized with a group of males in a partial factorial design. Each spawn is subdivided in approximately 1000 eggs batch for a separate fertilization by different males. In average, the ova of one female are fertilized by 12 males. The composition of the male group varies for each female. Each day of spawning, up to 9 females are fertilized. The spawn of each female is collected in separated batches. Traceability of each incubator is recorded in the MIGADO database. They will be released in the wild at spring and early summer or kept to create enclosed breeders.
Creation of the F2 generation
The three F1 multiplication centers broodstock from F1 Bergerac eggs. They use those enclosed F1 breeders to produce the major part of the individuals of the stocking program: the F2 generation. The F1 broodstock of each multiplication center comprises between 800 and 1 200 individuals, of which between 30% and 40% is renewed each year. An individual can spawn a maximum of 7 years. In total, nearly 2 million F2 eggs are produced each year. In F1 hatcheries each F1 individual is also identified following the same protocol as for F0 and its electronic identifier is recorded in the MIGADO data base. F1 enclosed breeders are also genotyped with the same protocol as described for their F0 trapped parents. The mating protocol differs between the creation of F1 and F2 generations. In the F1 multiplication hatcheries the spawns of 12 to 18 dams are pooled and then sub-divided in three containers. Each container is
9
fertilized with the pooled milt of two different males, in order to secure the quantitative production of eggs, even if differential of fertilization success. Thus, each F2 batch originates from 12 to 18 are fertilized with 6 males in a partial factorial mating design. It is important to notice that it is difficult to anticipate the daily breeding plan (F0 and F1) due to asynchronicity between individuals.
2.1.4 Stocking strategy
The stocking strategy is based on the release of large numbers of Atlantic salmon offspring from the two generations different produced (25% F1 and 75% F2). The stocking areas are showed on the map in Figure 6a. For the Garonne basin, three areas are used for stocking:
- Garonne River upstream Pointis (31) - Neste River upstream Pointis (31) - Ariège River downstream Pamiers (09)
For the Dordogne Basin, three areas are used for stocking: - Dordogne River upstream Carennac (46)
- Corrèze River upstream Brive (19) - Vézère River
The stocked fish are released at different stages released:
Eyed egg: advantageous on economical (low production costs) and biological (individual
facing environmental conditions at birth) aspects. This stage is more difficult to stock (needs more time and people) than the other ones.
Fry: Limited intensity of domestication and low breeding cost (feeding between 1 and 3
months). Quantitatively, the most important released stage.
Parr 1+: One-year old salmon that did not smoltify. They are released downstream the fry
stocking area.
Smolt: High rearing cost but minimized mortality rate during the freshwater phase. They are
released in the most downstream areas after the last hydroelectric development.
Figure 6b shows the yearly numbers stocked by stages for both basins since the
beginning of the current study in 2008. In the Garonne basin, the stocking strategy has been directed towards fry that represent in average 96% of the stocked individuals. Eggs, parr and smolts are barely used, respectively 0.5%, 2.5% and 0.5% of stocked individuals. In the Dordogne basin, fry is also the most important stocked stage but the egg stage represents in average 13% of the individuals. Smolt and parr are also more frequently stocked in the Dordogne with respectively 6% and 3% of stocked individuals.
10
a)
b)
Figure 6: Maps showing stocking area (a). Number of stocked fish (b) 0 50 100 2008 2009 2010 2011 2012 2013 2014 2015 2016 2017 2018 2019 N u lb er o f in d iv id u als sto ckedx 1000 0
Dordogne
Eggs Fry Parr 1+ Smolts
0 20 40 60 80 100 2008 2009 2010 2011 2012 2013 2014 2015 2016 2017 2018 2019 N u lb er o f in d iv id u als sto ckedx 1000 0
Garonne
11
2.2 PARENTAGE ASSIGNMENT AS A MONITORING TOOL
2.2.1 Principles of parentage assignment
Parentage assignment is expected to identify fish pedigree. As all breeding plans are registered in the database and all F0 and F1 broodstock are genotyped, we should be able to identify the parents (and hence the origin) of any fish trapped in the river that comes from the restocking program. In total, 1014 migrants between 2010 and 2019 were genotyped with a panel of 9 microsatellite loci developed and tested in GENESALM project on experimental families produced by MIGADO based on Paterson et al (2004) . The assignment has been carried out by LABOGENA-DNA with the software AccurAssign based on a maximum likelihood approach (Boichard et al, 2014).
The AccurAssign gives five different types of results:
Type 1: Individuals considered non-compliant (NC) for which the quality of the DNA sample only allows genotyping less than 7 markers out of 9. Those individuals were removed from the dataset and all following analyses. Some potential parents can also be non-compliant because of some issue with their DNA sample. All those parents have been identified to be able to estimate the percentage of offspring considered as non-assigned while they could be offspring of non-compliant parents.
Type 2: Individuals assigned in the breeding plan (ABP) for which a single pair of compatible breeders has been found, which is recorder in a hatchery breeding plan (F0 or F1). These individuals necessarily come from the stocking program.
Type 3: Individuals that are not assigned (NA) for which no compatible parent pair has been found. They necessarily come from natural spawning.
Type 4 and 5: AccurAssign can also assign an individual to a parent pair that is not in the breeding plan (ANBP, Type 4) or to multiple possible parent pairs (MABP, Type 5). According to simulation conducted before this work (Marc Vandeputte, personal communication) in 2016 with the genotypes of 3 500 females and 2 000 males from Bergerac, Castels, Pont-Crouzet and Cauterets fishfarms, Type 4 and 5 fish should be considered as originating from wild spawnings (Unpublished data).
Therefore, only fish assigned in the breeding plan are (ABP, Type 1) considered as stocked fish.
2.2.2 Assignment power of the microsatellite panel
To assess the power of assignment with 9 microsatellites loci at a larger scale than in the GENESALM, we applied APIS software (Griot et al., 2020), as AccurAssign was not available, on F1 enclosed breeders originating from F0 wild parents. Individuals from both generations were tagged and genotyped. As every mating was recorded in breeding plans, it was possible to estimate the power of the panel of microsatellite between 2008 and 2016.
2.2.3 Identification of wild-born individuals from known parents
Since 2014, in the Garonne River a maximum number of individuals are captured and genotyped with the formerly described protocol. Part of those animals are directly sent to spawning areas in the Ariège River, a tributary of the Garonne River. As those animals are also genotyped, we should be able to assign their potential offspring to them if they mate together in the wild. Therefore, we simulated a mating scheme in the wild with all genotyped individuals (n = 145) sent to the upper spawning areas between 2014 and 2016 to test this hypothesis. The
12
sex of those parents were not known and all animals could then be either male or female in the mating scheme Then, we try to assign to them salmon that came back after 2016 that were considered as wild salmon. Indeed, the first conveyed salmons in 2014 must have spawned in 2014. Therefore, their offspring migrated downstream end of 2015, and came back at the earliest in 2017 after having spent at least one winter at sea. We also conducted an assignment analysis on wild parrs caught by electric fishing performed by MIGADO in Ariège River in 2015, 2017 and 2018 in areas where no stocking of juveniles occurs. The aim of those analysis was to evidence that the population is capable of reproduction in the wild. Assignment tests were conducted with APIS software, as AccurAssign require the sex of each individuals. If a parr or a wild-considered migrant were assigned to a non-possible couple (meaning two adults of different conveyed years), this salmon was considered as non-assigned in the wild mating scheme. This assignment analysis was conducted on a total number of 132migrants and 63 parrs.
2.3 DATA ANALYSIS
2.3.1 Sampling analysis
As only part of the population is trapped, it was important to know if the sampled population was representative of the video monitored population in terms of age at sea. We analyzed the sampling strategy by testing the difference between the number of 1 Sea Winter (1SW), 2 Sea Winters (2SW) and 3 Sea Winters (3SW) in the monitored and sampled population in both basins. The proportion of the monitored and sampled population for each week were compared by cumulating years from 2010 to 2019.
2.3.2 Stocking analysis
To conduct analysis on stocking efficiency by stages, from a hatchery point of view, we transformed the number of eggs, smolts and parr stocked to fry equivalents. These equivalents have been calculated with the following average recorded survival rates in the hatchery: 75% from egg to fry and 83% from fry to smolt or parr. We gathered smolts and parr stages in the category salmon 1+ as both stages spend nearly the same time in the fish farm, only a part of them smoltifying. Thus, an egg accounts for 0.75 fry, and a smolt or a parr to 1.20 fry. Then we compared the number of fish stocked in fry equivalent and the number of migrants that came back for each category.
To compare the relative efficiency of each stage, we calculated a “capacity for coming back in the river” based on the ratio between the number of migrants that have returned for each stage and the number of individuals stocked for each stage (not converted to fry equivalent). All further analyses were then conducted only with fish stocked as fry to avoid introducing bias with the other stages. We compared stocking efficiency between, basins, rivers, generations (F1 or F2) and cohorts (corresponds to one year of stocking). Therefore, we were able to identify the points that presented issues in the stocking strategy.
2.3.3 Straying rate analysis
As hatchery-salmon are generally more susceptible to stray than wild ones (Ford et al., 2015), we evaluated the straying rate in this population (i.e. the proportion of salmon released in one basin [Garonne or Dordogne] and returning in the other one at the adult stage). As the stocked basin is known for most of the stocked juveniles (each batch of stocked juveniles has its stocking area recorded in the database), we were able to compare the straying rates between basins, generations and the number of sea winters to assess the most impactful parameters.
13 2.3.4 Sea-winter phenotype analysis
Sea winter phenotype (number of winters at sea) has some heritable components in Atlantic salmon (Gjerde et al., 1994; Wild et al., 1994). It was therefore interesting to get some information on this hypothesis. When a salmon is caught and sent to Bergerac center, its sea winter phenotype (age at sea) is known thanks to the classification showed in 2.1.1. As each hatchery-reared F1 or F2 migrant was assigned to a couple of parents, we knew the average parent age at sea phenotype for each F1 migrant and the average grandparent age at sea phenotype for each F2 migrants (as F1 parents are enclosed breeders that do not migrate at sea). For this analysis, the sea winter phenotype was classified as either 1SW or MSW (Multiple Sea-Winter). We compared the mean F0 parental sea age between 1SW F1 and MSW F1. The same was done with F2 migrants (with grand-parental age at sea).
2.3.5 Broodstock and breeding plan evaluation
For both generations, we calculated for each year between 2010 and 2019, the sex ratio, the number of reconditioning and the mean time spent for a fish in the hatchery. We also quantified the number of families created each year and we compared that to the number of crosses recorded in the breeding plans archived in the database. Therefore, we were able to evaluate the proportion of crosses made more than one time through years of spawning. Finally, we evaluated genetic variability each year by calculating genetic diversity indices: allelic richness (AR), expected heterozygosity (He), observed heterozygosity (Ho). The inbreeding coefficient (FIS) was also evaluated for each spawning cohort in each hatchery. Those analyses were used to estimate the evolution of the genetic diversity in the broodstock of all hatcheries and in the breeding plan strategy to advice the next evolution.
2.3.6 Evaluation of genetic diversity loss between generations
To evaluate the potential loss of genetic diversity between F0 and F1 generation and F1 and F2 we calculated first the effective population size of each year for the F0 broostock and for the F1 broodstock (Ne) with the following formulae (Chevassus, 1989) :
. 4 𝑁𝑒 = (𝐾𝑚 +𝐾𝑚) + (𝐾𝑓 +𝑉𝑚 𝐾𝑓𝑉𝑓) − 2 𝑁 − 2 𝑊𝑖𝑡ℎ 𝐾𝑚/𝑓 ∶ 𝑚𝑒𝑎𝑛 𝑜𝑓 𝑜𝑓𝑓𝑠𝑝𝑟𝑖𝑛𝑔 𝑛𝑢𝑚𝑏𝑒𝑟 𝑝𝑒𝑟 𝑚𝑎𝑙𝑒𝑠/𝑓𝑒𝑚𝑎𝑙𝑒𝑠 𝑉𝑚/𝑉𝑓 ∶ 𝑣𝑎𝑟𝑖𝑎𝑛𝑐𝑒 𝑜𝑓 𝑜𝑓𝑓𝑠𝑝𝑟𝑖𝑛𝑔 𝑛𝑢𝑚𝑏𝑒𝑟 𝑝𝑒𝑟 𝑚𝑎𝑙𝑒𝑠/𝑓𝑒𝑚𝑎𝑙𝑒𝑠 𝑁 ∶ 𝑡𝑜𝑡𝑎𝑙 𝑛𝑢𝑚𝑏𝑒𝑟 𝑜𝑓 𝑜𝑓𝑓𝑠𝑝𝑟𝑖𝑛𝑔
Then, the loss of genetic variability each year between F0 broodstock and F1 broodstock as well as between F1 broodstock and F2 migrants was evaluated with the following formulae:
𝐿𝑜𝑠𝑠 𝑜𝑓 𝑔𝑒𝑛𝑒𝑡𝑖𝑐 𝑑𝑖𝑣𝑒𝑟𝑠𝑖𝑡𝑦 = 1 – ( 1 2𝑁𝑒) 2.3.7 Genetic analysis of the population in the basin
As the main goal of the program is to restore a self-sustainable population in the basin, we evaluated the proportion of the non-hatchery-reared origin fish in both basins through years and we quantified the evolution of this proportion. Moreover, as migrants stemming from wild spawning are genotyped, we compared their genetic diversity indices (HE, AR, HO, FIS) with
14 2.3.8 Software used
Allele number and allelic richness were obtained using Fstat 2.9.3.2 (Goudet 1995). Allelic richness was calculated for the smallest number of individuals in a sample. Expected heterozygosity, He (Nei 1978), observed heterozygosity, Ho and inbreeding coefficient (Fis) were calculated with GENETIX 4.05.2 (Belkhir et al., 1996). Significance of Fis coefficient was tested with 1000 bootstraps on all loci with GENETIX. All statistical analysis, chisquare and Mann-Whitney tests and regression were conducted with R software. Chisquare test were used to assess significant differences between the monitored and the sampled population but also to evaluate differences between the quantity of stocked fish and the number of migrants that came in the basin. Mann-Whitney tests were used to assess significant differences between groups of fish for genetic diversity indices. Graphics and Figures have been made using Excel.
3.
Results
3.1 STUDY VALIDATION
3.1.1 Validation of the parentage assignment panel
To validate the microsatellite panel, we assigned F1 hatchery-reared salmon of multiplication hatcheries to their F0 parents from the Bergerac breeding center, each with APIS software. Assignment rates are reported in Table 1 for the different cohorts produced from 2008 to 2016.
The assignment rates were high, from 92.9% in 2012 to100% in 2008, 2009, 2010 and 2011. A lower assignment rate (91.0% in 2016) can be explained by the proportion of non-compliant parents (individuals genotyped for less than 7 markers), in that year class.
Table 1: Assignment rate for F1 offspring (NC = non-compliant fish with less than 7 markers genotyped)
Year of birth Number of F1 NC Offspring Assignment % NC Parents
2008 601 5 100.0% 0% 2009 1154 17 100.0% 0% 2010 1296 8 100.0% 0% 2011 831 3 100.0% 0% 2012 414 4 92.9% 0% 2013 1922 12 94.1% 0% 2014 809 5 96.4% 0% 2015 849 5 95.9% 0% 2016 794 9 91.0% 2%
15 3.1.2 Sampling validation in terms of age at sea structure
We checked if the sea winter number varied among year classes and rivers and if the population sea age structure of the sampled fish was similar to that of the whole population. Table 2 shows the number of fish sampled and monitored according to their number of year in the sea (SW) by basin and year class.
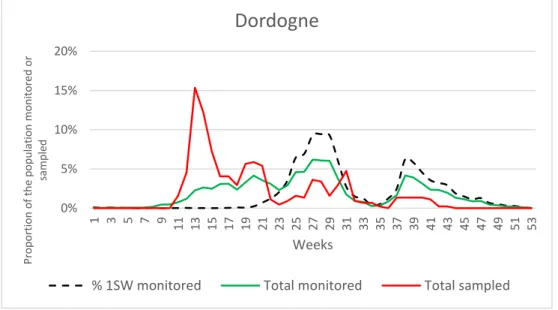
For Garonne and Dordogne Rivers, there were significant differences between the monitored and the sampled population in terms of sea winter (Garonne : X² = 9.28, df = 2, p-value = 0.0097 and Dordogne : X² = 25.791, df = 2, p-p-value = 7.098e-07). We note an under-sampling of 1SW salmon for both rivers, which must be taken in account for the subsequent analysis. The Figure 7 shows that one-year at sea salmons begin their upstream migration in early summer which correspond to an under-sampling period.
Table 2: Distribution of sea winters (SW) in the sampled (Sam.) and monitored (Mon.) Atlantic salmon population in
the Garonne Dordogne basin from 2012 to 2019
Garonne Dordogne
1SW 2SW 3SW 1SW 2SW 3SW
Year Mon. Sam. Mon. Sam. Mon. Sam. Mon. Sam. Mon. Sam. Mon. Sam.
2012 27 7 93 14 13 4 88 6 220 29 44 4 2013 2 0 40 8 9 1 123 21 48 13 33 8 2014 8 0 123 50 11 2 42 0 263 80 30 4 2015 10 9 188 81 21 9 91 2 524 76 59 4 2016 53 13 92 44 4 4 261 15 276 39 33 7 2017 1 0 82 32 3 3 71 2 155 19 17 3 2018 36 5 39 11 2 0 57 6 421 52 17 1 2019 12 2 113 96 16 11 72 9 156 15 28 3 Total 149 36 770 336 79 34 805 61 2063 323 261 34 Mean% 14,9% 8,9% 77,2% 82,7% 7,9% 8,4% 25,7% 14,6% 66% 77,3% 8,3% 8,1% Mon. Tot 998 Sam. Tot 406 Mon. Tot 3129 Sam. Tot 418 0% 5% 10% 15% 20% 1 3 5 7 9 11 13 15 17 19 21 23 25 27 29 31 33 35 37 39 41 43 45 47 49 51 53 P ro po rt io n o f the p o pu lat io n m o ni to re d o r sa m pl ed Weeks
Dordogne
16
Figure 7: Monitored and sampled population –Average for years 2012 to 2019
3.2 ANALYSES OF THE STOCKED POPULATION
This part of the analysis has been conducted on the sampled fish identified as hatchery-born returning adult. In total, the 8 cohorts stocked between 2008 and 2015 represent 559 sampled returning adults identified as hatchery born and almost 9 million restocked egg, fry, parr and smolt.
3.2.1 What does influence the return rate?
3.2.1.1 Influence of stocking stages:
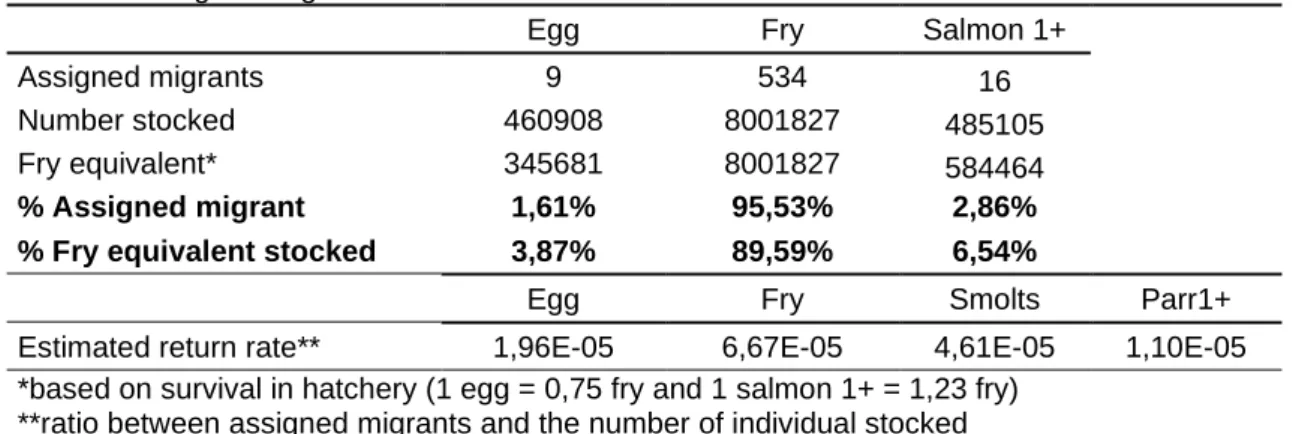
In this program, stocking occurs at different stages. In a given year, the same parents provide offspring that are stocked at a single stage (egg, fry or salmon 1+ (parr and smolt)). The estimated return rate for each stage is presented in Table 3. It shows that fry stage is the most efficient stocking stage. Smolts stage has also a return rate but parr stage has the lowest.
Considering the survival rates in the hatchery, any stage can be converted to fry equivalents, in order to compare the most efficient strategy from the manager’s point of view (Table 3). The fry stage is the most used stages representing 90% of the stocking effort. There was significant heterogeneity between the proportions of fry equivalent stocked and the proportion of returning migrants from each stage (X² = 21.57, df = 2, p-value = 2.54e-05). The fry stage was the most efficient stage to stock as the proportion of migrants is more important than the proportion of fish stocked at this stage. In contrast, egg stage and one-year salmon, either parr or smolt, are less efficient with proportionally a lower proportion of fish returning than stocked. 0% 2% 4% 6% 8% 10% 12% 14% 16% 18% 1 3 5 7 9 11 13 15 17 19 21 23 25 27 29 31 33 35 37 39 41 43 45 47 49 51 53 P ro po rt io n o f the p o pu lat io n m o ni to re d o r sa m pl ed Weeks
Garonne
17
3.2.1.2 Influence of generation, basin and cohorts
To avoid introducing bias and because it is the most important stage in terms of stocking and migrants, all further analyses have been conducted only on migrants stocked at the fry stage which represents 534 returning adults (95.5% of the returning adults) and 8 001 827 stocked fry (89.4% of the stocked individuals).
Stocking of F1 fry (from F0 parents) and stocking of F2 fry (from captive F1 hatchery parents) had the same efficiency (X²=1.99, df = 1, p-value = 1). Indeed, 25.3% of the returning migrants are F1s and 25.2% of the stocked fish were F1s. Therefore, there is no difference in return capacity between F1 and F2 fish stocked at this stage.
Analyses were also conducted to know if some cohorts were more efficient. Chisquare test showed an inhomogeneity in data (X² = 229.5, df =7, p.value < 2.2e-16) with three years that gave more migrants than stocked fish in terms of proportion (2008, 2011 and 2012), and four years where we noticed less productivity (2009, 2010, 2014 and 2015). An important parameter to test was the basin and the river of stocking to know if the stocking in Garonne and Dordogne had the same efficiency. However, a less important number of fish was available for this analysis due to traceability issues at the beginning of the program. All batches of stocked fish and their corresponding migrants with uncertain stocking places have been removed for this analysis. Therefore, it has been conducted on 445 migrants from 7 million stocked fish at fry stage. Results are shown in Figure 8. A migrant is considered as a Garonne migrant if it has been stocked in the Garonne basin. Straying effect will be treated afterwards.
Table 3: Assigned migrants and headcount stocked between 2008 and 2015.
Egg Fry Salmon 1+
Assigned migrants 9 534 16
Number stocked 460908 8001827 485105
Fry equivalent* 345681 8001827 584464
% Assigned migrant 1,61% 95,53% 2,86%
% Fry equivalent stocked 3,87% 89,59% 6,54%
Egg Fry Smolts Parr1+
Estimated return rate** 1,96E-05 6,67E-05 4,61E-05 1,10E-05
*based on survival in hatchery (1 egg = 0,75 fry and 1 salmon 1+ = 1,23 fry) **ratio between assigned migrants and the number of individual stocked
18 Figure 8: Comparison between stocked salmons and their assigned migrants in the basins and the
rivers of the study between 2008 and 2015
There were significant differences between Garonne and Dordogne (X² = 11.68, df= 1, p-value = 0.00063) with a clearly lower efficiency of return rate for the fish stocked in the Dordogne basin. They represent 44.8% of the stocked fry, but migrants that came back to this basin were only 36.6% of the total number of migrants. To be more specific and because there are two rivers for stocking in both basins, we also tested the river effect. There were again significant differences (X² = 18.23, df = 3, p.value = 0.0004) between stocked rivers. The lower efficiency observed for the Dordogne basin was clearly specific to the Dordogne River, while the higher efficiency in the Garonne basin was specific to the Garonne river. Stocking in Vézère (Dordogne basin) and Ariège (Garonne basin) had an average efficiency.
3.2.2 What does influence straying rate?
In this part, we considered all the migrants (n=455), whatever their stocking stage, that came back from a known stocking river. A fish is considered as a straying salmon when its upstream migration river is different from the river where it was stocked. In total we observed a global straying rate of 11%, which corresponds to 52 strayers. We tested different effects on straying. Salmon from F1 and F2 generation have different straying rates (respectively 18,9% and 10,2%), although this difference is not significant (X² = 2.6941, df = 1, p.value = 0.100). We found a significant difference between Garonne salmon straying rate (16%) and Dordogne salmon straying rate (4%) (X² = 13.12, df = 1, p-value = 0.0003). We also tested the influence of the number of sea winters with a binomial regression as a Chi-Square test was unsuitable. 2SW salmon have significant lower odds to stray (Estimate = -1.23, z-value = 1.27E-05) than 1SW salmons. No significant impact for 3SW was found (Estimate = -0.74, z-value = 0.205) compared to 1SW. Figure 9 shows the differences between homed and strayed salmon. There was not enough data to test the effect of the upstream migration year. However high variation of straying rate has been observed through years.
0% 10% 20% 30% 40% 50% 60% 70% Garonne (Basin) Dordogne (Basin) Garonne (River)
Ariège (River) Dordogne (River)
Vézère (River) % Stocked headcount % Assigned migrant
19 3.2.3 Sea winter population structure.
The population sampled showed a bias in terms of population structure with an over-sampling of 2SW salmon and an under-over-sampling of 1SW. We tested whether the sea-winter structure of the stocked fish was influenced by some parameters. In this part we used the 559 fish from 2008 to 2015 cohorts (year of stocking), except when we tested the effect of the stocking basin, where we used 454 fishes for which the true stocking location was known.
The sea winter structure did not differ between the two basins (X² = 2.37, df =2, p-value = 0.31) with a global structure of 19.2% of 1SW, 75.3% of 2SW and 5.5% of 3SW. No significant differences were found between F1s and F2s (X²= 4.88, df =2, p-value = 0.087). The impact of stocking stages, cohorts and year of upstream migration could not be tested, but some cohorts seemed to have different age structure.
We tested whether we could observe a link between the sea-winter phenotypes of the migrants and their parents. First, we tested if F1 offspring sea winter phenotype was correlated with the sea winter phenotype of its parents. Figure 10 (a) points out that the average parent’s sea age of 1SW F1 offspring was lower (1.57) than that of multiple sea winters (MSW) F1 offspring (1.81). Figure 10 (b) also shows this link through the regression between the average sea age of all F1 offspring of a cohort and the average sea age of their parents. Apart from the 2009 cohort (see BR09 on the graph), the relation between offspring and parental phenotypes is clear. We can also point out a temporal effect as average sea winter phenotype seems to increase since the beginning of the study. The same effect has been tested on F2 migrants on their grandparent’s phenotype as their parents are captive breeders, with no sea-winter phenotype. The difference between 1SW parental phenotype (1.60) and MSW grand-parental phenotype (1.67) is not as high for F2 as for F1 generation but still present a significant difference.
Figure 9: Sea-winter population structure comparison between homed and strayed salmon – Year
2008-2015 15,4% 49,0% 79,2% 45,1% 5,5% 5,9% 0% 10% 20% 30% 40% 50% 60% 70% 80% 90% 100%
Homed salmon Strayed salmon 1SW 2SW 3SW
20 a)
b) Figure 10: Relation between F1 migrants sea-age phenotype and F0 sea-age phenotype
3.3 IMPACT OF BREEDING STRATEGIES ON GENETIC VARIABILITY.
All eggs, fry, parr 1+ and smolt that are stocked stem from hatchery-reared broodstock that are limited in number, especially the Bergerac F0 population. In this study, we analyzed all breeding plan made since 2008, to assess 1) the composition and genetic variability of the broodstocks and 2) the consequences of breeding plan practices on F1 and F2 generation.
3.3.1 F0 breeding plan and outcomes
F0 crosses take place at Bergerac center according to the protocol described in Materials and Methods. For each spawning season in Bergerac center, we calculated average number of year spent by the broodstock in the center (e.g : in 2010, on average, males that spawn had spent on average 2.4 years in the fish farm and females 2.8 years). The evolution of this parameter is presented in Figure 11. We noticed a clear decrease in the number of years spent by breeders in the hatchery after 2011. We also calculated the evolution of the number of use of the same fish in mating plans throughout the different spawning seasons, called “reconditioning” (Meaning that a fish is used in year n, n+1, etc..). This number of reconditioning has decreased drastically since the beginning of the program, from 3.5 times for fish caught in 2007 to 1.5 times for fish caught in 2015. This means that the renewal rate is now more important between each spawning season. BR09 BR08 BR10 BR11 BR12 BR13 BR14 BR15 1,40 1,50 1,60 1,70 1,80 1,90 2,00 2,10 2,20 1,4 1,6 1,8 2 2,2 2,4 2,6 F0 Pa re n ta l p h en o ty p e (Se a Age )
F1 Offspring phenotype (Sea Age) R² = 0.8681 (With BR09, R² = 0.4347) 1,00 1,10 1,20 1,30 1,40 1,50 1,60 1,70 1,80 1,90
One Sea Winter F1 Migrants Multiple Sea Winter F1 Migrants
Me an F0 p ar en ta l s ea age
21 Figure 11: Number of years spent in the F0 Bergerac center in average for each spawning year
In addition, we found that the age of a female in hatchery (Number of use) had no impact on migrant’s efficiency by comparing the number of spawns made by female at different age and their number of produced migrants (X² = 2,07, df = 4, p.value = 0,72) (Figure 12). Therefore, the capacity of a migrant to come back is not linked with the number of female reconditioning at Bergerac center.
Figure 12: Comparison between the spawn participation and the produced migrants for F0 females,
depending their number of years spent in hatchery. 2008-2015
Sex ratio (number of males /number females) was very stable through breeding years, around 0.39. The number of breeders in the broodstock is highly variable through years (min. 51 individuals, max. 108 individuals). As all individuals from the broodstock are not used all together for spawning (it is technically impossible) only a part of the overall available genetic diversity is exploited each year. As such, 11 479 crosses were made, representing a total of 7 779 genetically different families throughout the 2008 to 2019 spawning seasons at Bergerac. As more crosses than families were made, some crosses have been repeated within the same spawn and/ or between years with fish reuse.
0,0% 5,0% 10,0% 15,0% 20,0% 25,0% 30,0% 35,0% 40,0%
1 Year 2 Years 3 Years 4 Years > 4 Years
Number of year spend in hatchery
% spwan participation % of produced migrants 1,0 1,2 1,4 1,6 1,8 2,0 2,2 2,4 2,6 2,8 3,0 2008 2009 2010 2011 2012 2013 2014 2015 2016 2017 2018 2019 A ve rag e n um be r o f y ear sp end in the c ent er Year of spawning F0 Males F0 Females
22 3.3.2 Genetic variability of F0 broodstock and impact on F1 enclosed breeders.
Genetic diversity was estimated for all F0 spawning groups since 2008. Data are presented in Table 4. No clear evolution was found on allelic richness (AR) and expected
heterozygosity (HE), which remained stable through years in the F0 broodstock. However, the
inbreeding coefficient (FIS) is significantly higher than 0 for years 2012, 2013 and 2014.
As the Bergerac broodstock is still the main source of restocking for the Garonne-Dordogne salmon population (the percentage of hatchery-reared offspring in the F0 broodstock is around 60% approximately since 2013), a minimal loss of genetic diversity between generations is recommended. The effective size of the F0 broodstock at Bergerac (Ne) and the genetic diversity loss are presented in Figure 13 for each spawning year. The genetic diversity loss seems to diminish since the beginning of the program, meaning a better use of the broodstock, resulting from the increase of the turnover in the broodstock. On average the observed loss of genetic diversity is 1.08% (±0,09%) each year.
Figure 13: Effective size of the F0 broodstock and genetic diversity loss between F0 and F1
To evaluate if this loss of genetic diversity had an impact on F1 breeders through years, genetic diversity indices were also been calculated for all captive F1 breeders. No significant loss of genetic diversity was found through years, neither on HE or AR (calculated on 942
individuals). We also compared expected and observed heterozygosity between F0 and F1 and no significant differences were found.
3.3.3 F1 breeding plan and outcomes.
The same analysis as in 3.3.1 were conducted on all F1 multiplication fish farms. The sex ratio and the number of utilization of fish in the broodstocks did not vary between 2008 and 2019. Number of fish in the broodstocks each is available in Table 4. The main difference with Bergerac broodstock is that the number of breeders is far more important in each farm. Consequences are that almost no crosses are duplicated through spawning seasons and that for a given fish, the number of reuse is less important in those multiplication centers.
3.3.4 Genetic variability of F1 captive broodstock and impact on F2 generation.
Table 4 presents the genetic diversity indices calculated for all captive breeders F1 together. We also calculated these indices within each fish farm. No significant evolution was observed except for Cauterets fish farm where genetic diversity indices showed a clear difference between 2008 to 2010 period and 2011 to 2019 period. Indeed, the composition of the broodstock in the first years of the study (2008-2010) differed slightly from the actual one
0,0% 0,2% 0,4% 0,6% 0,8% 1,0% 1,2% 1,4% 1,6% 1,8% 0 10 20 30 40 50 60 70 2008 2009 2010 2011 2012 2013 2014 2015 2016 G en etic d iv ers ity los s Ef fiic ie n t size o f F0 b ro o sto ck Year of spawning