Universit´e de Montr´eal
Relev´e et analyse spectroscopiques d’´etoiles naines blanches brillantes et riches en hydrog`ene
par
Alexandros Gianninas D´epartement de physique Facult´e des arts et des sciences
Th`ese pr´esent´ee `a la Facult´e des ´etudes sup´erieures en vue de l’obtention du grade de
Philosophiæ Doctor (Ph.D.) en physique
Aoˆut, 2011
c
Cette th`ese intitul´ee:
Relev´e et analyse spectroscopiques d’´etoiles naines blanches brillantes et riches en hydrog`ene
pr´esent´ee par:
Alexandros Gianninas
a ´et´e ´evalu´ee par un jury compos´e des personnes suivantes: Fran¸cois Wesemael, Pr´esident-rapporteur
Pierre Bergeron, Directeur de recherche Nicole St-Louis, Membre du jury Martin Barstow, Examinateur externe
Karen Waldron, Repr´esentante du Doyen de la FES
Sommaire
Nous pr´esentons un relev´e et une analyse spectroscopiques de plus de 1300 naines blanches brillantes (V ≤ 17.5) et riches en hydrog`ene. Des spectres dans le domaine du visible avec un rapport signal-sur-bruit ´elev´e ont ´et´e obtenus et les donn´ees ont ensuite ´et´e analys´ees avec notre m´ethode spectroscopique habituelle qui compare les profils observ´es des raies de Balmer `
a des spectres synth´etiques calcul´es `a partir de la derni`ere g´en´eration de mod`eles d’atmosph`ere. D’abord, nous pr´esentons une analyse d´etaill´ee de 29 naines blanches de type DAO utilisant une nouvelle grille de mod`eles qui inclut du carbone, de l’azote et de l’oxyg`ene aux abondances solaires. Nous d´emontrons que l’ajout de ces m´etaux dans les mod`eles d’atmosph`ere est es-sentiel pour surmonter le probl`eme des raies de Balmer qui empˆeche un ajustement simultan´e de toutes les raies de Balmer avec des param`etres atmosph´eriques coh´erents. Nous identifions ´egalement 18 naines blanches chaudes de type DA qui souffrent aussi du probl`eme des raies de Balmer. Des spectres dans l’ultraviolet lointain obtenus des archives du satellite FUSE sont ensuite examin´es pour d´emontrer qu’il existe une corr´elation entre les abondances m´etalliques ´elev´ees et les cas du probl`eme des raies de Balmer. Les cons´equences de ces r´esultats pour toutes les naines blanches chaudes et riches en hydrog`ene sont discut´ees. En particulier, le sc´enario ´evolutif pour les naines blanches DAO est r´evis´e et nous n’avons plus besoin d’´evoquer l’´evolution post-EHB pour expliquer la majorit´e des ´etoiles DAO. Finalement, nous ´elaborons un sc´enario dans lequel les m´etaux engendrent un faible vent stellaire qui expliquerait la pr´esence d’h´elium dans les ´etoiles DAO.
Ensuite, nous pr´esentons les r´esultats globaux de notre relev´e, ce qui inclut une analyse spectroscopique de plus de 1200 naines blanches de type DA. En premier lieu, nous pr´esentons le contenu spectroscopique de notre ´echantillon qui contient de nombreuses classifications
er-ron´ees ainsi que plusieurs naines blanches de type DAB, DAZ et magn´etiques. Nous discutons ensuite des nouveaux mod`eles d’atmosph`ere utilis´es dans notre analyse. De plus, nous utilisons des mod`eles de naines M pour obtenir de meilleures valeurs des param`etres atmosph´eriques pour les naines blanches qui sont membres de syst`emes binaires DA+dM. Certaines naines blanches uniques et quelques syst`emes binaires double-d´eg´en´er´ees sont ´egalement analys´es de mani`ere plus d´etaill´ee. Nous examinons ensuite les propri´et´es globales de notre ´echantillon incluant la distribution de masse et la distribution de masse en fonction de la temp´erature. Nous ´etudions ´egalement la fa¸con dont les nouveaux profils de raies de Balmer affectent la d´etermination des param`etres atmosph´eriques. Nous testons la pr´ecision et la robustesse de nos m´ethodes en comparant nos r´esultats avec ceux du projet SPY, dans le cadre duquel plus de 300 des mˆemes naines blanches ont ´et´e analys´ees d’une mani`ere compl`etement ind´ependante. Finalement, nous faisons un retour sur la bande d’instabilit´e des naines blanches pulsantes de type ZZ Ceti pour voir quels effets ont les nouveaux profils de raies sur la d´etermination de ses fronti`eres empiriques.
Mots clefs:
´etoiles : abondances – ´etoiles : atmosph`eres – ´etoiles: ´evolution – ´etoiles: param`etres fonda-mentaux – naines blanches
Abstract
We present a spectroscopic survey and analysis of over 1300 bright (V ≤ 17.5), hydrogen-rich white dwarfs. High signal-to-noise ratio optical spectra were obtained and are then ana-lyzed using our standard spectroscopic technique which compares the observed Balmer line profiles to synthetic spectra computed from the latest generation of model atmospheres. First, we present a detailed analysis 29 DAO white dwarfs using our new up-to-date model atmos-phere grids in which we have included carbon, nitrogen, and oxygen at solar abundances. We demonstrate that the inclusion of these metals in the model atmospheres is essential in overcoming the Balmer-line problem, which manifests itself as an inability to fit all the Bal-mer lines simultaneously with consistent atmospheric parameters. We also identify 18 hot DA white dwarfs that also suffer from the Balmer-line problem. Far ultraviolet spectra from the FUSE archive are then examined to demonstrate that there exists a correlation between higher metallic abundances and instances of the Balmer-line problem. The implications of these findings for all hot, hydrogen-rich white dwarfs are discussed. Specifically, the possible evolutionary scenario for DAO white dwarfs is revised and post-EHB evolution need no longer be invoked to explain the evolution for the majority of the DAO stars. Finally, we discuss how the presence of metals might drive a weak stellar wind which in turn could explain the presence of helium in DAO white dwarfs.
We then present the complete results from our survey, including the spectroscopic analysis of over 1200 DA white dwarfs. First we present the spectroscopic content of our sample which includes many misclassifications as well as several DAB, DAZ and magnetic white dwarfs. We then discuss the new model atmospheres we employ in our analysis. In addition, we use M dwarf templates to obtain better estimates of the atmospheric parameters for those white
dwarfs which are in DA+dM binary systems. A handful of unique white dwarfs and double-degenerate binary systems are also analyzed in greater detail. We then examine the global properties of our sample including the mass distribution and mass distribution as a function of temperature. Next, we look at how the new Balmer-line profiles affect the determination of the atmospheric parameters. We then proceed to test the accuracy and robustness of our method by comparing our results to those of the SPY survey which has analyzed over 300 of the same white dwarfs in a completely independent manner. Finally, we also re-visit the ZZ Ceti instability strip and how the determination of its empirical boundaries is affected by the latest line profile calculations.
Subject headings:
stars: abundances – stars: atmospheres – stars: evolution – stars fundamental parameters – white dwarfs
Table des mati`
eres
Sommaire iii
Abstract v
Table des mati`eres vii
Liste des figures x
Liste des tableaux xiv
Remerciements xv
1 Introduction 1
1.1 Les premi`eres naines blanches . . . 2
1.2 Les relev´es de mouvements propres: Luyten et Giclas . . . 3
1.3 Les relev´es par exc`es dans l’ultraviolet: Palomar-Green et Kiso Ultraviolet Excess 5 1.4 Les relev´es Montr´eal-Cambridge-Tololo et Edinburgh-Cape . . . 6
1.5 Les relev´es Hamburg-Schmidt et Hamburg-ESO . . . 7
1.6 Le Sloan Digital Sky Survey . . . 7
1.7 Classification spectrale . . . 8
1.8 Le catalogue de McCook & Sion . . . 12
1.9 Format de cette th`ese . . . 13
2 SPECTROSCOPIC ANALYSIS OF HOT, HYDROGEN-RICH WHITE vii
DWARFS: THE PRESENCE OF METALS AND THE BALMER-LINE
PROBLEM 14
2.1 ABSTRACT . . . 15
2.2 INTRODUCTION . . . 15
2.3 SPECTROSCOPIC OBSERVATIONS . . . 21
2.4 MODEL ATMOSPHERES AND SYNTHETIC SPECTRA . . . 25
2.5 SPECTROSCOPIC ANALYSIS . . . 32
2.5.1 Fitting Technique . . . 32
2.5.2 DAO white dwarfs . . . 33
2.5.3 Hot DA white dwarfs . . . 38
2.5.4 Atmospheric Parameters . . . 42 2.6 FUSE Observations . . . 48 2.7 DISCUSSION . . . 57 2.7.1 DAOZ . . . 59 2.7.2 PG 1210+533 . . . 60 2.7.3 Correlations . . . 62 2.8 CONCLUSION . . . 63 2.9 REFERENCES . . . 65
3 A SPECTROSCOPIC SURVEY AND ANALYSIS OF BRIGHT, HYDROGEN-RICH WHITE DWARFS 70 3.1 ABSTRACT . . . 71
3.2 INTRODUCTION . . . 71
3.3 SPECTROSCOPIC CONTENT . . . 74
3.4 MODEL ATMOSPHERES . . . 87
3.4.1 Pure hydrogen atmosphere models . . . 87
3.4.2 Hydrogen atmosphere models with CNO . . . 88
3.4.3 Helium atmosphere models . . . 89
3.5 SPECTROSCOPIC ANALYSIS . . . 89
TABLE DES MATI`ERES ix
3.5.2 Effects of new Stark profile calculations . . . 91
3.5.3 DAB white dwarfs . . . 94
3.5.4 DAZ white dwarfs . . . 98
3.5.5 DA+dM binary systems . . . 99
3.5.6 Magnetic, and cool white dwarfs . . . 105
3.5.7 Peculiar Objects . . . 108
3.6 GLOBAL PROPERTIES & DISCUSSION . . . 115
3.6.1 Adopted atmospheric parameters . . . 115
3.6.2 Comparison with SPY . . . 146
3.6.3 Comparison with SDSS . . . 151
3.6.4 Comparison with parallax measurements . . . 151
3.6.5 Mass distribution . . . 153
3.6.6 Revisiting the PG luminosity function . . . 157
3.6.7 ZZ Ceti instability strip . . . 158
3.7 CONCLUSION . . . 163
3.8 REFERENCES . . . 166
4 Conclusion 173 4.1 R´esum´e . . . 173
4.2 Importance des r´esultats . . . 175
4.3 Perspectives d’avenir . . . 176
Bibliographie 179
Annexes 182
A Solutions pour les ´etoiles DAO et DA+BP 182
B Solutions pour les ´etoiles DA 186
C Solutions pour les syst`emes binaires DA+dM 244
1.1 Mouvement propre de Sirius A et B . . . 2
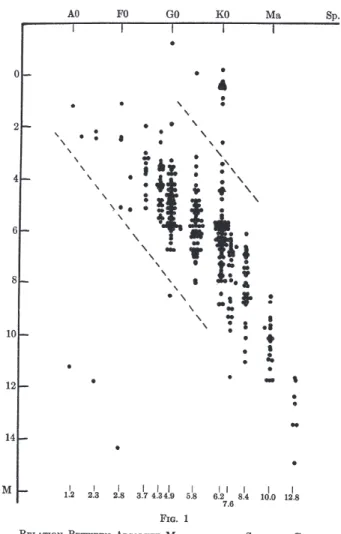
1.2 Type spectrale versus magnitude absolue . . . 4
1.3 Extrait de la Table 1 de Kuiper (1941) . . . 8
1.4 Table 3 de Luyten (1952) . . . 9
1.5 Table 1 de Sion et al. (1983) . . . 10
1.6 Table 1 de McCook & Sion (1999) . . . 11
2.1 Optical spectra for the 29 DAO white dwarfs in our sample . . . 23
2.2 Distribution of S/N for our 29 DAO white dwarfs and the 16 SDSS DAO white dwarfs . . . 24
2.3 Normalized Balmer-line profiles computed for different He abundances both in LTE and NLTE . . . 27
2.4 Temperature structure as a function of column mass for a reference model atmosphere computed in LTE, NLTE, with CNO and with CNO enhanced by a factor of 10 . . . 28
2.5 Normalized Balmer-line profiles computed in NLTE with and without CNO . . 30
2.6 Comparison of the observed line profiles for BD+28 4211 and LS V+46 21 with synthetic spectra obtained from model atmospheres with and without CNO . . 31
2.7 A synthetic spectrum computed from a model containing CNO is fit with a pure H/He grid and a synthetic spectrum computed from a model with a CNO abundance enhanced by a factor of 10 is fit with a H/He/CNO grid . . . 32
LISTE DES FIGURES xi
2.8 Typical fits of observed Balmer-line profiles and He ii λ4686 for DAO white
dwarfs using models with and without CNO . . . 34
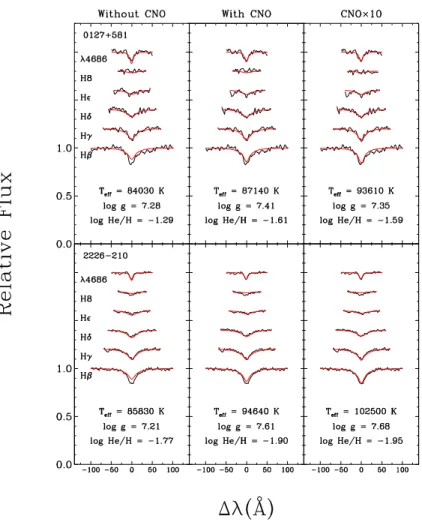
2.9 Fits to the observed Balmer-line profiles and He ii λ4686 for 0127+581 and 2226−210 using increasing abundances of CNO from none, to solar, and finally 10 times solar . . . 35
2.10 Fits to the He ii λ4686 line profile of PG 1210+533 . . . 37
2.11 Same as Figure 2.8 but for DA white dwarfs showing the Balmer-line problem. 39 2.12 Results from the fits of our CNO grid using a grid that does not contain any metals for different abundances of helium . . . 40
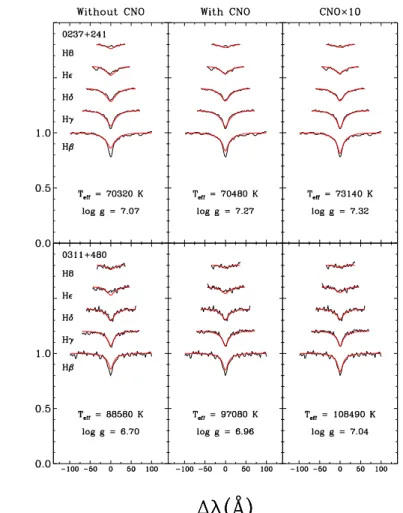
2.13 Fits to the observed Balmer-line profiles for 0237+241 and 0311+480 using increasing abundances of CNO from none, to solar, and finally 10 times solar . 41 2.14 Section of the log g vs log Teff diagram showing the hot end of the DA white dwarf cooling sequence . . . 45
2.15 Mass distribution for our entire sample of hot white dwarfs and of the DAO white dwarfs . . . 48
2.16 Selected regions of the FUSE spectra for six normal DA white dwarfs . . . 52
2.17 Same as Figure 2.16 but for six normal DA white dwarfs with some metals. . . 53
2.18 Same as Figure 2.16 but for six DA white dwarfs exhibiting the Balmer-line problem. . . 54
2.19 Same as Figure 2.16 but for six DAO white dwarfs exhibiting the Balmer-line problem. . . 55
2.20 Same as Figure 2.16 but for two peculiar DAO white dwarfs. . . 56
2.21 Optical spectra of the four DAOZ white dwarfs in our sample . . . 59
2.22 Comparison of our spectrum of PG 1210+533 with spectra obtained over the course of the last 30 years . . . 61
2.23 Correlations between the atmospheric parameters of DAO stars . . . 62
3.1 Distribution of visual magnitudes . . . 76
3.2 Distribution of S/N . . . 77
3.4 Sample optical spectra of DA white dwarfs . . . 82
3.5 Optical spectra of magnetic DA white dwarfs . . . 83
3.6 Optical spectra of miscellaneous spectral types . . . 84
3.7 Optical spectra of DA+dM binary systems . . . 86
3.8 Model fits of a sample of DA white dwarfs . . . 90
3.9 Comparison of log g and Teff using the Lemke (1997) and TB09 profiles . . . . 93
3.10 Mass vs. Teff distributions using the Lemke (1997) and TB09 profiles . . . 94
3.11 Model fits of DA+DB binary systems . . . 95
3.12 Model fit of the DAB white dwarf 0209+085 . . . 97
3.13 Model fits for four DAZ white dwarfs . . . 98
3.14 Model fits for six DA+dM binary systems with no red spectra . . . 100
3.15 Models for four DA+dM binary systems with no contamination in their blue spectra . . . 100
3.16 Best fits for four DA+dM binary systems . . . 102
3.17 Fit to a DA+dM binary system before and after subtraction of contamination. 103 3.18 Models fits of magnetic white dwarfs . . . 105
3.19 Model fits of three peculiar white dwarfs . . . 108
3.20 Fits to the energy distribution of 0239+109 and 0927−173 . . . 109
3.21 Model fit to the DA+DC binary 0239+109 . . . 110
3.22 Comparison of energy distributions between the best fit DA+DC model and the observed spectrum of 0239+109 . . . 111
3.23 Comparison of the observed spectrum of 0737−384 to synthetic spectra correc-ted for interstellar reddening . . . 112
3.24 Model fit to the DA+DC binary 0927−173 . . . 114
3.25 Comparison of energy distributions between the best fit DA+DC model and the observed spectrum of 0927−173 . . . 114
3.26 Comparison of Teff and log g between the results from SPY and our results using the Lemke (1997) profiles . . . 147
LISTE DES FIGURES xiii
3.27 Comparison of Teff and log g between the results of fits to our spectra and those
from SPY, using the Lemke (1997) profiles . . . 149
3.28 Comparison of Teff and log g between the results of fits to our spectra and those from SDSS . . . 150
3.29 Comparison of absolute magnitudes derived from parallax measurments and our spectroscopic determinations . . . 152
3.30 Mass distribution as a function of Teff . . . 153
3.31 Mass distribution for all the stars listed in Table 3.5 . . . 155
3.32 Luminosity function of the PG sample recomputed using the atmospheric pa-rameters determined in this work . . . 158
3.33 Teff-log g distribution near the ZZ Ceti instability strip for our photometric sample . . . 159
3.34 Differences in Teff near the ZZ Ceti instability strip using the Lemke (1997) and TB09 profiles . . . 159
3.35 Teff-log g distribution near the ZZ Ceti instability strip for our entire sample . . 162
A.1 Solutions spectroscopiques pour les 29 ´etoiles DAO . . . 183
A.2 Solutions spectroscopiques pour les 17 ´etoiles DA+BP . . . 185
B.1 Solutions spectroscopiques pour les ´etoiles DA . . . 187
2.1 Ions Included in the Model Atmospheres . . . 29
2.2 Atmospheric Parameters of DAO White Dwarfs . . . 43
2.3 Atmospheric Parameters of DA White Dwarfs with the Balmer Line Problem . 44 2.4 List of FUSE Observations . . . 49
2.5 Selected Wavelength Intervals and Central Wavelengths in FUSE Data . . . 51
3.1 Misclassified Objects . . . 79
3.2 Breakdown of Spectral Types . . . 87
3.3 Parameters for Magnetic White Dwarfs . . . 106
3.4 Parameters for Cool White Dwarfs . . . 107
3.5 Atmospheric Parameters of DA white dwarfs from MS99 . . . 118
Remerciements
“Ideal teachers are those who use themselves as bridges over which they invite their students to cross, then having facilitated their crossing, joyfully collapse, encouraging them to create bridges of their own.” – Nikos Kazantzakis
Je crois que cette citation repr´esente bien la philosophie de mon directeur de recherche, Pierre Bergeron, vis-`a-vis de ses ´etudiants au doctorat et sans lui, je n’aurais jamais r´eussi `
a me rendre jusqu’ici. Je suis endett´e `a Pierre pour tout son appui, son enthousiasme, son encouragement et l’encadrement qu’il m’a fourni, mais ´egalement pour tous les coups de pied aux fesses qu’il m’a donn´es au fil des ann´ees.
J’aimerais ´egalement remercier mes collaborateurs Jean Dupuis et Maria Teresa Ruiz. Je veux aussi remercier Gilles Fontaine de son aide indispensable durant la d´ecouverte de ma premi`ere ´etoile ZZ Ceti, pour toutes les histoires qu’il raconte, et ´egalement pour son enthousiasme envers son travail. J’esp`ere que ma passion pour l’astronomie demeurera aussi forte que la sienne.
Je dois aussi remercier tous mes coll`egues de bureau, ceux qui sont encore ici ainsi que certains qui sont d´ej`a partis : Robert, Patrick, Pier-Emmanuel, Guy, Pierre, Marie-Mich`ele et Noemi avec qui j’ai pass´e de bons moments, tant au bureau qu’en mission d’observation, en assistant `a des conf´erences et bien sˆur au pub!
Finalement, j’aimerais remercier ma m`ere et mon fr`ere de leur appui et encouragement durant des moments difficiles; mes amis, Tony, Sevy, Christos, Alexandra et Ritsa qui sont toujours l`a pour moi; tous mes co´equipiers au soccer avec qui je me d´efoule au moins une fois par semaine; et la derni`ere, mais certainement non la moindre, ma dulcin´ee Dina, qui a cru en moi d`es le d´ebut.
Chapitre 1
Introduction
Depuis les d´ebuts de l’astrophysique, l’´evolution stellaire est demeur´ee un des champs de recherche les plus importants sur lequel se penchent les astrophysiciens. On cherche ici `a comprendre comment les ´etoiles se forment, ´evoluent et finalement meurent. Contrairement aux ´etoiles massives qui finiront leur vie de mani`ere spectaculaire dans une explosion de supernova, les ´etoiles qui ont une masse inf´erieure `a huit fois la masse du Soleil finiront leur vie de fa¸con plus paisible. Ces ´etoiles subiront une phase de perte de masse importante o`u les couches externes de l’´etoile seront ´eject´ees et le noyau r´esiduel se contractera pour former ce qu’on appelle une ´etoile naine blanche. Les naines blanches repr´esentent le stade final dans la vie d’environ 97% de toutes les ´etoiles dans la Galaxie. Donc, si on veut en arriver `a une compr´ehension globale de l’´evolution stellaire, il est imp´eratif d’´etudier et de comprendre comment les ´etoiles naines blanches se forment et ´evoluent.
Dans cette th`ese, nous pr´esenterons les r´esultats de notre relev´e spectroscopique d’´etoiles naines blanches tir´ees de la plus importante r´ef´erence dans le domaine des naines blanches : le catalogue de McCook & Sion (1999). Dans le but de placer notre ´etude dans un contexte appropri´e, il est important de comprendre les origines du catalogue. Dans les prochaines sections, nous pr´esenterons l’histoire de la d´ecouverte des toutes premi`eres naines blanches, des importants relev´es qui ont suivi, jusqu’aux r´esultats r´ecents du Sloan Digital Sky Survey. L’ensemble de ces efforts a permis la d´ecouverte de la grande majorit´e des naines blanches qui sont le sujet de notre analyse. Nous exposerons ainsi les raisons qui ont motiv´e la cr´eation
Figure 1.1 – (A) Mouvement propre de Sirius A et B dans le ciel et (B) mouvement orbital de Sirius A et B relatif au centre de masse.
du catalogue de McCook & Sion mais ´egalement la motivation derri`ere ce projet.
1.1
Les premi`
eres naines blanches
La premi`ere naine blanche observ´ee est une des ´etoiles du syst`eme triple 40 Eridani, sp´ecifiquement 40 Eri B. La paire d’´etoiles 40 Eri B/C a ´et´e observ´ee pour la premi`ere fois par l’astronome anglais, d’origine allemande, Friedrich Willhelm Herschel en 1783. Plus tard, en 1910, Henry Norris Russell, Edward Charles Pickering et Williamina Fleming ont d´ecouvert que 40 Eri B, en d´epit du fait qu’elle soit tr`es peu brillante, ´etait de type spectral “A”. Le type spectral de 40 Eri B est officiellement d´ecrit par Adams (1914) (et de nouveau dans Adams
1.2. LES RELEV ´ES DE MOUVEMENTS PROPRES: LUYTEN ET GICLAS 3
& Pease 1914) qui la classifie comme une ´etoile de type A0.
La deuxi`eme naine blanche observ´ee est Sirius B. Dans un premier temps, en 1844, l’astro-nome allemand Friedrich Bessell d´eduit que Sirius A devait avoir un compagnon parce que le mouvement propre de l’´etoile ne suivait pas une trajectoire rectiligne (voir Figure 1). En 1862, l’opticien am´ericain Alvan Graham Clark observe le compagnon de Sirius A pour la premi`ere fois durant une mise au point du nouveau r´efracteur de 18.5 pouces destin´e au Dearborn Observatory `a Evanston en Illinois. Ensuite, Adams (1915) observe Sirius B et d´etermine que c’est une ´etoile de faible magnitude dont le spectre est quasiment identique `a celui de Sirius A, une ´etoile de type spectrale A. Cela vient confirmer que Sirius B est la deuxi`eme naine blanche `a ˆetre identifi´ee, apr`es 40 Eri B.
Finalement, en 1917, Adriaan van Maanen d´ecouvre “l’´etoile de van Maanen” (van Maa-nen 2), une naine blanche isol´ee (van MaaMaa-nen 1917). Mais la valeur de la parallaxe mesur´ee par van Maanen implique que ce soit l’´etoile de type F la moins brillante, en magnitude absolue, connue `a l’´epoque. Plus tard, Luyten (1923) publie une ´etude d’´etoiles ayant des mouvements propres sup´erieurs `a 0.′′
50 par ann´ee. Parmi ces ´etoiles, Luyten identifie l’´etoile de van Maanen comme une des trois naines blanches connues. Ce sont toutes des ´etoiles peu brillantes compte tenu de leur type spectral. Dans la Figure 1.2, on peut voir les trois naines blanches bien en dessous et `a la gauche des ´etoiles de la s´equence principale. Dans un contexte plus g´en´eral, Luyten (1922a) identifie les trois ´etoiles mentionn´ees ci-haut comme des ´etoiles blanches peu brillantes (faint white stars) pour ensuite utiliser le terme “naine blanche” (white dwarf) pour la premi`ere fois dans Luyten (1922b). Les naines blanches sont ainsi baptis´ees.
1.2
Les relev´
es de mouvements propres: Luyten et Giclas
Que Willem Jacob Luyten fˆut en quelque sorte le “parrain” des naines blanches n’est peut-ˆetre pas une co¨ıncidence puisqu’il allait, durant une longue carri`ere, d´ecouvrir des cen-taines de nouvelles naines blanches. Premier ´etudiant `a obtenir son doctorat sous la direction d’Ejnar Hertzsprung en 1921, Luyten s’´etablit ´eventuellement `a l’Universit´e du Minnesota en 1931, o`u il travaillera le reste de sa vie. Comme en t´emoigne la section pr´ec´edente, Luy-ten s’int´eresse aux naines blanches tr`es tˆot dans sa carri`ere. Apr`es les premi`eres d´ecouvertes,
Figure1.2 – Diagramme de type spectral versus la magnitude absolue pour les ´etoiles ´etudi´ees dans Luyten (1923). On voit bien les trois naines blanches (40 Eri B, Sirius B et Van Maanen 2) en bas `a gauche.
l’identification de nouvelles naines blanches fut lente: en 1939, seulement 18 naines blanches ´etaient connues (Schatzman 1958). Luyten (1950) explique qu’apr`es les d´ecouvertes initiales, il entame un relev´e spectroscopique d’´etoiles faibles avec un grand mouvement propre. Il se rend compte que cette technique n’est pas tr`es efficace pour trouver de nouvelles naines blanches et il concentre donc ses efforts pour augmenter le nombre potentiel de naines blanches par l’entremise de relev´es de mouvements propres compl´et´es par des observations photom´etriques. La photom´etrie ainsi obtenue permet de calculer des indices de couleurs `a partir desquels les naines blanches peuvent ˆetre identifi´ees. Ainsi, Luyten publie durant une p´eriode de 40 ans les r´esultats de ses travaux dans une s´erie de catalogues dans lesquels il rapporte la d´ecouverte
1.3. LES RELEV ´ES PAR EXC `ES DANS L’ULTRAVIOLET: PG ET KUV 5
de plusieurs centaines de naines blanches. Parmi les plus connus de ces relev´es on retrouve les relev´es Luyten Two Tenths (LTT, Luyten 1957), Bruce Proper Motion (BPM, Luyten 1963) et Luyten Half Second (LHS Luyten 1979).
Henry Lee Giclas, un contemporain de Luyten, travaillait au Lowell Observatory, `a Flag-staff en Arizona, o`u il entreprend ´egalement un relev´e de mouvements propres. Avant l’´epoque de Giclas, Percival Lowell, le fondateur de l’observatoire, avait ´etabli comme projet la recherche de la plan`ete Pluton. Pour ce faire, il initie un relev´e de tout le ciel nocturne observable de-puis Flagstaff. Malheureusement, il ne r´eussit pas `a trouver Pluton avant son d´ec`es en 1916, et le projet est ´eventuellement accord´e `a Clyde Tombaugh qui r´eussit l’exploit le 18 f´evrier 1930. Giclas, lui, cherche une fa¸con d’exploiter toutes les plaques photographiques qui avaient ´et´e obtenues durant la quˆete de Pluton. Giclas (1958) pr´esente le projet qui d´efinira le reste de sa carri`ere. Une nouvelle s´erie de plaques photographiques sera obtenue pour ainsi mener un relev´e de mouvements propres en conjonction avec les vieilles plaques photographiques de Lowell. Le produit final consiste en deux grands catalogues. Premi`erement, un catalogue d’objets qui ont un mouvement propre, µ > 0.′′26 yr−1 (les objets G, Giclas et al. 1971) et un deuxi`eme catalogue d’objets avec µ < 0.′′26 yr−1 et choisis selon leurs couleurs U − B et B − V dans le but d’identifier de nouvelles naines blanches (les objets GD, Giclas et al. 1965). Il contribue ainsi `a l’essor de la recherche sur les naines blanches avec la d´ecouverte de plusieurs centaines de nouvelles ´etoiles de ce type.
1.3
Les relev´
es par exc`
es dans l’ultraviolet: Palomar-Green et
Kiso Ultraviolet Excess
Les ann´ees 80 ont vu l’arriv´ee de relev´es qui avaient pour but d’identifier des objets avec des exc`es dans l’ultraviolet. Dans un premier temps, le relev´e Palomar-Green (PG, Green et al. 1986) avait ´et´e entam´e pour tenter de trouver des quasars. Le relev´e PG s’´etend sur presqu’un quart du ciel avec des latitudes galactiques b ≥ 30◦
et des d´eclinaisons plus grandes que −10◦ . Des plaques photographiques sont obtenues sur le t´elescope de 18 pouces du Mont Palomar et tous les objets avec U − B < −0.46 sont ensuite observ´es en spectroscopie. Malheureusement,
le relev´e PG fut un ´echec `a cet ´egard avec seulement 93 nouveaux quasars d´etect´es sur un total de 1715 objets. Par contre, le relev´e PG a permis la d´ecouverte de centaines d’objets bleus, notamment des ´etoiles de type sous-naine, mais ´egalement plusieurs centaines de naines blanches (Fleming et al. 1986; Liebert et al. 2005). En parall`ele, mais de l’autre cˆot´e de l’oc´ean Pacifique, s’effectuait le relev´e Kiso Ultraviolet Excess (KUV, Noguchi et al. 1980; Kondo et al. 1984). En utilisant le t´elescope de 105 cm de l’observatoire Kiso, 1186 objets sont identifi´es dans une ceinture du pˆole nord au pˆole sud galactique `a une longitude galactique de 180◦
. Encore une fois, plusieurs centaines de naines blanches sont catalogu´ees (Darling 1994; Limoges & Bergeron 2010). Un des avantages de ce genre de relev´e est la possibilit´e de d´efinir une magnitude limite en de¸ca de laquelle on peut consid´erer que le relev´e est complet. Ceci permet de calculer une fonction de luminosit´e pour la population de naines blanches, ce qui m`ene `a une mesure de la densit´e spatiale et du taux de formation de ces ´etoiles dans le voisinage solaire.
1.4
Les relev´
es Montr´
eal-Cambridge-Tololo et Edinburgh-Cape
Contrairement aux relev´es PG et KUV, les relev´es Montr´eal-Cambridge-Tololo (MCT, Demers et al. 1986) et Edinburgh-Cape (EC, Stobie et al. 1987) avaient comme but principal la d´ecouverte d’objets stellaires bleus, surtout des ´etoiles naines blanches. Ces deux relev´es se distinguent ´egalement par le fait qu’ils ont ´et´e r´ealis´es dans l’h´emisph`ere sud. Demers et al. (1986) avaient not´e le besoin d’exploiter le ciel de l’h´emisph`ere sud puisque seulement environ 18% des naines blanches connues `a l’´epoque s’y trouvait. Cependant, les difficult´es reli´ees `a la gestion, `a partir de Montr´eal, d’un relev´e dans l’h´emisph`ere sud, plus pr´ecis´ement au Chili, ont fait en sorte que seulement le tiers du suivi spectroscopique du relev´e MCT fut compl´et´e. Lamontagne et al. (2000) pr´esentent ces r´esultats et les statistiques indiquent qu’environ 30% des candidats observ´es en spectroscopie sont des naines blanches. De fa¸con tr`es similaire, des r´esultats partiels du relev´es EC sont pr´esent´es dans Kilkenny et al. (1997), mais le rendement en naines blanches est plus faible; seulement 15% de leurs cibles se sont av´er´ees ˆetre des naines blanches. Ceci ´etant dit, contrairement au relev´e MCT, le suivi spectroscopique du relev´e EC continue `a ce jour (Kilkenny et al. 2010).
1.5. LES RELEV ´ES HAMBURG-SCHMIDT ET HAMBURG-ESO 7
1.5
Les relev´
es Hamburg-Schmidt et Hamburg-ESO
Les relev´es Hamburg-Schmidt (HS, Hagen et al. 1995) et Hamburg-ESO (HE, Wisotzki 1994) constituent des relev´es compl´ementaires de l’h´emisph`ere nord et sud, respectivement, qui utilisent un prisme objectif pour obtenir, tout d’abord, des spectres `a basse r´esolution spec-trale pour l’identification de candidats. Les cibles ainsi identifi´ees sont ensuite r´eobserv´ees `a plus haute r´esolution. Encore une fois, le but principal de ces deux relev´es ´etait la d´etection de quasars. L’avantage d’utiliser un prisme objectif plutˆot que des m´ethodes colorim´etriques (voir les relev´es PG et KUV) est qu’on obtient, du premier coup, un spectre de chaque objet. Cela augmente consid´erablement l’efficacit´e du relev´e pour trouver des quasars. N´eanmoins, la plus grande contamination dans un relev´e d’objets bleus provient d’objets stellaires chauds, incluant les ´etoiles naines blanches. Homeier et al. (1998) pr´esentent une analyse spectro-scopique de 80 naines blanches provenant du relev´e HS, tandis que Christlieb et al. (2001) ´elaborent un algorithme pour d´etecter des naines blanches dans les donn´ees du relev´e HE. Ainsi, Christlieb et al. (2001) identifient 440 naines blanches potentielles qui ne sont pas list´ees dans McCook & Sion (1999).
1.6
Le Sloan Digital Sky Survey
Le Sloan Digital Sky Survey (SDSS) est un grand relev´e visant la cr´eation d’une carte tri-dimensionnelle de la distribution de galaxies dans l’Univers. La premi`ere ´etape du re-lev´e a ´et´e de recueillir de la photom´etrie en cinq bandes (ugriz) pour 35% du ciel avec le t´elescope de 2.5 m du Apache Point Observatory, au Nouveau-Mexique. `A partir des donn´ees photom´etriques, une s´election de cibles est faite selon une liste de priorit´es bien ´etablies. En-suite, 660 fibres optiques sont attribu´ees `a des cibles dans chaque champ. Ces fibres optiques sont ensuite achemin´ees vers un spectrographe sp´ecialement con¸cu pour ce relev´e qui permet de prendre un spectre pour chaque fibre optique simultan´ement. Cependant, les champs ne contiennent pas tous 660 galaxies et donc les fibres restantes sont attribu´ees `a d’autres types d’objets, incluant des ´etoiles naines blanches. Des milliers de nouvelles naines blanches ont ´et´e ainsi d´ecouvertes comme produit secondaire du SDSS. Malheureusement, la majorit´e des
Figure 1.3 – Extrait de la Table 1 de Kuiper (1941) qui montre le premier syst`eme de classification spectrale pour les ´etoiles naines blanches.
donn´ees du SDSS ont un rapport signal-sur-bruit (S/N) faible en raison du temps de pose fixe pour chaque champ. En d’autres mots, moins une ´etoile est brillante, plus le S/N du spectre obtenu est faible. N´eanmoins, avec la publication du catalogue de naines blanches d´ecouvertes dans le Data Release 4, Eisenstein et al. (2006) ont quadrupl´e le nombre de naines blanches connues. Depuis ce temps, les publications subs´equentes des ensembles de donn´ees du SDSS ont fait en sorte que le nombre de naines blanches connues et identifi´ees spectroscopiquement frˆole maintenant les 13,000. Ce nombre va bientˆot augmenter de nouveau avec la publication des r´esultats du Data Release 7 (Kleinman 2010).
1.7
Classification spectrale
Mˆeme avant la d´ecouverte de ces centaines, voire milliers, de nouvelles naines blanches dans tous ces divers relev´es, il devenait n´ecessaire de pouvoir classifier les spectres de ces ´etoiles. Une premi`ere tentative a ´et´e faite par Kuiper (1941) qui pr´esenta une liste de 38 ´etoiles naines
1.7. CLASSIFICATION SPECTRALE 9
Figure 1.4 – Table 3 de Luyten (1952) qui montre un nouveau syst`eme de classification spectrale pour les ´etoiles naines blanches.
blanches. Le syst`eme ´elabor´e par Kuiper ´etait bas´e sur le syst`eme de classification spectrale de Harvard ´etabli par Cannon & Pickering (1912) avec un w devant la classification Harvard pour indiquer que c’est une naine blanche. Ainsi, une naine blanche dont le spectre ressemble `
a une ´etoile de type A est classifi´ee wA (ex. 40 Eri B) et ainsi de suite pour les autres types spectraux (wF, wG, etc). Les naines blanches dont les spectres n’affichent aucune raie spectrale sont classifi´ees Con. Dans la Figure 1.3, nous pr´esentons un extrait de la Table 1 tir´e de Kuiper (1941) o`u l’on voit la classification dans la colonne Sp. Cependant, un nouveau syst`eme est introduit dans Luyten (1952), un syst`eme qui formera la base du syst`eme de classification
Figure 1.5 – Table 1 de Sion et al. (1983) qui pr´esente le syst`eme de classification spectrale pour les ´etoiles naines blanches de Greenstein (1960).
spectrale actuel. Dans le syst`eme de Luyten, les w sont remplac´es par un “D”. Ainsi une ´etoile classifi´ee wA par Kuiper est maintenant classifi´ee DA dans le nouveau syst`eme. Luyten d´efinit les naines blanches DA comme des ´etoiles dont le spectre est domin´e par les raies de Balmer de l’hydrog`ene tandis que les ´etoiles qui montrent uniquement des raies d’h´elium dans leur spectre sont classifi´ees DB. D’autre part, van Maanen 2, dont le spectre est caract´eris´e par la pr´esence de raies de calcium, est d´esign´ee DF et les naines blanches anciennement classifi´ees Con sont rebaptis´ees DC. Outre l’appellation DF, les d´efinitions des autres types spectraux demeureront inchang´ees. On peut voir le nouveau syst`eme de Luyten (1952) dans la Figure 1.4.
Avec la d´ecouverte de divers nouveaux types d’´etoiles naines blanches, Greenstein (1960) ´etend le syst`eme de Luyten et y introduit de nouvelles cat´egories (ex. DO, pour les ´etoiles avec des raies d’h´elium ionis´e), mais aussi une classification hybride (DA,F) pour les naines blanches qui montrent `a la fois des raies d’hydrog`ene et de calcium dans leur spectre. Le nouveau syst`eme de classification de Greenstein est pr´esent´e dans la Figure 1.5. Cependant, Sion et al. (1983) discutent du fait qu’au fil des ann´ees plusieurs types spectraux sont devenus obsol`etes et/ou peu pratiques. De plus, des spectres `a plus haute r´esolution permettent la d´etection de raies plus faibles, ce qui a pour cons´equence le d´eveloppement de classifications hybrides du genre DAZ, DBA, etc. Ainsi, Sion et al. (1983) proposent un nouveau syst`eme de
1.7. CLASSIFICATION SPECTRALE 11
DEFINITION OF PRIMARY SPECTRAL SYMBOLS
Spectral Type Characteristics
DA . . . Only Balmer lines ; no He I or metals present DB . . . He I lines ; no H or metals present
DC . . . Continuous spectrum, no lines deeper than 5% in any part of the electromagnetic spectrum DO . . . He II strong ; He I or H present
DZ . . . Metal lines only ; no H or He lines
DQ . . . Carbon features, either atomic or molecular in any part of the electromagnetic spectrum P . . . Magnetic white dwarfs with detectable polarization
H . . . Magnetic white dwarfs without detectable polarization X . . . Peculiar or unclassiÐable spectrum
E . . . Emission lines are present
? . . . Uncertain assigned classiÐcation ; a colon ( :) may also be used V . . . Optional symbol to denote variability
Figure 1.6 – Table 1 de McCook & Sion (1999) qui d´emontre le syst`eme de classification spectrale pour les ´etoiles naines blanches pr´esentement en vigueur.
classification spectrale mais l’application syst´ematique de celui-ci devra attendre la publication de McCook & Sion (1999).
Les symboles primaires du nouveau syst`eme sont pr´esent´es dans la Figure 1.6. Ces symboles indiquent quelles raies dominent le spectre observ´e de l’´etoile. Si des raies secondaires sont pr´esentes, on peut joindre un (ou deux) symbole(s) suppl´ementaire(s) selon le cas. On peut alors se retrouver avec des ´etoiles de types DQA, DAOZ, etc. D’autres symboles peuvent ´egalement ˆetre rajout´es pour indiquer la pr´esence de raies d’´emission (E) ou d’un champ magn´etique (P et H). Toutefois, ce syst`eme ne permet pas de distinguer entre une ´etoile DA avec une temp´erature effective Teff= 30,000 K ou Teff= 8000 K, malgr´e des diff´erences notables entre les deux spectres respectifs. Luyten (1952) avait d´ej`a introduit un chiffre `a la fin du type spectral entre 0 et 7, pour distinguer les ´etoiles DA avec des raies larges, peu profondes et un maximum d’intensit´e dans le bleu (0-3) contrairement aux DAs avec des raies plus ´etroites et un maximum d’intensit´e dans le rouge (5-7). Ce concept revient dans Sion et al. (1983) et il est ensuite raffin´e dans McCook & Sion (1999) qui proposent le syst`eme actuel o`u l’indice de temp´erature est d´efini de mani`ere quantitative et est donn´e par 10 × θeff(= 50, 400/Teff). Donc, une naine blanche DA avec Teff = 30,000 K serait classifi´ee DA1.7 tandis qu’une ´etoile avec Teff = 8000 K serait classifi´ee DA6.3.
1.8
Le catalogue de McCook & Sion
Un premier catalogue regroupant toutes les naines blanches connues ainsi que toutes les donn´ees astrom´etriques disponibles pour chaque objet fut publi´e par Eggen & Greenstein (1965). Dans les ann´ees suivantes, le nombre de naines blanches augmente consid´erablement et continuera d’augmenter avec l’aide de nombreux groupes qui obtiennent de nouvelles observa-tions photom´etriques et spectroscopiques. Le volume de donn´ees est immense et l’information pertinente est dispers´ee `a travers la litt´erature. George McCook et Ed Sion, de l’Universit´e Villanova, prennent alors l’initiative de r´epertorier toutes les naines blanches connues dans un seul catalogue. Ils d´ecident que ce serait utile, autant pour les observateurs que pour les th´eoriciens, d’avoir acc`es `a une r´ef´erence qui contient une liste exhaustive de tous les naines blanches identifi´ees spectroscopiquement. La premi`ere version du catalogue, McCook & Sion (1977), inclut moins de 600 naines blanches. Plusieurs mises `a jour ont suivi (McCook & Sion 1983, 1987) et la derni`ere version publi´ee est celle de McCook & Sion (1999) avec 2239 naines blanches. Le catalogue, qui continue d’ˆetre mis `a jour r´eguli`erement, est maintenant disponible en ligne1 et contient presque 13,000 naines blanches, en grande partie en raison des contributions r´ecentes du SDSS.
En d´epit de toute l’information contenue dans McCook & Sion (1999)2, il reste que beau-coup de ces ´etoiles n’ont jamais ´et´e observ´ees avec des instruments modernes, ni ´etudi´ees de mani`ere d´etaill´ee avec la derni`ere g´en´eration de mod`eles d’atmosph`ere. Nous avons donc d´efini un ´echantillon de naines blanches bas´e sur McCook & Sion (1999) qui inclut toutes les naines blanches DA (et tous les types secondaires ex. DAO, DAB, DAZ, etc.) avec une magnitude V < 17.5. Tout d’abord, nous voulons obtenir un spectre visible de haut S/N pour chaque ´etoile. Cela nous permet de confirmer la classification de l’objet et ensuite d’effectuer une analyse spectroscopique d´etaill´ee. On peut alors mesurer de fa¸con pr´ecise les param`etres atmosph´eriques de chaque naine blanche. Cela nous permet d’´etudier les objets individuelle-ment, mais ´egalement d’´etudier les propri´et´es globales de notre ´echantillon.
1http://www.astronomy.villanova.edu/WDCatalog/index.html 2
1.9. FORMAT DE CETTE TH `ESE 13
1.9
Format de cette th`
ese
Cette th`ese comprend un article publi´e et un article en pr´eparation pour l’Astrophysical Journal. De plus, nous incluons dans les annexes un compte rendu de conf´erence dans le-quel nous avons publi´e des r´esultats pr´eliminaires de ce projet de th`ese. Dans l’ensemble, nous pr´esentons les r´esultats de notre relev´e d’´etoiles naines blanches brillantes et riches en hydrog`ene tir´ees de McCook & Sion (1999).
Au Chapitre 2, nous pr´esentons notre analyse des naines blanches chaudes de type DA et DAO. Nous pr´esentons ´egalement les nouveaux mod`eles que nous avons calcul´es pour analyser ces ´etoiles. Ces nouveaux mod`eles sont n´ecessaires pour surmonter le probl`eme des raies de Balmer qui affecte une majorit´e des ´etoiles DAO, mais aussi plusieurs ´etoiles DA chaudes. Nous pr´esentons ensuite notre analyse spectroscopique de ces ´etoiles et nous discutons des cons´equences que ces nouvelles d´eterminations des param`etres atmosph´eriques entraˆınent sur notre compr´ehension de l’´evolution de ces naines blanches chaudes. De plus, nous exploitons des donn´ees ultraviolettes du satellite FUSE pour comprendre le m´ecanisme `a l’origine du probl`eme des raies de Balmer. Dans le Chapitre 3, nous pr´esentons les r´esultats globaux de notre relev´e de McCook & Sion (1999). Nous examinons le contenu spectroscopique de notre ´echantillon de plus de 1300 ´etoiles et nous proc´edons ensuite `a une analyse d´etaill´ee de toutes les ´etoiles naines blanches avec la derni`ere g´en´eration de mod`eles d’atmosph`ere. Ceci inclut des analyses particuli`eres pour des syst`emes binaires de type DA+DB et des naines blanches de type DAZ. Une attention particuli`ere est port´ee `a l’analyse des syst`emes binaires de type DA+dM o`u la contribution du compagnon dM est soustraite du spectre composite. Nous ´etudions ensuite les propri´et´es globales de notre ´echantillon. Tout d’abord, nous comparons nos r´esultats `a ceux d’autres analyses avec lesquelles nous avons plusieurs ´etoiles en commun. Ensuite, nous discutons de la distribution de masse et de la distribution de masse en fonction de la temp´erature effective de notre ´echantillon. Finalement, nous faisons un retour sur la d´etermination empirique de la bande d’instabilit´e des naines blanches de type ZZ Ceti. Au Chapitre 4, nous concluons avec un r´esum´e des r´esultats importants obtenus par l’entremise de ce projet de th`ese et un aper¸cu de relev´es futurs qui auront un impact important dans l’´etude des ´etoiles naines blanches.
SPECTROSCOPIC ANALYSIS OF HOT,
HYDROGEN-RICH WHITE DWARFS: THE PRESENCE
OF METALS AND THE BALMER-LINE PROBLEM
1A. Gianninas1,4, P. Bergeron1
, J. Dupuis2
and M. T. Ruiz3,4
1D´epartement de Physique, Universit´e de Montr´eal, C.P. 6128, Succ. Centre-Ville, Montr´eal, Qu´ebec H3C 3J7, Canada
2
Canadian Space Agency, 6767 Route de l’A´eroport, Longueuil, Qu´ebec J3Y 8Y9, Canada 3
Departamento de Astronom´ıa, Universidad de Chile, Casilla 36-D, Santiago, Chile 4
Visiting astronomers at Las Campanas Observatory operated by Carnegie Institution of Washington.
Received 2010 May 3; Accepted 2010 July 4
Published in the Astrophysical Journal, September 2010, Vol. 720, page 581 Reproduced by permission of the AAS
1Based on observations made with ESO Telescopes at the La Silla or Paranal Observatories under program
2.1. ABSTRACT 15
2.1
ABSTRACT
We present an analysis of optical spectra for 29 DAO white dwarfs. First, we present our new up-to-date model atmosphere grids computed without the assumption of local ther-modynamic equilibrium in which we have included carbon, nitrogen, and oxygen at solar abundances. We demonstrate that the addition of these metals in the model atmospheres is essential in overcoming the Balmer-line problem, which manifests itself as an inability to fit all the Balmer lines simultaneously with consistent atmospheric parameters. We then present the spectroscopic analysis of our sample of DAO white dwarfs for which we determine the effective temperature, surface gravity, and helium abundance. We also present 18 hot DA white dwarfs that also suffer from the Balmer-line problem. We analyze these stars with models analogous to those for the DAO white dwarfs save for the presence of helium. Systematic differences bet-ween our newly determined atmospheric parameters with respect to previous determinations are explored. Far ultraviolet spectra from the FUSE archive are then examined to demons-trate that there exists a correlation between higher metallic abundances and instances of the Balmer-line problem. The implications of these findings for all hot, hydrogen-rich white dwarfs are discussed. Specifically, the possible evolutionary scenario for DAO white dwarfs is revised and post-extreme horizontal branch evolution is no longer needed to explain the evolution for the majority of the DAO stars. Finally, we discuss how the presence of metals might drive a weak stellar wind which in turn could explain the presence of helium in DAO white dwarfs.
2.2
INTRODUCTION
One of the great achievements in white dwarf research over the last 20 years has been the ability to accurately measure the atmospheric parameters of these stars by comparing the theoretical predictions of model atmosphere calculations to observations throughout the electromagnetic spectrum. In particular, the spectroscopic technique developed by Bergeron, Saffer, & Liebert (1992) for analyzing the hydrogen-line (DA) white dwarfs has become the standard method for measuring the effective temperature and surface gravity of these stars which represent 80% of the white dwarf population.
Over the last several years, we have been conducting a spectroscopic survey based largely on the catalog of McCook & Sion (1999) and focusing on all the DA white dwarfs brighter than V = 17.5. High signal-to-noise ratio (S/N > 50) optical spectra for over 1300 white dwarfs have been secured and a preliminary analysis is presented in Gianninas, Bergeron, & Ruiz (2009). Of particular interest in this paper is that our sample includes a number of DAO white dwarfs. These are hot white dwarfs (Teff > 40,000 K) that are characterized by optical spectra that exhibit absorption lines due to helium present in the atmosphere. Specifically, most DAO white dwarfs are distinguished by the He ii λ4686 absorption feature in addition to the hydrogen Balmer lines. Since these stars clearly contain more than just hydrogen in their atmospheres, they need to be analyzed separately from the rest of our sample and require models which differ from our pure hydrogen models in order to properly measure their atmospheric parameters. We believe that this presents an opportunity to revisit in detail the DAO phenomenon and the connection with their hot DA counterparts.
Bergeron et al. (1994) presented an overview of the history and status of research on hot DA and DAO stars prior to their work. For the benefit of the reader, we provide a brief summary of that overview here. Initially, hot white dwarfs were expected to be sources of soft X-rays and extreme ultraviolet (EUV) radiation (Shipman 1976), but Einstein and EXOSAT data revealed instead that most hot DA stars had an X-ray flux deficiency (Vennes et al. 1988). It was thought that the presence of helium could explain the flux deficiency but Vennes et al. (1988) showed that radiation pressure could not support sufficient amounts of helium in the atmosphere to provide the necessary opacity. As an alternative, Vennes et al. (1988) proposed a model where a thin hydrogen layer floated in diffusive equilibrium above a more massive helium layer. These stratified models reproduced the X-ray and EUV data rather well (Koester 1989; Vennes & Fontaine 1992). Unfortunately, the survey conducted with ROSAT (Pounds et al. 1993) detected only 119 sources out of an expected 1000 − 2000 white dwarfs (Barstow 1989). Barstow et al. (1993) showed that neither homogeneous nor stratified models could explain these observations and they suggested that an additional opacity source, most likely metals, would provide a better match to the data.
2.2. INTRODUCTION 17
it gathered permitted a more detailed study of the EUV flux of hot DA white dwarfs than the previous photometric surveys could. Analyses of the EUVE spectra showed that stratified atmospheres could not reproduce the data nearly as well as models that included metals (Barstow et al. 1997; Wolff et al. 1998). More sophisticated models that included the diffusion of the various metals through the atmosphere, in a self-consistent way, were subsequently computed and these matched the EUVE data even better (Dreizler & Wolff 1999; Schuh, Dreizler & Wolff 2002). As such, the notion that the flux deficiency in hot DA stars could be explained by stratified atmospheres, composed only of hydrogen and helium, was abandoned. DAO white dwarfs, on the other hand, presented a different challenge since they clearly contained a much higher abundance of helium as evidenced by the appearance of the He ii λ4686 absorption line in their optical spectra. It was possible that at least for this subgroup of white dwarfs the stratified atmospheres proposed by Vennes et al. (1988) might yet be valid. Indeed, DAO white dwarfs were unique in that their hybrid spectra provided a diagnostic tool by which the abundance and distribution of helium in the atmosphere could be studied directly.
The prototype of the DAO class, HZ 34, was identified as such by Wesemael, Green & Liebert (1985) who presented the first spectroscopic analysis of DAO white dwarfs using homogeneous model atmospheres. Holberg (1987) significantly increased the number of known DAO stars and Holberg et al. (1989) combined optical and International Ultraviolet Explorer (IUE) observations to determine the atmospheric parameters of these stars. At the same time, Fontaine & Wesemael (1987) discussed the idea that most white dwarfs possibly descended from helium-rich PG 1159 stars. However, several studies had begun to show that several old planetary nebulae nuclei have hydrogen-rich atmospheres (Napiwotzki & Sch¨onberner 1993). DAO white dwarfs might then represent a transition between the PG 1159 stars where hydrogen is diffusing upward to eventually form a hydrogen-rich layer at the surface. If that scenario were to be true, the stratified atmospheres of Vennes et al. (1988) would be the only viable models. However, a comprehensive analysis comparing the predictions of homogeneous and stratified model atmospheres to observations had never been conducted. It is for this reason that the study of Bergeron et al. (1994) is of particular importance as they were the
first to perform a detailed analysis comparing optical and UV spectra to the predictions of both homogeneous and stratified atmospheres. Although their analysis of the UV spectra ultimately proved inconclusive, the He ii λ4686 line profiles clearly pointed to homogeneous models as the stratified atmospheres produced line cores that were too shallow. Indeed all of the DAO white dwarfs in their sample were best reproduced with the homogeneous models, with the exception of PG 1305−017. As a consequence of this result, all subsequent analyses of DAO stars have employed homogeneous model atmospheres.
In addition to DAO white dwarfs, Bergeron et al. (1994) also looked at a number of hot DA stars. In particular, they explored the effects that trace amounts of helium (number ratios in the range He/H = 10−5
to 10−4
) would have on the atmospheric parameter determinations. They found significant differences between the pure hydrogen models and those including helium. However, it was later shown by Napiwotzki (1997) that this was due to the fact that Bergeron et al. (1994) computed models assuming local thermodynamic equilibrium (LTE) since the effects due to the presence of helium vanish when models are computed assuming non-LTE (NLTE) conditions. It should also be noted that the stratified models were also computed in LTE, and NLTE versions of those models, and the subsequent helium line profiles associated with them, have never been explored.
Another important result from that study was the realization that most of the DAO stars in their sample were afflicted with the so-called Balmer-line problem. This problem manifests itself as an inability to simultaneously fit all the Balmer lines with consistent values of Teff and log g, and it was first observed by Napiwotzki (1992, 1993) in his analysis of central stars of planetary nebulae (hereafter, CSPNe). More specifically, the line profiles of Hβ, and to a lesser extent Hγ, are predicted too shallow and thus require a lower temperature to correctly fit the observations. It should be noted that the Balmer-line problem was not observed in any of the hot DA stars analyzed by Bergeron et al. (1994). This would suggest that the mechanism responsible for the Balmer-line problem was operating only in DAO stars. Consequently, several solutions to this problem were explored. Bergeron et al. (1993) included blanketing due to iron in their model atmospheres in an effort to fit the line profiles of Feige 55. Although they were successful, they used an iron abundance of log Fe/H = −3.0 which is unrealistically
2.2. INTRODUCTION 19
high (15 times solar) and their models were computed assuming LTE conditions. Furthermore, Napiwotzki & Rauch (1994) reviewed several failed explanations to the Balmer-line problem such as magnetic fields, wind effects, and pressure ionization. They also explored another possibility by looking at ion-dynamical effects on the Stark broadening of hydrogen lines, but this also proved unsuccessful.
A solution to the Balmer-line problem was eventually achieved and presented by Werner (1996). His solution was to include carbon, nitrogen, and oxygen (hereafter, CNO) at solar abundances in the calculation of the model atmosphere. Although such calculations had al-ready been performed in the past (Werner & Heber 1991; Werner & Dreizler 1993), Werner (1996) showed that the decisive ingredient was the necessity to include the proper Stark broa-dening of the metallic lines. The net effect was a cooling of the upper layers of the atmosphere where the core of the Balmer lines is formed. In this temperature regime, cooler temperatures translate to deeper line cores. As such, these new models were in very good agreement with the observed line profiles.
Other important studies of hot DAO white dwarfs since then have come from Napiwotzki (1999) who analyzed a large sample of CSPN, 15 of which turned out to be DAO white dwarfs. Interestingly, Napiwotzki (1999) did not implement the solution to the Balmer-line problem outlined by Werner (1996). Instead, he relied on the fits of the higher Balmer lines, namely Hδ and Hǫ, which are formed deeper in the atmosphere where the thermodynamic structure is not affected by the presence of CNO. The reasons for omitting the solution are twofold. First, Napiwotzki (1999) argued that CNO abundances would need to be known for each star and that the computational time required to include CNO in NLTE models was too great.
More recently, far-ultraviolet (FUV) spectra of DAO white dwarfs obtained with the Far-Ultraviolet Spectroscopic Explorer (FUSE) were analyzed in a series of papers by Good et al. First, Good et al. (2004) wanted to verify if consistent temperatures can be obtained by independently fitting the Balmer lines in the optical spectrum and the Lyman lines in the FUV spectrum. Instead, they observed a similar trend to the one highlighted by Barstow et al. (2003) with the Lyman lines systematically yielding higher temperatures as compared to those derived from the Balmer lines. It should be noted that the NLTE model atmospheres
used by Good et al. (2004) in their analysis did include CNO as prescribed by Werner (1996). Second, Good et al. (2005a) exploited the time-resolved nature of FUSE data to check for binarity among DAO white dwarfs. They did not detect evidence for any new binaries but their technique did detect radial velocity variability for all the known binaries in their sample. Finally, Good et al. (2005b) obtained abundance measurements for the various metals whose absorption lines abound in the FUV of these DAO white dwarfs. However, due to the difficul-ties of computing a full grid of models to measure, in an absolute manner, the abundances of all the observed species (C, N, O, Si, Fe, and Ni), the abundance determinations are measured relative to the measured abundances in G191-B2B (Barstow et al. 2001b).
Finally, one of the biggest developments in recent times in the white dwarf community has been the wealth of observational data produced by the Sloan Digital Sky Survey (SDSS). Having now surpassed the 10,000 mark in terms of newly discovered white dwarf stars, it should come as no surprise that new DAO white dwarfs are among them. H¨ugelmeyer et al. (2007) present an analysis for 16 new DAO white dwarfs discovered in the SDSS up to and including Data Release 4 (Eisenstein et al. 2006). Unfortunately, as is often the case, many of the spectra lack the S/N necessary in order to accurately measure their atmospheric parame-ters (Gianninas et al. 2005, see also Section 2.3). Furthermore, H¨ugelmeyer et al. (2007) use H/He model atmospheres that do not include CNO to deal with the Balmer-line problem. In addition, they do not restrict their analysis to the higher Balmer lines like Napiwotzki (1999) did, instead they include both Hβ and Hγ in their fits thus increasing the uncertainty of their measured atmospheric parameters.
We believe that the time is right to take a fresh look at the DAO phenomenon using high S/N spectra coupled with model atmospheres that take into account all that we have learned about these stars over the past 15 years. In addition, and similarly to Bergeron et al. (1994), we also include an analysis of hot DA white dwarfs found in the same range of effective tem-perature as the DAO stars. Indeed, we will see that several distinct groups of objects emerge from this analysis and that DAO and hot DA stars have more in common than we might have been led to believe in the past. We present in Section 2.3 our spectroscopic observations and in Section 2.4 we describe the various grids of model atmospheres and synthetic spectra that
2.3. SPECTROSCOPIC OBSERVATIONS 21
we computed for our analysis. The results from our analysis of optical spectra are presented in Section 2.5. In Section 2.6, we examine the FUSE data for our ensemble of white dwarfs. In Section 2.7 we discuss the implications of our findings and finally, we make some concluding remarks in Section 2.8.
2.3
SPECTROSCOPIC OBSERVATIONS
Our optical data are taken from the ongoing spectroscopic survey of DA white dwarfs out-lined in Gianninas et al. (2009). Since we are interested in the temperature range where DAO stars are found, we restrict ourselves to stars with Teff > 40,000 K. This translates to a total of 152 white dwarfs of which 29 are DAO white dwarfs. However, the spectrum we obtained for 0625−253 was completely dominated by the emission lines of the associated planetary nebula (A15) and so we were forced to drop this object from our sample. The spectra of the 29 DAO white dwarfs come from several sources. First of all, there are 12 stars for which the spectra are identical to those used by Bergeron et al. (1994) in their analysis. Of the remaining 17 spectra, 13 have been obtained as part of our ongoing spectroscopic survey (Gianninas et al. 2009). This includes new spectra of Feige 55 (1202+608) and PG 1210+533, both of which are white dwarfs analyzed in Bergeron et al. (1994). With the exception of five spectra (Feige 55, 0458−303, 0950+139, 1136+667, and 1958−501), all of our data were obtained at Steward Observatory’s 2.3 m telescope equipped with the Boller & Chivens spectrograph. The 4.′′
5 slit together with the 600 line mm−1
grating blazed at 3568 ˚A in first order provides a spectral coverage from about 3000–5250 ˚A at a resolution of ∼ 6 ˚A (FWHM). The spectrum of Feige 55 was obtained at the 1.6 m telescope of the Observatoire du Mont-M´egantic where the 600 line mm−1
grating provided a spectral coverage from about 3100-7500 ˚A at a similar resolution. 0458−303 was observed at ESO’s 3.6 m telescope at La Silla, Chile with the ESO Faint Object Spectrograph and Camera (v.2) (EFOSC2). The no. 7 grism and a 1.′′
0 slit provided a spectral coverage from about 3300–5200 ˚A with a resolution of ∼ 6 ˚A (FWHM). The spectrum of 0950+139 was obtained using the Mt. Hopkins 6.5 m MMT telescope using the Blue Channel of the MMT Spectrograph. The 500 lines mm−1
grating and a 1.′′
0 slit provided a spectral coverage from about 3400–6300 ˚A with a resolution of ∼ 4 ˚A (FWHM). 1136+667 is in a
binary system with a K dwarf and the spectrum we obtained was heavily contaminated with emission lines to the point where our spectroscopic analysis technique was rendered useless. Luckily, this object had been previously studied by Sing et al. (2004). In their work, they obtained a spectrum at inferior conjunction (see their Figure 9) which is almost devoid of contamination and which they kindly provided to us. Finally, the spectrum of 1958−501 was obtained at Carnegie Observatories’ 2.5 m Ir´en´ee du Pont Telescope at Las Campanas, Chile with the Boller & Chivens spectrograph. The 1.′′
5 slit with the 600 line mm−1
grating blazed at 5000 ˚A provided a spectral coverage from about 3500–6600 ˚A at a slightly better resolution of ∼ 3 ˚A (FWHM).
Of these 29 white dwarfs, 26 have already been identified as being of the DAO spectral type. The remaining three (0458−303, 1201−049, and 1958−501) are identified as members of the DAO class for the first time in this paper. Finally, we wish to address the case of 2218+706. This star was classified as a DAO white dwarf by Barstow et al. (2003) based on their detection of a “trace” of He ii λ1640 in the ultraviolet (Barstow et al. 2001a). This detection is not an especially strong indicator as He ii λ1640 has only rarely been detected in DAO white dwarfs (Holberg et al. 1989; Bergeron et al. 1994). More importantly, white dwarfs are classified based on features observed in their optical spectra. In that respect, we concur with Barstow et al. (2003) as we detect no sign of He ii λ4686 in our optical spectrum. However, if we consider the abundance of He/H = 3 × 10⁻⁵
determined by Barstow et al. (2001a), it would be impossible to detect any trace of He ii λ4686 with our medium resolution spectrum. Therefore, for the purposes of our analysis, we will consider 2218+706 as a simple DA white dwarf.
The 29 spectra of our DAO white dwarfs are displayed in Figure 2.1. First of all, we note that all the spectra have a relatively high signal-to-noise ratio with a minimum of S/N ∼ 50. Second, we see that all the spectra show, besides the hydrogen Balmer lines from Hβ to Hǫ, the He ii λ4686 line signaling the presence of helium in the atmosphere (the weakness of the helium line observed in 1201−049 is further discussed in Section 2.7.1; see also Figure 2.21). However, this is not the only feature of note in the spectra of these DAO white dwarfs. Several spectra (0950+139 and 2011+398) also contain emission lines. In the case of 0950+139, these
2.3. SPECTROSCOPIC OBSERVATIONS 23
Figure2.1 – Optical spectra for the 29 DAO stars in our sample in order of increasing right ascension from top left to bottom right. The spectra have been normalized to a continuum set to unity and vertically shifted for clarity. The tick mark at the top of each panel indicates the location of the He ii λ4686 absorption line.
are due to the contribution of a planetary nebula still present around the star. On the other hand, the emission lines in 2011+398 are the result of this star being in a binary system with an M dwarf (Barstow et al. 1995). The contamination due to the emission lines varies from one spectrum to another and will complicate our analysis, especially in cases where there is emission in the core of the Balmer lines. In the case of 1957+225, emission lines
Figure2.2 – Distribution of S/N for our sample of 29 DAO white dwarfs (dashed histogram) and the 16 SDSS DAO white dwarfs from H¨ugelmeyer et al. (2007) (solid line histogram).
from the accompanying planetary nebula were slightly over-subtracted during the removal of the background during data reduction and now appear as two deep and narrow absorption lines redward of Hβ. Furthermore, four of these stars (0505+012, 1201−049, 1822+008, and 2115+118) are actually of spectral type DAOZ due to the presence of metallic absorption lines in their spectra. Specifically, it is the C iv λ4658 line which is observed just blueward of He ii λ4686 in all of these stars. 0505+012 was originally identified by Heber, Dreizler, & Hagen (1996) whereas we classify 1201−049 as DAOZ for the first time in this work. 1822+008 was classified as both a DAOZ white dwarf and a PG 1159 star by Napiwotzki & Sch¨onberner (1995). In the subsequent analyses of Dreizler et al. (1995b) and Napiwotzki (1999), the DAOZ classification was dropped altogether and 1822+008 was considered as a hybrid PG 1159 star due to the presence of strong Balmer lines. However, as we will see below, the atmospheric parameters we obtain for this star place it squarely in the realm of the DAO stars. Specifically, we obtain a lower Teff and a higher log g value than Napiwotzki (1999, see his Table 1). As such, we believe that the initial classification of DAOZ is the correct one. Finally, Dreizler
2.4. MODEL ATMOSPHERES AND SYNTHETIC SPECTRA 25
et al. (1995a) were the first to identify 2115+118 as being of the DAOZ spectral type. Indeed, in their spectrum of 2115+118 (see their Figure 1), they identify absorption lines due to highly ionized C, N, O, and even Ne.
Finally, we show in Figure 2.2 a comparison of the S/N of our sample of DAO stars with the SDSS DAO stars analyzed by H¨ugelmeyer et al. (2007). We see that all of the DAO white dwarfs from our sample have S/N greater than 50 whereas the peak of the SDSS distribution is near 20. We see once again the great weakness of the SDSS whose spectra have S/N too low to precisely measure the atmospheric parameters of these stars (Gianninas et al. 2005).
2.4
MODEL ATMOSPHERES AND SYNTHETIC SPECTRA
For the analysis of our sample of DAO white dwarfs, we have computed several new grids of model atmospheres and synthetic spectra that take into account advances (since Bergeron et al. 1994) in our knowledge and understanding of DAO white dwarfs as well as the physics and composition of their stellar atmospheres. In particular, we have computed separate grids assuming both LTE and NLTE as well as models containing CNO in order to study their effects on the thermodynamic structure of the atmosphere and how those changes translate to the theoretical Balmer-line profiles. Our models and synthetic spectra were all computed using the TLUSTY atmosphere code and the accompanying spectrum synthesis code SYNSPEC, both developed by Hubeny & Lanz (1995). All the model atmospheres are homogeneous in terms of their chemical composition (cf. Section 2.2).
As for the emergent spectra, we use the improved Stark profiles developed by Tremblay & Bergeron (2009) for our hydrogen line profiles, instead of the tables of Lemke (1997) and the calculations of Sch¨oning & Butler (1989) for the profiles of He ii λ1640 and λ4686. The implications of the improved hydrogen line profiles from Tremblay & Bergeron (2009) on our derived atmospheric parameters will be qualitatively discussed in Section 2.5.4. The atmos-pheric parameters cover a range of Teff = 40,000 (5000) 90,000 K and Teff = 90,000 (10,000) 150,000 K (where the quantity in parentheses indicates the step size), log g = 6.5 (0.5) 8.5 and log He/H = −5.0 (1.0) 0.0.
is the computation of models in NLTE. The combination of modern computing power and the TLUSTY code makes it possible to compute NLTE models rather easily and within a reasonable time frame, a much more difficult task in the past. In particular, it is clear that NLTE effects are important in white dwarfs in this temperature range (Napiwotzki, Green, & Saffer 1999). DAO white dwarfs are particularly susceptible since they are all hot and generally have lower surface gravities than normal DA stars, which favors departures from LTE conditions. Bergeron et al. (1994) had demonstrated that traces of helium in hot DA stars had an effect on the Balmer-line profiles, and consequently on the atmospheric parameters measured for those stars. However, the models in Bergeron et al. (1994) were all computed assuming LTE conditions. Napiwotzki (1997) showed that when these same models are computed assuming NLTE, the presence of helium has no effect on the Balmer-line profiles. They concluded that for an LTE analysis of the Balmer lines, pure hydrogen models should be used even if traces of helium are present in the atmosphere. Consequently, for an analysis of the Balmer lines in DAO white dwarfs which, by definition, contain helium in the atmosphere, it is imperative to compute models in NLTE.
As a first test of our new models, we show in Figure 2.3 a comparison between line profiles computed in LTE and NLTE, and with varying traces of helium for a model atmosphere at Teff = 65,000 K, log g = 7.5. We see that in the LTE case the presence of helium affects the line cores producing shallower lines as the helium abundance increases. In contrast, the line profiles computed in NLTE are identical regardless of the helium abundance and thus we are in perfect agreement with the results of Napiwotzki (1997). This result further reinforces the need to calculate NLTE atmospheres in order to properly model white dwarfs in this temperature regime, the more so that our technique for determining the atmospheric parameters for these stars rests on our ability to reproduce the Balmer-line profiles in detail.
The second, and possibly more important difference with the previous generation of mo-dels, is the addition of CNO at solar abundances (as listed in Asplund et al. 2005) as the solution to the Balmer-line problem. Werner (1996) showed that the inclusion of these metals with the proper Stark broadening effectively solves the Balmer-line problem by cooling the upper layers of the atmosphere where the core of the lower Balmer lines are formed, most