2009
Ageing Report
Economic and budgetary projections for the EU-27
Member States (2008-2060) | Statistical Annex
EUROPEAN ECONOMY 2|2009
(provisional version)
The European Economy series contains important reports and communications from the Commission to the
Council and the Parliament on the economic situation and developments, such as the Economic forecasts,
the annual EU economy review and the Public finances in EMU report.
Subscription terms are shown on the back cover and details on how to obtain the list of sales agents are
shown on the inside back cover.
Unless otherwise indicated the texts are published under the responsibility of the Directorate-General for
Economic and Financial Affairs of the European Commission, BU-24, B-1049 Brussels, to which enquiries
other than those related to sales and subscriptions should be addressed.
Legal notice
Neither the European Commission nor any person acting on its behalf may be held
responsible for the use which may be made of the information contained in this
publication, or for any errors which, despite careful preparation and checking, may
appear.
More information on the European Union is available on the Internet (http://europa.eu).
KC-AR-09-002-EN-C
ISBN 978-92-79-11363-5
ISSN 0379-0991
DOI 10.2765/80301
© European Communities, 2009
2009 Ageing Report:
economic and budgetary projections for the EU-27
Member States (2008-2060)
CONTENTS
Statistical Annex – Cross-country tables ... 3
List of tables... 4
Main demographic and macroeconomic assumptions... 8
Pension expenditure projections ... 34
Health-care expenditure projections ... 51
Long-term care expenditure projections ... 55
Education expenditure projections... 60
Unemployment benefit expenditure projections ... 69
Additional informations... 70
List of tables
Table A 1 - Fertility rate (births per woman)... 8
Table A 2 – Life expectancy at birth - Males (years)... 8
Table A 3 - Life expectancy at birth - Females (years)
... 9
Table A 4 - Life expectancy at 65 - Males (years)... 9
Table A 5 - Life expectancy at 65 - Females (years)
... 10
Table A 6 – Net migration (thousands people)
... 10
Table A 7 – Net migration (as % of population)... 11
Table A 8 - Population (millions people)
... 11
Table A 9 – Children population (0-14) (as % of total population)
... 12
Table A 10 – Prime age population (25-54) (as % of total population)
... 12
Table A 11 – Working age population (15-64) (as % of total population)... 13
Table A 12 – Elderly population (65 and over) (as % of total population)
... 13
Table A 13 – Very elderly population (80 and over) (as % of total population)
... 14
Table A 14 - Very elderly population (80 and over) (as % of elderly population)... 14
Table A 15 - Very elderly population (80 and over) (as % of working-age population)... 15
Table A 16 – Potential GDP (annual growth rate)... 15
Table A 17 - Employment (annual growth rate)
... 16
Table A 18 – Labour input – hours worked (annual growth rate)
... 16
Table A 19 – Labour productivity per hour (annual growth rate)
... 17
Table A 20 - TFP (annual growth rate)... 17
Table A 21 – Capital deepening (contribution to labour productivity growth)
... 18
Table A 22 – GDP per capita (annual growth rate)
... 18
Table A 23 – GDP per worker (annual growth rate)... 19
Table A 24 – GDP in 2007 prices (millions EUR)
... 19
Table A 25 – Working-age population (15-64) (thousands people)... 20
Table A 26 - Working-age population (15-64) (annual growth rate)
... 20
Table A 27 – Labour force 15-64 (thousands people)
... 21
Table A 28 – Participation rate (15-64) (percent)... 21
Table A 29 - Participation rate (15-24) (percent)... 22
Table A 30 - Participation rate (25-54) (percent)... 22
Table A 31 - Participation rate (55-64) (percent)... 23
Table A 32 - Participation rate (15-64) - FEMALES (percent)
... 23
Table A 33 - Participation rate (15-24) - FEMALES (percent)
... 24
Table A 34 - Participation rate (25-54) - FEMALES (percent)
... 24
Table A 35 - Participation rate (55-64) - FEMALES (percent)
... 25
Table A 36 - Participation rate (15-64) - MALES (percent)
... 25
Table A 37 - Participation rate (15-24) - MALES (percent)
... 26
Table A 38 - Participation rate (25-54) - MALES (percent)
... 26
Table A 39 - Participation rate (55-64) - MALES (percent)
... 27
Table A 40 - Employment rate (15-64) (percent)
... 27
Table A 41 - Employment rate (20-64) (percent)
... 28
Table A 42 - Employment rate (15-71) (percent)
... 28
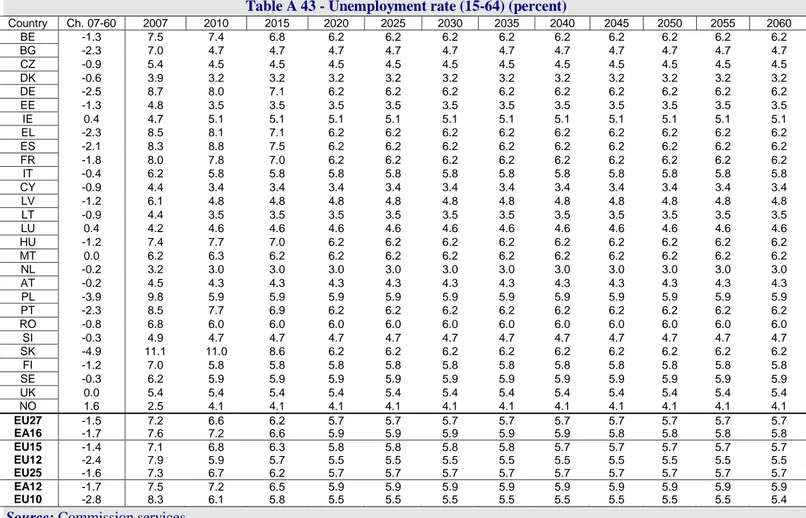
Table A 43 - Unemployment rate (15-64) (percent)
... 29
Table A 44 – Employment 15-64 (millions people)
... 29
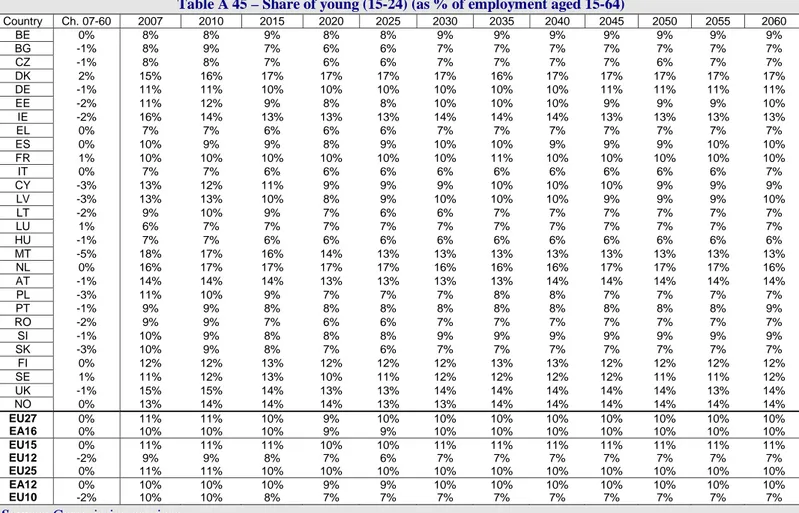
Table A 45 – Share of young (15-24) (as % of employment aged 15-64)... 30
Table A 46 – Share of prime age (25-54) (as % of employment aged 15-64)... 30
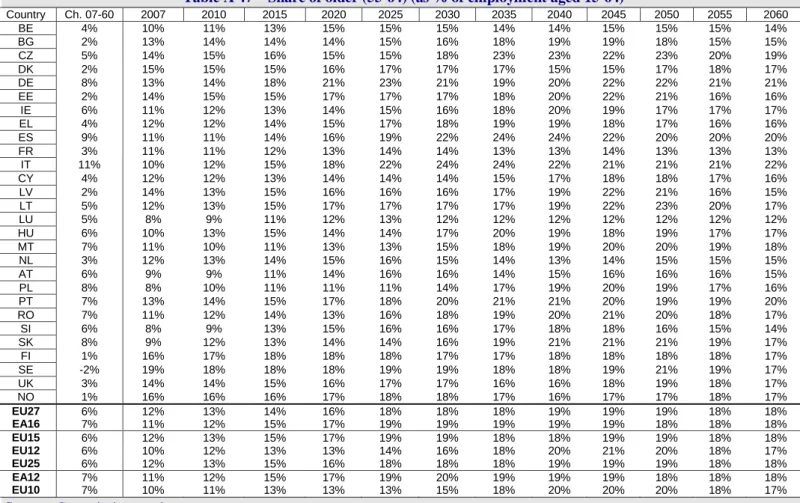
Table A 47 – Share of older (55-64) (as % of employment aged 15-64)
... 31
Table A 48 – Share of older population (55-64) (population 55 to 64 as % of total population 15-64)
... 31
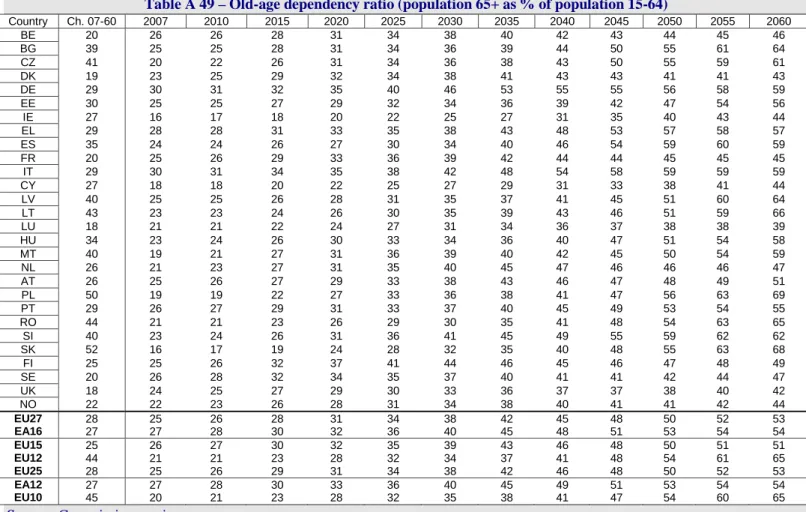
Table A 49 – Old-age dependency ratio (population 65+ as % of population 15-64)
... 32
Table A 51 – Total economic dependency ratio (total population-employment as % of employed 15-64)... 33
Table A 52 – Economic old-age dependency ratio (15-64) (inactive population 65+ as % of employed 15-64)
... 33
Table A 53 – Social security pensions, gross (as % of GDP)
... 34
Table A 54 – Old-age and early pensions, gross (as % of GDP)
... 34
Table A 55 – Earnings-related pensions, gross (as % of GDP)... 35
Table A 56 – Other pensions (disability, survivors), gross (as % of GDP)... 35
Table A 57 – Occupational pensions, gross (as % of GDP)... 36
Table A 58 – Private mandatory pensions, gross (as % of GDP)... 36
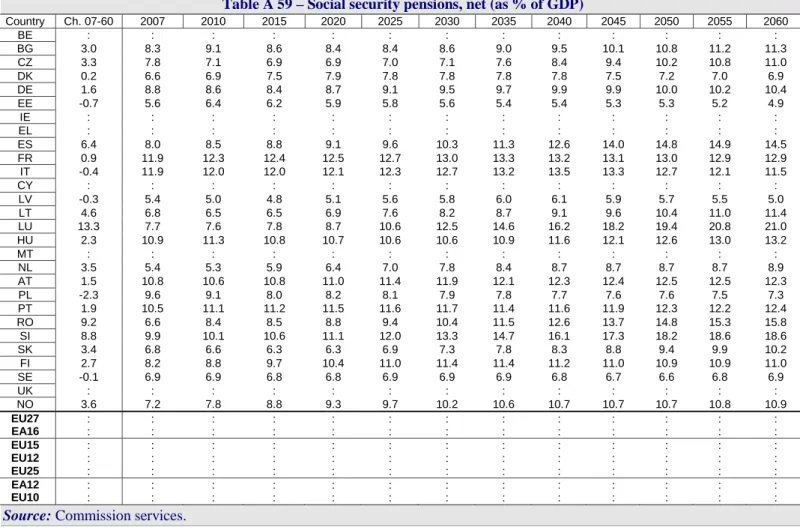
Table A 59 – Social security pensions, net (as % of GDP)... 37
Table A 60 – Social security pensions, contributions (as % of GDP)
... 37
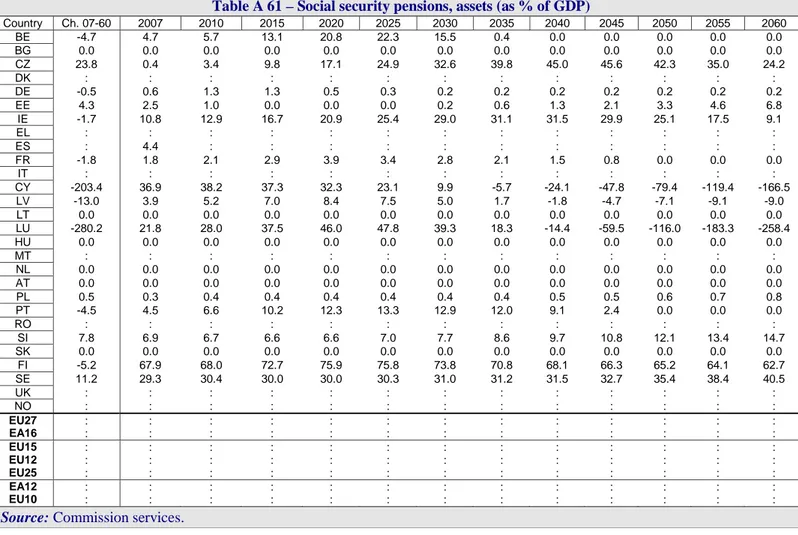
Table A 61 – Social security pensions, assets (as % of GDP)
... 38
Table A 62 – Social security pensions, net/social security pensions, gross (percent)
... 38
Table A 63 – Pensioners (social security) (thousands people)... 39
Table A 64 – Pensioners aged 65+ (thousands people)... 39
Table A 65 – Share of pensioners below age 65 as % of all pensioners (percent)
... 40
Table A 66 – Avg gross pension, (social security in 2007 prices) (thousands EUR)
... 40
Table A 67 – Benefit ratio (Social security pensions) (percent)
... 41
Table A 68 – Gross replacement rate at retirement (social security pensions) (percent)... 41
Table A 69 – Contributors (social security pensions, in 1000 persons) (thousands people)
... 42
Table A 70 – Support ratio (contributors/100 pensioners, social security pensions) (percent)
... 42
Table A 71 – Social security pensions, gross (as % of GDP) – Higher life expectancy scenario... 43
Table A 72 – Old-age and early pensions, gross (as % of GDP) – Higher life expectancy scenario... 43
Table A 73 - Social security pensions, gross (as % of GDP) – Higher labour productivity scenario
... 44
Table A 74 - Old-age and early pensions, gross (as % of GDP) – Higher labour productivity scenario
... 44
Table A 75 - Social security pensions, gross (as % of GDP) – Zero migration scenario
... 45
Table A 76 - Old-age and early pensions, gross (as % of GDP) – Zero migration scenario... 45
Table A 77 - Social security pensions, gross (as % of GDP) – Higher employment rate (+1p.p.) scenario
... 46
Table A 78 - Old-age and early pensions, gross (as % of GDP) – Higher employment rate (+1p.p.) scenario
. 46
Table A 79 - Social security pensions, gross (as % of GDP) – Higher older workers employment rate (+5p.p.)
scenario
... 47
Table A 80 - Old-age and early pensions, gross (as % of GDP) – Higher older workers employment rate
(+5p.p.) scenario... 47
Table A 81 – Social security pensions, gross as % of GDP (percentage points change from 2007) - Baseline. 48
Table A 82 – Social security pensions, gross as % of GDP (p.p. ch from 2007 due to Dependency ratio) -
Baseline... 48
Table A 83 - Social security pensions, gross as % of GDP (p.p. ch from 2007 due to Coverage ratio) - Baseline
... 49
Table A 84 - Social security pensions, gross as % of GDP (p.p. ch from 2007 due to Employment effect) -
Baseline... 49
Table A 85 - Social security pensions, gross as % of GDP (p.p. ch from 2007 due to Benefit ratio) - Baseline50
Table A 86 - Social security pensions, gross as % of GDP (p.p. ch from 2007 due to Interaction effect) -
Baseline... 50
Table A 87 – Health care spending – AWG reference scenario (as % of GDP)... 51
Table A 88 - Health care spending – Pure ageing scenario (as % of GDP)
... 51
Table A 89 - Health care spending – Labour intensity scenario (as % of GDP)
... 52
Table A 90 - Health care spending – Constant health scenario (as % of GDP)... 52
Table A 91 - Health care spending – Fast cost growth scenario (as % of GDP)
... 53
Table A 92 - Health care spending – Cost convergence scenario (as % of GDP)
... 53
Table A 93 - Health care spending – Death-related cost scenario (as % of GDP)
... 54
Table A 94 - Health care spending – Income elasticity scenario (as % of GDP)
... 54
Table A 95 – Long-term care spending – AWG reference scenario (as % of GDP)
... 55
Table A 97 - Long-term care spending – GDP per capita scenario (as % of GDP)... 56
Table A 98 - Long-term care spending – Constant disability scenario (as % of GDP)
... 56
Table A 99 - Long-term care spending – GDP per worker fast growth scenario (as % of GDP)
... 57
Table A 100 - Long-term care spending – Shift 1% dependents from informal to home care scenario (as % of
GDP)
... 57
Table A 101 - Long-term care spending - Shift 1% dependents from informal to instit. care scenario (as % of
GDP)
... 58
Table A 102 - Long-term care spending - Shift 1% dependents from informal to home/instit. care scenario (as
% of GDP)... 58
Table A 103 – Number of dependents people – AWG reference scenario (thousands people)
... 59
Table A 104 – Number of dependents people receiving formal care – AWG reference scenario (thousands
people)
... 59
Table A 105 - Number of dependents people receiving informal or no care – AWG reference scenario
(thousands people)... 60
Table A 106 – Education spending - Total (as % of GDP)
... 60
Table A 107 - Education spending - Primary (as % of GDP)
... 61
Table A 108 - Education spending – Low secondary (as % of GDP)
... 61
Table A 109 - Education spending – Upper secondary (as % of GDP)... 62
Table A 110 - Education spending – Tertiary education (as % of GDP)
... 62
Table A 111 – Number of students – Total (thousands people)... 63
Table A 112 - Number of students – Primary (thousands people)
... 63
Table A 113 - Number of students – Low secondary (thousands people)... 64
Table A 114 - Number of students – Upper secondary (thousands people)
... 64
Table A 115 - Number of students – Tertiary education (thousands people)
... 65
Table A 116 – Number of teachers - Total (thousands people)... 65
Table A 117 - Number of teachers - Primary (thousands people)... 66
Table A 118 - Number of teachers – Low secondary (thousands people)... 66
Table A 119 - Number of teachers – Upper secondary (thousands people)
... 67
Table A 120 - Number of teachers – Tertiary education (thousands people)
... 67
Table A 121 – Education spending – High compens. per teacher scenario (diff Baseline) (as % of GDP)... 68
Table A 122 - High ratio teachers/students scenario (diff Baseline) (as % of GDP)... 68
Table A 123 – Higher attainment rates in tertiary education scenario (45% by 2020) (diff Baseline) (as % of
GDP)
... 69
Table A 124 – Unemployment benefit spending (as % of GDP)
... 69
Table A 125 – Estimated impact of pension reform on participation rates (2020, 2060) in percentage points
(comparison of projections with and without incorporating recent pension reforms)
... 70
Table A 126 –Projected changes in participation rates by age-groups, 2007-2060... 71
Table A 127 – Labour supply projections, 2007-2060 (age group : 15 to 64)... 73
Table A 128 – Contribution to the overall change in participation rates, 2007-2060 (changes in %)
... 74
Table A 129 – Contribution to the overall change in labour force, 2007-2060 (changes in %)
... 75
Table A 130 – Employment rate projections 2007-2060 (15-64)... 76
Table A 131 – Employment projections 2007-2060 (15-64)
... 76
Table A 132 – Employment rate projections by age and sex, 2007-2060
... 77
Table A 133 – Decomposition of GDP growth, 2007-2060... 79
Table A 134 – The cost of ageing overview – Baseline scenario (as % of GDP)
... 80
Table A 135 - The cost of ageing overview – High life expectancy (1 year) scenario – Difference with Baseline
(as % of GDP)
... 81
Table A 136 - The cost of ageing overview – Zero migration scenario – Difference with Baseline (as % of
GDP)
... 82
Table A 137 - The cost of ageing overview – Higher employment rate (+1p.p.) scenario – Difference with
Baseline (as % of GDP)... 83
Table A 138 - The cost of ageing overview – Higher employment rate (+5p.p.) for older workers scenario –
Difference with Baseline (as % of GDP)... 84
Table A 139 - The cost of ageing overview – Higher labour productivity (+0.25p.p.) scenario – Difference
with Baseline (as % of GDP)... 85
Main demographic and macroeconomic assumptions
Table A 1 - Fertility rate (births per woman)
Country Ch. 08-60 2008 2010 2015 2020 2025 2030 2035 2040 2045 2050 2055 2060 BE 0.04 1.75 1.76 1.76 1.76 1.77 1.77 1.77 1.78 1.78 1.78 1.79 1.79 BG 0.17 1.38 1.39 1.41 1.42 1.44 1.46 1.47 1.49 1.51 1.52 1.54 1.55 CZ 0.19 1.33 1.34 1.36 1.38 1.40 1.41 1.43 1.45 1.47 1.49 1.51 1.52 DK 0.00 1.85 1.85 1.85 1.85 1.85 1.85 1.85 1.85 1.85 1.85 1.85 1.85 DE 0.19 1.34 1.35 1.36 1.38 1.40 1.42 1.44 1.45 1.47 1.49 1.51 1.53 EE 0.11 1.55 1.55 1.56 1.57 1.59 1.60 1.61 1.62 1.63 1.64 1.65 1.66 IE -0.02 1.90 1.90 1.90 1.90 1.89 1.89 1.89 1.89 1.89 1.88 1.88 1.88 EL 0.16 1.41 1.41 1.43 1.45 1.46 1.48 1.49 1.51 1.52 1.54 1.55 1.57 ES 0.17 1.39 1.39 1.41 1.43 1.44 1.46 1.47 1.49 1.51 1.52 1.54 1.56 FR -0.05 1.98 1.98 1.98 1.97 1.97 1.96 1.96 1.95 1.95 1.94 1.94 1.93 IT 0.17 1.38 1.39 1.41 1.42 1.44 1.46 1.47 1.49 1.51 1.52 1.54 1.55 CY 0.14 1.45 1.46 1.47 1.49 1.50 1.52 1.53 1.54 1.56 1.57 1.59 1.60 LV 0.18 1.36 1.36 1.38 1.40 1.41 1.43 1.45 1.47 1.48 1.50 1.52 1.54 LT 0.20 1.35 1.35 1.37 1.39 1.41 1.43 1.45 1.47 1.49 1.51 1.52 1.54 LU 0.07 1.65 1.65 1.66 1.67 1.67 1.68 1.69 1.70 1.70 1.71 1.72 1.72 HU 0.18 1.35 1.35 1.37 1.39 1.41 1.42 1.44 1.46 1.48 1.50 1.51 1.53 MT 0.17 1.38 1.39 1.41 1.42 1.44 1.46 1.47 1.49 1.50 1.52 1.54 1.55 NL 0.05 1.72 1.72 1.73 1.73 1.74 1.74 1.75 1.75 1.75 1.76 1.76 1.77 AT 0.16 1.41 1.42 1.43 1.45 1.46 1.48 1.49 1.51 1.53 1.54 1.56 1.57 PL 0.21 1.27 1.28 1.30 1.32 1.34 1.36 1.38 1.40 1.42 1.44 1.47 1.49 PT 0.18 1.36 1.37 1.39 1.40 1.42 1.44 1.45 1.47 1.49 1.51 1.52 1.54 RO 0.19 1.32 1.33 1.35 1.37 1.39 1.41 1.42 1.44 1.46 1.48 1.50 1.52 SI 0.19 1.32 1.33 1.35 1.37 1.39 1.40 1.42 1.44 1.46 1.48 1.50 1.52 SK 0.22 1.25 1.26 1.28 1.30 1.32 1.34 1.36 1.38 1.40 1.43 1.45 1.47 FI 0.00 1.84 1.84 1.84 1.84 1.84 1.84 1.84 1.84 1.84 1.84 1.84 1.84 SE 0.00 1.85 1.85 1.85 1.85 1.85 1.85 1.85 1.85 1.85 1.85 1.85 1.85 UK 0.00 1.84 1.84 1.84 1.84 1.84 1.84 1.84 1.84 1.84 1.84 1.84 1.84 NO -0.02 1.90 1.90 1.90 1.90 1.90 1.89 1.89 1.89 1.89 1.89 1.89 1.88 EU27 0.12 1.52 1.52 1.53 1.55 1.56 1.57 1.58 1.59 1.61 1.62 1.63 1.64 EA16 0.12 1.53 1.54 1.55 1.56 1.57 1.58 1.59 1.61 1.62 1.63 1.64 1.65 EU15 0.08 1.64 1.65 1.66 1.66 1.67 1.68 1.68 1.69 1.70 1.71 1.71 1.72 EU12 0.18 1.36 1.37 1.38 1.40 1.42 1.44 1.45 1.47 1.49 1.51 1.52 1.54 EU25 0.12 1.53 1.54 1.55 1.56 1.57 1.58 1.59 1.60 1.61 1.63 1.64 1.65 EA12 0.09 1.59 1.60 1.61 1.62 1.63 1.63 1.64 1.65 1.66 1.67 1.68 1.69 EU10 0.18 1.36 1.37 1.39 1.40 1.42 1.44 1.46 1.47 1.49 1.51 1.52 1.54
Source: Commission services.
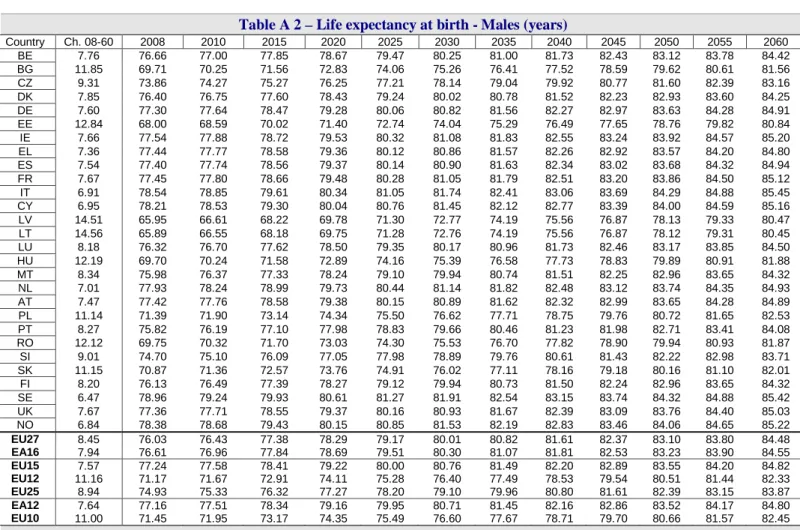
Table A 2 – Life expectancy at birth - Males (years)
Country Ch. 08-60 2008 2010 2015 2020 2025 2030 2035 2040 2045 2050 2055 2060 BE 7.76 76.66 77.00 77.85 78.67 79.47 80.25 81.00 81.73 82.43 83.12 83.78 84.42 BG 11.85 69.71 70.25 71.56 72.83 74.06 75.26 76.41 77.52 78.59 79.62 80.61 81.56 CZ 9.31 73.86 74.27 75.27 76.25 77.21 78.14 79.04 79.92 80.77 81.60 82.39 83.16 DK 7.85 76.40 76.75 77.60 78.43 79.24 80.02 80.78 81.52 82.23 82.93 83.60 84.25 DE 7.60 77.30 77.64 78.47 79.28 80.06 80.82 81.56 82.27 82.97 83.63 84.28 84.91 EE 12.84 68.00 68.59 70.02 71.40 72.74 74.04 75.29 76.49 77.65 78.76 79.82 80.84 IE 7.66 77.54 77.88 78.72 79.53 80.32 81.08 81.83 82.55 83.24 83.92 84.57 85.20 EL 7.36 77.44 77.77 78.58 79.36 80.12 80.86 81.57 82.26 82.92 83.57 84.20 84.80 ES 7.54 77.40 77.74 78.56 79.37 80.14 80.90 81.63 82.34 83.02 83.68 84.32 84.94 FR 7.67 77.45 77.80 78.66 79.48 80.28 81.05 81.79 82.51 83.20 83.86 84.50 85.12 IT 6.91 78.54 78.85 79.61 80.34 81.05 81.74 82.41 83.06 83.69 84.29 84.88 85.45 CY 6.95 78.21 78.53 79.30 80.04 80.76 81.45 82.12 82.77 83.39 84.00 84.59 85.16 LV 14.51 65.95 66.61 68.22 69.78 71.30 72.77 74.19 75.56 76.87 78.13 79.33 80.47 LT 14.56 65.89 66.55 68.18 69.75 71.28 72.76 74.19 75.56 76.87 78.12 79.31 80.45 LU 8.18 76.32 76.70 77.62 78.50 79.35 80.17 80.96 81.73 82.46 83.17 83.85 84.50 HU 12.19 69.70 70.24 71.58 72.89 74.16 75.39 76.58 77.73 78.83 79.89 80.91 81.88 MT 8.34 75.98 76.37 77.33 78.24 79.10 79.94 80.74 81.51 82.25 82.96 83.65 84.32 NL 7.01 77.93 78.24 78.99 79.73 80.44 81.14 81.82 82.48 83.12 83.74 84.35 84.93 AT 7.47 77.42 77.76 78.58 79.38 80.15 80.89 81.62 82.32 82.99 83.65 84.28 84.89 PL 11.14 71.39 71.90 73.14 74.34 75.50 76.62 77.71 78.75 79.76 80.72 81.65 82.53 PT 8.27 75.82 76.19 77.10 77.98 78.83 79.66 80.46 81.23 81.98 82.71 83.41 84.08 RO 12.12 69.75 70.32 71.70 73.03 74.30 75.53 76.70 77.82 78.90 79.94 80.93 81.87 SI 9.01 74.70 75.10 76.09 77.05 77.98 78.89 79.76 80.61 81.43 82.22 82.98 83.71 SK 11.15 70.87 71.36 72.57 73.76 74.91 76.02 77.11 78.16 79.18 80.16 81.10 82.01 FI 8.20 76.13 76.49 77.39 78.27 79.12 79.94 80.73 81.50 82.24 82.96 83.65 84.32 SE 6.47 78.96 79.24 79.93 80.61 81.27 81.91 82.54 83.15 83.74 84.32 84.88 85.42 UK 7.67 77.36 77.71 78.55 79.37 80.16 80.93 81.67 82.39 83.09 83.76 84.40 85.03 NO 6.84 78.38 78.68 79.43 80.15 80.85 81.53 82.19 82.83 83.46 84.06 84.65 85.22 EU27 8.45 76.03 76.43 77.38 78.29 79.17 80.01 80.82 81.61 82.37 83.10 83.80 84.48 EA16 7.94 76.61 76.96 77.84 78.69 79.51 80.30 81.07 81.81 82.53 83.23 83.90 84.55 EU15 7.57 77.24 77.58 78.41 79.22 80.00 80.76 81.49 82.20 82.89 83.55 84.20 84.82 EU12 11.16 71.17 71.67 72.91 74.11 75.28 76.40 77.49 78.53 79.54 80.51 81.44 82.33 EU25 8.94 74.93 75.33 76.32 77.27 78.20 79.10 79.96 80.80 81.61 82.39 83.15 83.87 EA12 7.64 77.16 77.51 78.34 79.16 79.95 80.71 81.45 82.16 82.86 83.52 84.17 84.80 EU10 11.00 71.45 71.95 73.17 74.35 75.49 76.60 77.67 78.71 79.70 80.66 81.57 82.45
Table A 3 - Life expectancy at birth - Females (years)
Country Ch. 08-60 2008 2010 2015 2020 2025 2030 2035 2040 2045 2050 2055 2060 BE 6.64 82.30 82.60 83.33 84.03 84.71 85.38 86.02 86.64 87.24 87.83 88.39 88.94 BG 9.77 76.70 77.14 78.23 79.28 80.29 81.27 82.22 83.13 84.01 84.86 85.68 86.47 CZ 7.66 80.18 80.51 81.33 82.13 82.92 83.68 84.42 85.15 85.85 86.53 87.20 87.84 DK 7.40 81.03 81.36 82.18 82.97 83.74 84.48 85.20 85.89 86.56 87.21 87.83 88.43 DE 6.52 82.57 82.86 83.57 84.26 84.93 85.58 86.21 86.82 87.42 87.99 88.55 89.09 EE 8.79 78.74 79.14 80.12 81.06 81.98 82.86 83.71 84.54 85.33 86.09 86.82 87.53 IE 7.32 81.89 82.23 83.04 83.83 84.59 85.33 86.04 86.72 87.38 88.02 88.63 89.21 EL 6.12 82.57 82.83 83.48 84.12 84.73 85.34 85.93 86.51 87.07 87.62 88.16 88.68 ES 5.75 83.87 84.13 84.75 85.35 85.94 86.51 87.07 87.61 88.13 88.64 89.14 89.62 FR 5.75 84.32 84.59 85.23 85.84 86.44 87.02 87.57 88.11 88.63 89.13 89.61 90.08 IT 5.75 84.24 84.50 85.13 85.74 86.34 86.91 87.47 88.00 88.53 89.03 89.52 89.99 CY 6.96 81.70 82.01 82.76 83.49 84.20 84.89 85.56 86.22 86.86 87.48 88.08 88.66 LV 10.12 76.67 77.14 78.29 79.39 80.46 81.48 82.46 83.40 84.30 85.17 86.00 86.79 LT 9.44 77.43 77.86 78.93 79.96 80.94 81.89 82.81 83.68 84.53 85.34 86.12 86.87 LU 7.26 81.20 81.54 82.36 83.15 83.91 84.64 85.34 86.01 86.66 87.28 87.88 88.46 HU 9.25 78.06 78.48 79.50 80.50 81.46 82.39 83.29 84.16 84.99 85.80 86.57 87.31 MT 7.57 81.06 81.41 82.26 83.07 83.86 84.62 85.35 86.06 86.74 87.39 88.02 88.63 NL 6.71 82.18 82.48 83.22 83.93 84.62 85.29 85.94 86.57 87.18 87.77 88.34 88.89 AT 6.26 82.93 83.21 83.89 84.55 85.19 85.82 86.42 87.01 87.58 88.14 88.68 89.20 PL 8.11 79.92 80.29 81.19 82.06 82.90 83.71 84.50 85.26 85.99 86.69 87.37 88.03 PT 6.37 82.43 82.71 83.40 84.07 84.72 85.35 85.97 86.57 87.15 87.71 88.26 88.79 RO 9.97 76.61 77.08 78.21 79.29 80.33 81.33 82.29 83.22 84.11 84.96 85.79 86.58 SI 6.91 81.90 82.21 82.96 83.70 84.41 85.10 85.76 86.41 87.04 87.65 88.23 88.80 SK 8.65 78.72 79.10 80.04 80.95 81.84 82.71 83.55 84.36 85.15 85.91 86.65 87.37 FI 6.23 83.05 83.33 84.01 84.66 85.30 85.92 86.53 87.11 87.68 88.23 88.76 89.28 SE 6.17 83.14 83.42 84.09 84.74 85.37 85.99 86.58 87.16 87.72 88.27 88.80 89.31 UK 7.35 81.54 81.87 82.69 83.48 84.25 84.99 85.70 86.39 87.05 87.69 88.30 88.89 NO 6.31 82.88 83.16 83.85 84.52 85.17 85.80 86.41 87.00 87.57 88.13 88.67 89.19 EU27 6.92 82.08 82.40 83.17 83.92 84.64 85.34 86.01 86.65 87.27 87.87 88.45 89.00 EA16 6.67 82.31 82.61 83.34 84.05 84.73 85.40 86.05 86.67 87.28 87.86 88.43 88.98 EU15 6.51 82.62 82.91 83.62 84.32 84.99 85.64 86.27 86.87 87.46 88.04 88.59 89.12 EU12 8.60 78.97 79.36 80.32 81.24 82.13 82.99 83.83 84.63 85.41 86.16 86.88 87.57 EU25 7.24 81.35 81.67 82.47 83.24 83.99 84.71 85.42 86.09 86.75 87.38 88.00 88.59 EA12 6.39 82.80 83.08 83.78 84.46 85.12 85.76 86.37 86.97 87.55 88.12 88.66 89.19 EU10 8.34 79.44 79.82 80.74 81.63 82.50 83.33 84.14 84.92 85.68 86.41 87.11 87.78Source: Commission services.
Table A 4 - Life expectancy at 65 - Males (years)
Country Ch. 08-60 2008 2010 2015 2020 2025 2030 2035 2040 2045 2050 2055 2060 BE 5.18 16.48 16.69 17.22 17.74 18.26 18.77 19.27 19.76 20.25 20.73 21.20 21.66 BG 6.90 13.12 13.39 14.08 14.76 15.45 16.13 16.80 17.47 18.12 18.77 19.40 20.02 CZ 6.09 14.72 14.96 15.58 16.19 16.79 17.39 17.99 18.57 19.14 19.71 20.26 20.80 DK 5.36 16.08 16.30 16.84 17.39 17.92 18.45 18.97 19.48 19.99 20.48 20.97 21.44 DE 5.21 16.82 17.04 17.58 18.11 18.63 19.15 19.65 20.15 20.64 21.11 21.58 22.03 EE 6.86 13.01 13.29 13.97 14.66 15.34 16.02 16.69 17.35 17.99 18.63 19.26 19.87 IE 5.47 16.75 16.98 17.54 18.10 18.65 19.19 19.73 20.25 20.76 21.26 21.75 22.22 EL 4.83 17.18 17.37 17.87 18.36 18.84 19.32 19.79 20.25 20.70 21.14 21.58 22.01 ES 5.04 17.09 17.30 17.82 18.33 18.84 19.34 19.83 20.31 20.78 21.24 21.69 22.13 FR 4.79 17.73 17.93 18.43 18.92 19.40 19.88 20.34 20.80 21.25 21.68 22.11 22.52 IT 4.87 17.50 17.70 18.21 18.71 19.20 19.68 20.15 20.62 21.07 21.52 21.95 22.38 CY 4.84 17.12 17.32 17.81 18.30 18.78 19.26 19.73 20.19 20.65 21.09 21.53 21.97 LV 7.48 12.66 12.97 13.73 14.48 15.24 15.98 16.71 17.43 18.14 18.83 19.49 20.14 LT 7.14 13.12 13.41 14.14 14.86 15.58 16.29 16.99 17.67 18.34 19.00 19.63 20.25 LU 5.15 16.78 16.99 17.52 18.05 18.57 19.07 19.57 20.07 20.55 21.02 21.48 21.93 HU 6.98 13.62 13.90 14.62 15.33 16.03 16.72 17.41 18.08 18.73 19.37 20.00 20.60 MT 5.52 15.91 16.13 16.69 17.25 17.80 18.34 18.88 19.41 19.93 20.44 20.94 21.43 NL 5.15 16.55 16.76 17.28 17.80 18.31 18.82 19.32 19.81 20.29 20.77 21.24 21.69 AT 4.97 17.07 17.27 17.78 18.29 18.78 19.27 19.76 20.23 20.70 21.15 21.60 22.04 PL 6.48 14.45 14.72 15.39 16.05 16.70 17.34 17.98 18.60 19.20 19.80 20.37 20.93 PT 5.24 16.35 16.56 17.10 17.63 18.15 18.67 19.18 19.68 20.17 20.65 21.13 21.59 RO 6.78 13.59 13.86 14.54 15.22 15.90 16.57 17.23 17.89 18.53 19.16 19.77 20.37 SI 5.71 15.68 15.92 16.50 17.08 17.66 18.22 18.78 19.32 19.86 20.38 20.89 21.39 SK 6.92 13.29 13.57 14.26 14.95 15.64 16.32 17.00 17.67 18.32 18.97 19.60 20.21 FI 5.19 16.64 16.85 17.38 17.91 18.43 18.94 19.45 19.94 20.43 20.90 21.37 21.82 SE 4.73 17.42 17.61 18.09 18.57 19.04 19.51 19.97 20.42 20.86 21.30 21.73 22.15 UK 5.27 16.87 17.09 17.64 18.18 18.71 19.24 19.75 20.25 20.74 21.22 21.69 22.15 NO 4.80 17.33 17.53 18.01 18.50 18.98 19.45 19.92 20.37 20.83 21.27 21.70 22.13 EU27 5.35 16.49 16.73 17.30 17.83 18.36 18.91 19.44 19.94 20.43 20.91 21.38 21.84 EA16 5.26 16.56 16.77 17.31 17.84 18.37 18.89 19.40 19.90 20.40 20.88 21.35 21.81 EU15 5.10 16.89 17.10 17.62 18.14 18.65 19.15 19.65 20.13 20.61 21.08 21.54 21.98 EU12 6.47 14.19 14.45 15.11 15.76 16.41 17.05 17.68 18.30 18.91 19.51 20.10 20.67 EU25 5.62 15.87 16.11 16.68 17.25 17.81 18.37 18.91 19.45 19.98 20.50 21.00 21.49 EA12 5.09 16.91 17.12 17.64 18.16 18.67 19.17 19.67 20.15 20.63 21.10 21.56 22.00 EU10 6.40 14.36 14.62 15.27 15.91 16.56 17.19 17.81 18.43 19.03 19.62 20.20 20.76
Table A 5 - Life expectancy at 65 - Females (years)
Country Ch. 08-60 2008 2010 2015 2020 2025 2030 2035 2040 2045 2050 2055 2060 BE 4.97 20.12 20.33 20.85 21.36 21.86 22.35 22.83 23.30 23.76 24.22 24.66 25.09 BG 6.96 16.11 16.39 17.10 17.80 18.49 19.18 19.86 20.53 21.19 21.83 22.46 23.08 CZ 5.99 18.06 18.31 18.92 19.53 20.13 20.73 21.31 21.88 22.44 22.99 23.53 24.05 DK 5.67 18.98 19.22 19.83 20.42 20.99 21.56 22.11 22.64 23.17 23.67 24.17 24.65 DE 5.04 20.10 20.31 20.84 21.35 21.86 22.36 22.85 23.33 23.80 24.26 24.71 25.14 EE 6.09 18.10 18.36 18.99 19.61 20.23 20.83 21.42 22.00 22.57 23.13 23.67 24.19 IE 5.65 19.72 19.96 20.56 21.15 21.73 22.29 22.84 23.38 23.90 24.41 24.89 25.37 EL 4.91 19.64 19.84 20.33 20.82 21.31 21.79 22.26 22.73 23.20 23.65 24.11 24.55 ES 4.54 20.96 21.15 21.62 22.08 22.54 22.98 23.42 23.86 24.28 24.70 25.10 25.50 FR 4.15 22.05 22.22 22.66 23.09 23.51 23.92 24.32 24.71 25.10 25.47 25.84 26.20 IT 4.50 21.40 21.59 22.06 22.53 22.98 23.43 23.87 24.29 24.71 25.12 25.51 25.90 CY 5.62 18.96 19.19 19.76 20.33 20.89 21.45 22.00 22.54 23.07 23.58 24.09 24.58 LV 6.63 17.14 17.42 18.11 18.79 19.46 20.12 20.77 21.40 22.02 22.62 23.20 23.77 LT 6.20 17.52 17.78 18.42 19.05 19.67 20.28 20.89 21.48 22.06 22.63 23.18 23.72 LU 5.05 19.74 19.95 20.47 20.99 21.50 22.00 22.49 22.97 23.43 23.89 24.34 24.78 HU 6.55 17.47 17.74 18.43 19.10 19.76 20.42 21.05 21.68 22.29 22.88 23.46 24.01 MT 5.69 19.12 19.36 19.95 20.54 21.12 21.68 22.24 22.78 23.31 23.82 24.32 24.81 NL 5.09 19.92 20.14 20.67 21.19 21.70 22.21 22.70 23.18 23.66 24.12 24.57 25.01 AT 4.87 20.33 20.53 21.03 21.53 22.02 22.50 22.97 23.43 23.89 24.33 24.77 25.19 PL 5.89 18.55 18.80 19.42 20.02 20.62 21.20 21.78 22.34 22.88 23.42 23.94 24.45 PT 4.94 19.87 20.07 20.58 21.08 21.58 22.06 22.54 23.01 23.48 23.93 24.37 24.81 RO 6.91 16.32 16.60 17.30 18.00 18.69 19.37 20.05 20.71 21.36 22.00 22.62 23.23 SI 5.29 19.62 19.84 20.39 20.93 21.46 21.99 22.50 23.01 23.50 23.98 24.45 24.91 SK 6.58 17.14 17.41 18.09 18.75 19.41 20.07 20.71 21.34 21.96 22.56 23.15 23.73 FI 4.71 20.66 20.85 21.34 21.82 22.30 22.76 23.22 23.67 24.10 24.53 24.95 25.36 SE 4.82 20.48 20.68 21.18 21.68 22.16 22.64 23.11 23.56 24.01 24.45 24.88 25.29 UK 5.59 19.51 19.75 20.35 20.93 21.50 22.06 22.60 23.13 23.65 24.15 24.63 25.10 NO 4.86 20.37 20.57 21.08 21.58 22.07 22.55 23.02 23.49 23.94 24.38 24.81 25.23 EU27 5.17 19.96 20.18 20.72 21.25 21.77 22.30 22.81 23.31 23.79 24.25 24.69 25.12 EA16 5.10 19.96 20.17 20.70 21.22 21.74 22.24 22.74 23.22 23.70 24.16 24.62 25.06 EU15 4.97 20.23 20.44 20.96 21.47 21.97 22.46 22.94 23.41 23.88 24.33 24.77 25.20 EU12 6.20 17.84 18.10 18.74 19.37 19.99 20.61 21.21 21.81 22.39 22.95 23.51 24.04 EU25 5.40 19.41 19.63 20.19 20.75 21.29 21.83 22.35 22.87 23.37 23.86 24.34 24.81 EA12 4.87 20.37 20.58 21.08 21.58 22.07 22.55 23.03 23.49 23.94 24.39 24.82 25.24 EU10 6.05 18.17 18.42 19.05 19.67 20.28 20.88 21.47 22.04 22.61 23.16 23.70 24.22Source: Commission services.
Table A 6 – Net migration (thousands people)
Country Ch. 08-60 2008 2010 2015 2020 2025 2030 2035 2040 2045 2050 2055 2060 BE -27.4 50.7 47.5 41.0 36.2 33.6 31.4 28.8 27.1 26.3 25.2 25.0 23.3 BG 0.2 -1.4 0.4 1.7 0.2 -0.4 -0.5 1.4 2.5 2.0 1.6 1.1 -1.2 CZ -7.4 24.0 25.9 27.7 24.7 21.3 22.9 23.3 27.3 24.1 21.9 20.4 16.7 DK -3.5 9.7 9.8 8.5 8.1 8.1 8.7 7.0 6.5 6.0 5.7 5.9 6.2 DE -43.9 159.8 146.7 166.3 173.1 186.6 187.0 159.6 131.6 140.5 135.7 137.9 115.9 EE 0.2 -0.6 -0.4 0.0 -0.1 -0.1 -0.3 -0.1 0.1 0.2 0.3 0.2 -0.3 IE -54.4 63.1 53.4 34.5 21.7 13.5 8.7 6.5 6.0 8.0 7.4 7.9 8.6 EL -12.9 39.7 39.5 39.9 38.2 38.1 37.2 38.0 36.6 35.5 31.0 28.6 26.8 ES -493.6 623.4 540.2 375.8 263.1 190.4 160.8 149.3 150.5 146.1 135.2 131.8 129.9 FR -36.4 99.3 97.9 97.4 92.5 88.9 86.5 82.6 76.9 73.9 69.9 66.4 62.9 IT -85.3 259.5 255.9 248.6 240.8 240.8 248.7 239.9 229.5 206.9 193.4 185.8 174.3 CY -3.4 9.3 9.2 8.8 8.5 8.2 7.8 7.5 7.2 6.9 6.6 6.2 5.9 LV 0.4 -1.0 -0.8 -0.3 -0.3 -0.2 -0.6 -0.2 0.1 0.3 0.7 0.5 -0.6 LT 2.1 -2.2 -1.7 -0.7 -0.2 0.2 -0.3 -0.1 -0.2 0.3 1.2 1.0 -0.1 LU -1.6 4.4 4.3 4.1 4.0 3.8 3.7 3.5 3.4 3.2 3.1 2.9 2.8 HU -4.8 19.6 19.1 22.1 22.4 18.0 17.3 19.3 22.3 19.6 17.9 16.6 14.9 MT -0.2 1.0 1.0 1.1 1.0 1.0 0.9 0.9 0.9 0.9 0.9 0.9 0.8 NL 0.5 7.8 7.7 8.2 10.6 13.1 13.7 12.6 6.5 6.7 7.2 9.3 8.4 AT -10.7 33.1 32.6 31.4 30.5 31.5 31.2 28.7 26.0 25.6 24.7 23.9 22.3 PL 23.7 -15.5 -15.3 8.5 14.0 4.9 -1.3 4.4 17.1 24.4 26.4 17.2 8.2 PT -17.3 51.8 51.1 49.2 47.6 46.9 46.1 45.2 45.3 42.5 38.8 36.6 34.5 RO 9.5 -5.6 -5.1 4.0 6.3 1.8 -0.8 11.4 12.9 14.1 12.7 9.4 3.9 SI -3.6 5.9 5.2 5.0 4.4 3.6 3.4 3.1 3.3 3.4 3.0 2.6 2.3 SK 0.1 3.6 3.2 5.0 5.0 4.0 3.9 4.1 6.1 6.4 6.1 5.2 3.7 FI -5.2 9.7 10.0 9.5 7.8 6.6 5.8 4.6 4.8 4.9 4.9 5.0 4.5 SE -31.1 46.8 42.3 33.3 26.9 22.6 20.2 18.1 17.2 16.7 16.7 18.2 15.8 UK -74.6 188.2 183.9 174.3 165.7 158.0 150.9 144.3 138.0 131.8 126.3 122.2 113.6 NO -12.8 22.4 20.8 17.5 15.2 13.5 12.4 11.6 11.0 10.6 10.3 10.1 9.6 EU27 -880.4 1683.9 1563.4 1404.8 1252.8 1144.7 1093.1 1043.8 1005.5 977.3 924.3 888.8 803.5 EA16 -795.3 1421.9 1305.3 1125.8 985.1 910.6 876.8 815.0 761.8 737.8 693.1 676.2 626.6 EU15 -897.3 1646.9 1522.8 1322.1 1166.8 1082.5 1040.7 968.8 905.9 874.7 825.1 807.5 749.5 EU12 16.9 37.1 40.6 82.7 86.0 62.3 52.4 75.0 99.6 102.6 99.3 81.3 54.0 EU25 -890.2 1690.9 1568.1 1399.1 1246.2 1143.3 1094.4 1031.0 990.1 961.1 910.1 878.4 800.8 EA12 -788.2 1402.2 1286.8 1105.9 966.1 893.8 860.8 799.4 744.3 720.2 676.4 661.2 614.0 EU10 7.2 44.1 45.3 77.0 79.4 60.9 53.7 62.2 84.2 86.4 85.0 70.9 51.2
Table A 7 – Net migration (as % of population)
Country Ch. 08-60 2008 2010 2015 2020 2025 2030 2035 2040 2045 2050 2055 2060 BE -0.3 0.5 0.4 0.4 0.3 0.3 0.3 0.2 0.2 0.2 0.2 0.2 0.2 BG 0.0 0.0 0.0 0.0 0.0 0.0 0.0 0.0 0.0 0.0 0.0 0.0 0.0 CZ -0.1 0.2 0.2 0.3 0.2 0.2 0.2 0.2 0.3 0.2 0.2 0.2 0.2 DK -0.1 0.2 0.2 0.2 0.1 0.1 0.2 0.1 0.1 0.1 0.1 0.1 0.1 DE 0.0 0.2 0.2 0.2 0.2 0.2 0.2 0.2 0.2 0.2 0.2 0.2 0.2 EE 0.0 0.0 0.0 0.0 0.0 0.0 0.0 0.0 0.0 0.0 0.0 0.0 0.0 IE -1.3 1.4 1.2 0.7 0.4 0.2 0.1 0.1 0.1 0.1 0.1 0.1 0.1 EL -0.1 0.4 0.3 0.3 0.3 0.3 0.3 0.3 0.3 0.3 0.3 0.3 0.2 ES -1.1 1.4 1.2 0.8 0.5 0.4 0.3 0.3 0.3 0.3 0.3 0.3 0.3 FR -0.1 0.2 0.2 0.2 0.1 0.1 0.1 0.1 0.1 0.1 0.1 0.1 0.1 IT -0.1 0.4 0.4 0.4 0.4 0.4 0.4 0.4 0.4 0.3 0.3 0.3 0.3 CY -0.7 1.2 1.1 1.0 0.9 0.8 0.7 0.7 0.6 0.6 0.5 0.5 0.4 LV 0.0 0.0 0.0 0.0 0.0 0.0 0.0 0.0 0.0 0.0 0.0 0.0 0.0 LT 0.1 -0.1 -0.1 0.0 0.0 0.0 0.0 0.0 0.0 0.0 0.0 0.0 0.0 LU -0.5 0.9 0.9 0.8 0.7 0.7 0.6 0.6 0.5 0.5 0.4 0.4 0.4 HU 0.0 0.2 0.2 0.2 0.2 0.2 0.2 0.2 0.2 0.2 0.2 0.2 0.2 MT 0.0 0.2 0.2 0.3 0.2 0.2 0.2 0.2 0.2 0.2 0.2 0.2 0.2 NL 0.0 0.0 0.0 0.0 0.1 0.1 0.1 0.1 0.0 0.0 0.0 0.1 0.1 AT -0.1 0.4 0.4 0.4 0.3 0.4 0.3 0.3 0.3 0.3 0.3 0.3 0.2 PL 0.1 0.0 0.0 0.0 0.0 0.0 0.0 0.0 0.0 0.1 0.1 0.1 0.0 PT -0.2 0.5 0.5 0.4 0.4 0.4 0.4 0.4 0.4 0.4 0.3 0.3 0.3 RO 0.0 0.0 0.0 0.0 0.0 0.0 0.0 0.1 0.1 0.1 0.1 0.1 0.0 SI -0.2 0.3 0.3 0.2 0.2 0.2 0.2 0.2 0.2 0.2 0.2 0.1 0.1 SK 0.0 0.1 0.1 0.1 0.1 0.1 0.1 0.1 0.1 0.1 0.1 0.1 0.1 FI -0.1 0.2 0.2 0.2 0.1 0.1 0.1 0.1 0.1 0.1 0.1 0.1 0.1 SE -0.4 0.5 0.5 0.3 0.3 0.2 0.2 0.2 0.2 0.2 0.2 0.2 0.1 UK -0.2 0.3 0.3 0.3 0.3 0.2 0.2 0.2 0.2 0.2 0.2 0.2 0.1 NO -0.3 0.5 0.4 0.4 0.3 0.3 0.2 0.2 0.2 0.2 0.2 0.2 0.2 EU27 -0.2 0.3 0.3 0.3 0.2 0.2 0.2 0.2 0.2 0.2 0.2 0.2 0.2 EA16 -0.3 0.4 0.4 0.3 0.3 0.3 0.3 0.2 0.2 0.2 0.2 0.2 0.2 EU15 -0.2 0.4 0.4 0.3 0.3 0.3 0.2 0.2 0.2 0.2 0.2 0.2 0.2 EU12 0.0 0.0 0.0 0.1 0.1 0.1 0.1 0.1 0.1 0.1 0.1 0.1 0.1 EU25 -0.2 0.4 0.3 0.3 0.3 0.2 0.2 0.2 0.2 0.2 0.2 0.2 0.2 EA12 -0.3 0.4 0.4 0.3 0.3 0.3 0.3 0.2 0.2 0.2 0.2 0.2 0.2 EU10 0.0 0.1 0.1 0.1 0.1 0.1 0.1 0.1 0.1 0.1 0.1 0.1 0.1Source: Commission services.
Table A 8 - Population (millions people)
Country Ch. 07-60 2007 2010 2015 2020 2025 2030 2035 2040 2045 2050 2055 2060 BE 1.7 10.6 10.8 11.1 11.3 11.5 11.7 11.9 12.0 12.1 12.2 12.2 12.3 BG -2.2 7.7 7.6 7.4 7.2 7.0 6.8 6.5 6.3 6.1 5.9 5.7 5.5 CZ -0.8 10.3 10.4 10.5 10.5 10.5 10.4 10.3 10.2 10.0 9.9 9.7 9.5 DK 0.5 5.4 5.5 5.6 5.7 5.7 5.8 5.9 5.9 5.9 5.9 5.9 5.9 DE -11.6 82.3 82.1 81.9 81.5 80.9 80.2 79.1 77.8 76.2 74.5 72.6 70.8 EE -0.2 1.3 1.3 1.3 1.3 1.3 1.3 1.2 1.2 1.2 1.2 1.2 1.1 IE 2.4 4.3 4.6 5.1 5.4 5.7 5.9 6.1 6.2 6.4 6.5 6.7 6.8 EL -0.1 11.2 11.3 11.5 11.6 11.6 11.6 11.6 11.6 11.5 11.4 11.3 11.1 ES 7.4 44.5 46.7 49.4 51.1 52.1 52.7 53.0 53.3 53.4 53.2 52.7 51.9 FR 10.3 61.5 62.6 64.2 65.6 66.8 68.0 69.0 69.9 70.6 71.0 71.4 71.8 IT 0.3 59.1 60.0 60.9 61.4 61.7 61.9 62.0 62.0 61.8 61.2 60.4 59.4 CY 0.5 0.8 0.8 0.9 1.0 1.0 1.1 1.1 1.2 1.2 1.3 1.3 1.3 LV -0.6 2.3 2.2 2.2 2.2 2.1 2.0 2.0 1.9 1.9 1.8 1.7 1.7 LT -0.8 3.4 3.3 3.3 3.2 3.2 3.1 3.0 2.9 2.8 2.7 2.6 2.5 LU 0.3 0.5 0.5 0.5 0.6 0.6 0.6 0.6 0.7 0.7 0.7 0.7 0.7 HU -1.3 10.1 10.0 10.0 9.9 9.8 9.7 9.5 9.4 9.2 9.1 8.9 8.7 MT 0.0 0.4 0.4 0.4 0.4 0.4 0.4 0.4 0.4 0.4 0.4 0.4 0.4 NL 0.2 16.4 16.5 16.7 16.9 17.1 17.2 17.3 17.2 17.1 16.9 16.7 16.6 AT 0.7 8.3 8.4 8.6 8.7 8.9 9.0 9.1 9.1 9.1 9.1 9.1 9.0 PL -7.0 38.1 38.1 38.1 38.0 37.6 37.0 36.1 35.2 34.3 33.3 32.2 31.1 PT 0.7 10.6 10.7 10.9 11.1 11.2 11.3 11.4 11.5 11.5 11.4 11.4 11.3 RO -4.6 21.6 21.3 21.1 20.8 20.5 20.0 19.6 19.2 18.7 18.1 17.6 16.9 SI -0.2 2.0 2.0 2.1 2.1 2.0 2.0 2.0 2.0 1.9 1.9 1.8 1.8 SK -0.8 5.4 5.4 5.4 5.4 5.4 5.3 5.2 5.1 5.0 4.9 4.7 4.5 FI 0.1 5.3 5.3 5.4 5.5 5.5 5.6 5.6 5.5 5.5 5.4 5.4 5.4 SE 1.8 9.1 9.3 9.6 9.9 10.1 10.3 10.4 10.5 10.6 10.7 10.8 10.9 UK 15.8 60.9 62.0 63.8 65.7 67.5 69.2 70.7 72.0 73.3 74.5 75.6 76.7 NO 1.4 4.7 4.8 5.0 5.2 5.4 5.5 5.6 5.7 5.8 5.9 6.0 6.0 EU27 12.4 493.3 499.4 507.7 513.8 517.8 519.9 520.7 520.1 518.4 515.3 511.0 505.7 EA16 12.0 323.1 328.3 334.9 339.5 342.5 344.4 345.4 345.5 344.4 342.2 339.0 335.1 EU15 30.6 389.9 396.4 405.1 411.9 417.0 420.9 423.6 425.2 425.6 424.9 423.0 420.5 EU12 -18.1 103.3 103.0 102.6 102.0 100.8 99.1 97.1 94.9 92.7 90.4 87.9 85.2 EU25 19.3 464.0 470.5 479.2 485.8 490.4 493.1 494.5 494.6 493.6 491.2 487.7 483.3 EA12 12.5 314.5 319.6 326.2 330.7 333.6 335.6 336.7 336.8 335.9 333.8 330.7 327.1 EU10 -11.3 74.1 74.1 74.1 74.0 73.4 72.3 70.9 69.4 67.9 66.4 64.7 62.8
Table A 9 – Children population (0-14) (as % of total population)
Country Ch. 07-60 2007 2010 2015 2020 2025 2030 2035 2040 2045 2050 2055 2060 BE -1.3 17.0 16.8 16.7 16.7 16.5 16.3 16.0 15.8 15.7 15.7 15.7 15.6 BG -1.5 13.4 13.5 14.2 14.3 13.5 12.6 12.0 12.0 12.3 12.3 12.2 12.0 CZ -2.1 14.4 14.1 14.6 14.7 13.8 12.8 12.2 12.1 12.4 12.6 12.5 12.3 DK -2.4 18.6 18.1 17.3 16.7 16.6 16.9 17.1 17.0 16.6 16.3 16.2 16.3 DE -1.3 13.9 13.4 12.8 12.6 12.7 12.7 12.5 12.2 12.1 12.1 12.3 12.6 EE -0.9 14.9 15.1 16.3 16.9 16.3 15.1 14.0 13.8 14.1 14.5 14.4 14.0 IE -3.4 20.3 20.7 21.1 21.1 20.2 18.9 17.8 17.4 17.4 17.5 17.3 17.0 EL -1.4 14.3 14.3 14.5 14.4 13.7 13.0 12.7 12.7 13.0 13.1 13.1 12.9 ES -1.6 14.5 15.0 15.7 15.5 14.5 13.4 12.8 12.7 13.0 13.2 13.1 12.9 FR -1.7 18.4 18.4 18.4 18.2 17.8 17.4 17.1 17.0 17.1 17.0 16.9 16.7 IT -1.9 14.1 14.0 13.9 13.4 12.7 12.2 12.1 12.2 12.3 12.3 12.2 12.1 CY -3.0 17.9 17.1 16.9 17.4 17.4 16.6 15.7 15.1 14.9 15.1 15.1 15.0 LV -1.7 14.0 13.7 14.7 15.3 14.8 13.6 12.6 12.1 12.3 12.6 12.6 12.3 LT -3.5 15.9 14.7 14.3 14.8 14.8 14.1 13.0 12.1 12.0 12.2 12.5 12.4 LU -2.2 18.3 18.0 17.3 16.9 16.9 16.9 16.9 16.7 16.4 16.2 16.1 16.2 HU -2.5 15.2 14.8 14.8 14.8 14.3 13.6 13.0 12.8 12.8 12.9 12.9 12.7 MT -4.1 16.8 15.6 14.6 14.6 14.4 14.0 13.3 12.7 12.5 12.6 12.7 12.7 NL -3.1 18.1 17.5 16.6 15.7 15.5 15.7 15.7 15.6 15.3 14.9 14.8 15.0 AT -1.8 15.6 14.9 14.4 14.3 14.3 14.1 13.9 13.6 13.5 13.5 13.7 13.8 PL -4.4 15.8 15.0 14.6 14.8 14.2 13.1 12.0 11.4 11.4 11.6 11.6 11.4 PT -2.7 15.5 15.3 15.1 14.5 13.8 13.3 13.0 13.0 13.0 13.0 12.9 12.8 RO -3.9 15.4 15.1 14.9 14.7 13.9 13.0 12.2 11.8 11.8 11.8 11.7 11.5 SI -1.2 14.0 13.8 14.0 14.2 13.6 12.8 12.2 12.1 12.4 12.8 12.9 12.8 SK -5.0 16.1 15.2 14.7 14.6 13.9 12.9 11.9 11.3 11.2 11.3 11.3 11.1 FI -1.3 17.1 16.6 16.4 16.6 16.6 16.3 15.9 15.6 15.6 15.7 15.8 15.7 SE -0.6 17.0 16.5 17.0 17.4 17.5 17.3 16.8 16.2 16.1 16.3 16.5 16.5 UK -1.0 17.6 17.3 17.3 17.7 17.8 17.6 17.2 16.8 16.6 16.6 16.6 16.6 NO -2.6 19.4 18.9 18.2 18.0 17.9 17.8 17.5 17.2 16.9 16.7 16.7 16.7 EU27 -1.7 15.8 15.5 15.5 15.4 15.0 14.5 14.1 14.0 14.0 14.1 14.1 14.0 EA16 -1.6 15.5 15.4 15.2 15.0 14.6 14.2 13.9 13.8 13.8 13.9 13.9 13.9 EU15 -1.4 15.9 15.7 15.6 15.5 15.2 14.9 14.6 14.4 14.4 14.5 14.5 14.5 EU12 -3.5 15.3 14.8 14.7 14.8 14.1 13.1 12.3 11.9 11.9 12.1 12.0 11.8 EU25 -1.7 15.8 15.6 15.5 15.4 15.1 14.6 14.3 14.1 14.1 14.2 14.2 14.1 EA12 -1.6 15.5 15.4 15.3 15.0 14.6 14.2 13.9 13.8 13.9 13.9 13.9 13.9 EU10 -3.5 15.5 14.8 14.7 14.8 14.3 13.3 12.3 11.9 11.9 12.1 12.1 11.9Source: Commission services.
Table A 10 – Prime age population (25-54) (as % of total population)
Country Ch. 07-60 2007 2010 2015 2020 2025 2030 2035 2040 2045 2050 2055 2060 BE -6.6 42.2 41.6 40.4 39.1 37.9 37.0 36.8 36.4 36.1 35.8 35.7 35.6 BG -9.3 42.7 42.9 43.3 42.8 41.2 39.3 37.5 35.9 34.1 33.2 33.5 33.4 CZ -10.4 44.3 43.8 43.6 43.6 42.1 39.7 37.2 36.1 35.0 33.9 34.0 33.9 DK -5.7 41.3 40.2 39.0 38.1 36.9 36.1 36.0 36.4 36.3 35.9 35.7 35.6 DE -9.7 43.2 42.8 41.8 39.4 36.9 36.2 35.9 35.1 34.1 33.7 33.5 33.5 EE -6.7 41.6 41.9 42.6 41.8 40.3 38.8 38.2 37.0 35.0 34.4 34.8 34.9 IE -8.3 44.1 44.5 44.1 42.8 41.5 40.2 38.6 37.1 36.5 36.3 36.0 35.8 EL -10.0 44.1 44.1 42.9 41.5 39.5 37.5 36.0 34.9 34.5 34.2 34.2 34.1 ES -13.0 46.7 46.8 45.5 43.4 40.9 38.4 36.1 34.8 34.2 33.9 33.9 33.7 FR -5.9 40.9 40.0 38.8 37.4 36.2 35.3 35.3 35.2 35.0 35.0 35.0 34.9 IT -10.0 43.8 43.3 42.3 40.5 38.2 36.3 35.3 34.9 34.6 34.1 34.0 33.7 CY -6.7 43.7 44.5 44.7 44.3 43.7 42.6 41.5 40.0 38.9 37.8 37.2 37.0 LV -8.4 42.2 43.1 44.1 43.5 41.7 40.0 39.1 37.3 34.7 33.3 33.8 33.8 LT -9.8 42.4 43.2 44.0 43.5 42.1 40.1 38.9 37.4 35.0 33.1 32.5 32.6 LU -8.2 45.5 44.7 43.2 41.6 40.2 39.5 38.9 38.5 38.2 37.9 37.5 37.3 HU -9.5 43.6 42.9 42.4 43.0 42.2 40.4 38.0 36.9 35.9 34.9 34.5 34.1 MT -8.3 41.9 41.7 41.1 40.9 41.0 40.1 38.5 37.0 35.8 34.6 33.8 33.6 NL -8.0 43.0 41.9 40.4 38.8 37.1 36.4 36.4 36.2 35.8 35.5 35.3 34.9 AT -8.8 44.0 44.0 43.0 41.2 39.0 37.8 37.5 36.7 36.1 35.5 35.3 35.2 PL -11.5 43.9 44.1 43.5 43.5 43.0 41.4 39.2 36.6 34.6 33.2 32.6 32.4 PT -9.5 43.9 43.9 43.1 41.7 40.5 39.1 37.4 36.2 35.7 35.2 34.9 34.4 RO -11.3 44.2 44.2 45.1 45.6 43.5 41.4 39.0 37.2 34.5 33.6 33.2 32.8 SI -12.5 45.7 45.1 43.7 41.7 39.5 37.7 35.8 34.3 33.3 33.0 33.1 33.2 SK -13.1 45.5 45.7 45.7 45.4 44.4 42.3 39.4 37.0 34.9 33.3 32.7 32.4 FI -5.7 40.3 39.4 37.9 36.9 35.9 35.6 35.3 34.9 34.9 34.6 34.6 34.6 SE -4.0 39.5 39.1 39.1 39.2 37.6 36.5 36.5 36.5 36.0 35.2 35.5 35.6 UK -4.5 41.2 41.1 41.2 40.4 39.1 38.2 38.5 38.1 37.4 36.8 36.7 36.7 NO -6.2 41.6 41.1 40.2 39.6 38.3 37.0 36.6 36.4 36.1 35.7 35.4 35.4 EU27 -8.6 43.1 42.8 42.1 40.8 39.0 37.7 36.8 36.0 35.2 34.7 34.5 34.4 EA16 -9.2 43.4 43.0 41.9 40.1 38.1 36.8 36.0 35.3 34.8 34.4 34.3 34.2 EU15 -8.2 42.9 42.5 41.6 40.0 38.2 36.9 36.3 35.8 35.3 34.9 34.8 34.7 EU12 -10.8 43.9 43.9 43.9 43.9 42.7 40.9 38.7 36.7 34.8 33.6 33.3 33.1 EU25 -8.5 43.0 42.7 41.9 40.5 38.8 37.5 36.7 35.9 35.2 34.7 34.6 34.5 EA12 -9.1 43.3 42.9 41.8 40.0 38.0 36.7 35.9 35.2 34.7 34.4 34.4 34.2 EU10 -10.8 43.9 43.9 43.6 43.5 42.7 40.9 38.7 36.7 35.0 33.7 33.3 33.1
Table A 11 – Working age population (15-64) (as % of total population)
Country Ch. 07-60 2007 2010 2015 2020 2025 2030 2035 2040 2045 2050 2055 2060 BE -8.1 65.9 66.0 65.0 63.8 62.4 60.9 59.8 59.2 59.0 58.6 58.2 57.8 BG -15.5 69.3 69.1 67.0 65.4 64.7 64.2 63.2 61.3 58.6 56.4 54.4 53.8 CZ -16.9 71.2 70.5 67.5 65.1 64.5 64.3 63.8 61.6 58.4 56.5 55.1 54.4 DK -7.4 66.1 65.5 64.1 63.1 62.0 60.3 58.7 58.2 58.4 59.2 59.4 58.7 DE -11.3 66.3 66.0 65.9 64.6 62.6 59.7 57.3 56.7 56.7 56.2 55.4 55.0 EE -12.7 68.0 67.9 66.1 64.3 63.5 63.2 63.2 62.1 60.4 58.1 55.7 55.3 IE -10.7 68.6 68.0 66.6 65.6 65.2 65.1 64.6 63.3 61.1 58.8 57.8 57.8 EL -11.7 67.1 66.8 65.5 64.5 63.8 62.8 61.0 58.9 56.8 55.3 55.2 55.4 ES -14.1 68.8 68.3 67.0 66.3 65.7 64.5 62.4 59.6 56.6 54.7 54.3 54.7 FR -7.8 65.2 64.8 63.1 61.6 60.5 59.4 58.5 57.6 57.5 57.3 57.3 57.4 IT -10.9 66.0 65.6 64.5 63.9 63.3 61.6 59.3 57.0 55.5 55.1 55.1 55.1 CY -10.9 69.8 70.3 69.3 67.5 66.1 65.4 65.3 64.9 63.8 61.7 60.0 58.8 LV -15.6 68.9 69.0 67.6 66.1 65.0 64.2 63.8 62.4 60.6 57.8 54.6 53.3 LT -15.6 68.5 69.2 69.1 67.6 65.7 63.8 62.7 61.5 60.3 58.1 55.0 52.9 LU -7.4 67.6 67.8 67.6 66.9 65.4 63.5 61.9 61.1 60.9 60.8 60.7 60.3 HU -13.5 68.9 68.6 67.4 65.4 64.3 64.5 63.8 62.2 59.4 57.7 56.4 55.4 MT -14.8 69.7 69.6 67.4 65.1 63.0 61.8 61.9 61.6 60.2 58.4 56.5 54.9 NL -9.7 67.4 67.2 65.6 64.5 62.6 60.2 58.3 57.5 58.0 58.4 58.3 57.8 AT -10.3 67.5 67.5 67.2 66.3 64.6 62.2 60.1 59.2 58.9 58.3 57.8 57.2 PL -18.3 70.8 71.5 70.0 67.0 64.6 63.9 63.8 62.7 60.2 56.8 54.1 52.5 PT -10.9 67.3 66.9 66.1 65.5 64.7 63.5 62.1 60.2 58.2 56.9 56.5 56.3 RO -16.2 69.8 70.0 69.4 67.9 66.7 66.8 64.9 62.6 59.7 57.3 54.3 53.6 SI -16.4 70.1 69.5 68.1 65.4 63.5 61.9 60.4 58.9 56.7 54.7 53.7 53.8 SK -19.3 72.0 72.5 71.5 69.0 67.0 65.9 65.2 63.4 60.2 57.0 54.4 52.7 FI -10.0 66.5 66.4 63.4 61.0 59.3 58.2 57.7 58.2 58.0 57.5 57.1 56.4 SE -8.7 65.6 65.3 63.1 61.8 60.9 60.2 59.6 59.5 59.5 59.0 58.0 56.9 UK -7.7 66.4 66.3 65.1 64.0 63.1 61.8 60.9 60.8 61.0 60.5 59.5 58.7 NO -8.1 66.0 66.1 65.1 63.9 62.5 61.2 59.9 59.0 59.0 58.9 58.5 57.9 EU27 -11.3 67.3 67.1 65.9 64.6 63.3 61.9 60.4 59.2 58.1 57.1 56.4 56.0 EA16 -10.8 66.7 66.4 65.3 64.2 63.0 61.3 59.5 58.1 57.1 56.4 56.0 55.9 EU15 -10.0 66.5 66.2 65.1 64.1 62.9 61.3 59.6 58.5 57.8 57.2 56.7 56.5 EU12 -16.7 70.2 70.4 69.1 66.8 65.1 64.7 64.0 62.4 59.7 57.0 54.7 53.5 EU25 -11.0 67.1 66.9 65.7 64.4 63.2 61.7 60.2 59.0 58.1 57.1 56.5 56.1 EA12 -10.6 66.6 66.2 65.2 64.2 62.9 61.2 59.4 58.0 57.0 56.3 56.0 56.0 EU10 -17.0 70.4 70.7 69.2 66.6 64.7 64.1 63.8 62.4 59.8 57.0 54.8 53.5Source: Commission services.
Table A 12 – Elderly population (65 and over) (as % of total population)
Country Ch. 07-60 2007 2010 2015 2020 2025 2030 2035 2040 2045 2050 2055 2060 BE 9.4 17.1 17.2 18.3 19.5 21.1 22.9 24.2 25.0 25.4 25.7 26.0 26.5 BG 17.0 17.3 17.5 18.9 20.3 21.8 23.3 24.7 26.7 29.1 31.3 33.4 34.2 CZ 19.0 14.4 15.4 17.9 20.2 21.8 22.9 24.1 26.3 29.3 30.9 32.4 33.4 DK 9.7 15.3 16.4 18.6 20.1 21.4 22.8 24.1 24.8 24.9 24.5 24.4 25.0 DE 12.7 19.8 20.6 21.2 22.8 24.7 27.6 30.2 31.1 31.3 31.7 32.3 32.5 EE 13.6 17.1 17.0 17.7 18.8 20.2 21.7 22.8 24.2 25.5 27.4 29.9 30.7 IE 14.1 11.1 11.3 12.2 13.3 14.5 16.0 17.6 19.4 21.5 23.7 24.8 25.2 EL 13.1 18.6 18.9 20.0 21.1 22.6 24.2 26.3 28.4 30.2 31.5 31.8 31.7 ES 15.7 16.7 16.7 17.3 18.2 19.8 22.1 24.8 27.7 30.5 32.1 32.6 32.3 FR 9.5 16.4 16.7 18.5 20.2 21.7 23.2 24.4 25.3 25.4 25.6 25.9 25.9 IT 12.8 19.9 20.3 21.7 22.7 24.0 26.2 28.6 30.8 32.2 32.6 32.7 32.7 CY 13.9 12.3 12.7 13.8 15.0 16.5 17.9 19.0 20.0 21.3 23.2 24.8 26.2 LV 17.3 17.1 17.4 17.7 18.6 20.2 22.2 23.7 25.4 27.1 29.6 32.8 34.4 LT 19.1 15.6 16.0 16.6 17.6 19.5 22.1 24.3 26.3 27.7 29.7 32.5 34.7 LU 9.5 14.0 14.3 15.1 16.2 17.7 19.6 21.3 22.2 22.7 23.0 23.1 23.6 HU 16.0 15.9 16.6 17.7 19.8 21.4 22.0 23.1 25.0 27.7 29.3 30.7 31.9 MT 18.9 13.5 14.8 18.0 20.3 22.6 24.2 24.8 25.7 27.3 29.1 30.8 32.4 NL 12.8 14.5 15.3 17.8 19.8 21.9 24.1 25.9 26.9 26.8 26.6 26.8 27.3 AT 12.1 16.9 17.6 18.4 19.4 21.1 23.7 26.1 27.2 27.6 28.2 28.5 29.0 PL 22.8 13.4 13.6 15.3 18.2 21.2 23.0 24.2 25.9 28.4 31.6 34.3 36.2 PT 13.6 17.3 17.8 18.9 20.1 21.5 23.3 24.9 26.8 28.8 30.1 30.6 30.9 RO 20.1 14.9 14.9 15.6 17.4 19.4 20.3 22.9 25.5 28.5 30.9 34.0 35.0 SI 17.5 15.9 16.6 17.9 20.4 22.9 25.3 27.4 29.1 31.0 32.5 33.4 33.4 SK 24.3 11.9 12.3 13.8 16.4 19.1 21.3 23.0 25.3 28.6 31.6 34.3 36.1 FI 11.4 16.5 17.1 20.1 22.4 24.1 25.5 26.4 26.2 26.4 26.8 27.1 27.8 SE 9.2 17.4 18.2 19.9 20.8 21.6 22.5 23.6 24.3 24.4 24.7 25.5 26.6 UK 8.7 16.0 16.4 17.6 18.3 19.2 20.5 21.9 22.4 22.4 23.0 23.9 24.7 NO 10.8 14.6 15.0 16.7 18.1 19.6 21.0 22.6 23.8 24.1 24.4 24.8 25.4 EU27 13.0 17.0 17.4 18.6 20.1 21.7 23.6 25.4 26.8 27.9 28.8 29.6 30.0 EA16 12.4 17.8 18.3 19.4 20.8 22.4 24.5 26.6 28.1 29.1 29.8 30.1 30.2 EU15 11.4 17.6 18.0 19.2 20.4 21.9 23.9 25.8 27.1 27.8 28.4 28.8 29.0 EU12 20.2 14.5 14.8 16.2 18.5 20.8 22.2 23.8 25.8 28.4 30.9 33.3 34.7 EU25 12.7 17.0 17.5 18.8 20.2 21.8 23.7 25.5 26.9 27.9 28.7 29.4 29.7 EA12 12.2 18.0 18.4 19.5 20.9 22.5 24.6 26.7 28.2 29.1 29.8 30.1 30.1 EU10 20.5 14.1 14.5 16.1 18.6 21.0 22.6 23.9 25.8 28.3 30.9 33.1 34.6
Table A 13 – Very elderly population (80 and over) (as % of total population)
Country Ch. 07-60 2007 2010 2015 2020 2025 2030 2035 2040 2045 2050 2055 2060 BE 5.7 4.6 4.9 5.4 5.6 5.6 6.5 7.4 8.4 9.4 10.0 10.2 10.2 BG 9.4 3.5 3.8 4.4 4.6 4.9 6.1 7.1 8.0 8.7 9.6 11.0 12.8 CZ 10.1 3.3 3.6 3.9 4.1 5.0 6.6 7.9 8.4 8.7 9.3 11.1 13.4 DK 5.9 4.1 4.1 4.2 4.7 5.7 7.1 7.7 8.1 8.9 9.7 10.1 10.0 DE 8.6 4.6 5.1 5.7 7.1 7.9 8.0 8.9 10.3 12.4 14.0 13.8 13.2 EE 7.3 3.5 4.0 4.5 5.2 5.4 5.9 6.8 7.8 8.6 9.0 9.8 10.7 IE 6.9 2.7 2.8 2.9 3.1 3.5 4.3 5.0 5.7 6.5 7.3 8.3 9.6 EL 9.6 3.9 4.6 5.8 6.5 6.5 7.1 7.9 8.9 9.9 11.2 12.4 13.5 ES 10.0 4.5 4.8 5.3 5.4 5.7 6.4 7.2 8.3 9.7 11.3 12.9 14.5 FR 5.9 4.9 5.3 5.9 6.0 6.1 7.3 8.5 9.3 10.0 10.5 10.9 10.8 IT 9.6 5.3 5.8 6.6 7.3 7.7 8.5 9.1 10.0 11.5 13.1 14.4 14.9 CY 5.9 2.8 2.8 3.0 3.4 3.9 4.6 5.3 6.1 6.8 7.3 7.8 8.6 LV 8.5 3.4 3.9 4.5 5.2 5.6 5.9 6.7 7.9 9.2 9.9 10.9 11.9 LT 8.9 3.1 3.6 4.4 4.9 5.3 5.6 6.4 7.8 9.6 10.7 11.5 12.0 LU 5.6 3.3 3.8 4.1 4.3 4.4 5.0 5.8 6.7 7.8 8.6 8.9 8.9 HU 9.0 3.6 3.9 4.4 4.8 5.4 6.2 7.6 8.4 8.5 9.1 10.5 12.6 MT 9.1 2.7 3.3 3.9 4.5 5.2 7.1 8.3 9.3 9.9 9.9 10.4 11.8 NL 7.2 3.7 3.9 4.3 4.7 5.4 6.9 8.0 9.0 10.1 11.1 11.4 10.9 AT 6.9 4.5 4.7 4.9 5.2 6.2 6.7 7.2 8.4 10.1 11.5 11.7 11.4 PL 10.2 2.9 3.3 4.0 4.4 4.5 5.7 7.7 9.4 10.0 10.1 11.0 13.1 PT 8.7 4.1 4.5 5.2 5.8 6.1 6.8 7.6 8.4 9.5 10.5 11.6 12.8 RO 10.4 2.7 3.0 3.6 4.2 4.3 4.9 6.2 7.4 7.7 9.4 11.1 13.1 SI 10.5 3.4 3.9 4.8 5.4 6.0 6.7 8.4 9.9 11.0 12.0 12.7 13.9 SK 10.7 2.5 2.7 3.0 3.2 3.7 4.7 6.4 7.8 8.7 9.3 10.8 13.2 FI 6.6 4.2 4.6 5.1 5.6 6.2 8.2 9.4 10.1 10.6 10.8 10.5 10.8 SE 4.7 5.4 5.3 5.2 5.4 6.3 7.6 8.1 8.4 8.8 9.5 10.0 10.0 UK 4.5 4.5 4.6 4.8 5.0 5.3 6.3 6.7 7.3 8.1 8.9 9.1 9.0 NO 5.3 4.7 4.6 4.4 4.4 5.0 6.3 7.1 7.8 8.4 9.3 9.9 10.0 EU27 7.8 4.3 4.7 5.2 5.7 6.1 6.9 7.9 8.9 10.0 11.0 11.7 12.1 EA16 8.2 4.6 5.0 5.6 6.2 6.6 7.4 8.2 9.3 10.6 11.8 12.5 12.8 EU15 7.3 4.6 5.0 5.5 6.0 6.5 7.2 8.0 8.9 10.2 11.3 11.8 12.0 EU12 9.9 3.0 3.4 4.0 4.4 4.7 5.7 7.2 8.5 9.0 9.7 11.0 12.9 EU25 7.7 4.4 4.7 5.3 5.8 6.2 7.0 7.9 8.9 10.1 11.1 11.7 12.1 EA12 8.1 4.7 5.1 5.7 6.3 6.7 7.4 8.3 9.3 10.7 11.9 12.5 12.8 EU10 9.8 3.0 3.4 4.0 4.4 4.7 5.8 7.5 8.8 9.4 9.8 10.9 12.9Source: Commission services.
Table A 14 - Very elderly population (80 and over) (as % of elderly population)
Country Ch. 07-60 2007 2010 2015 2020 2025 2030 2035 2040 2045 2050 2055 2060 BE 11.9 26.7 28.5 29.5 28.6 26.5 28.2 30.4 33.5 37.0 38.7 39.2 38.6 BG 17.4 20.1 21.6 23.1 22.5 22.7 26.2 28.8 29.9 29.9 30.7 33.0 37.5 CZ 17.5 22.6 23.3 22.1 20.3 23.1 28.9 32.9 31.9 29.8 30.1 34.2 40.1 DK 13.2 26.9 25.1 22.7 23.3 26.8 31.0 31.7 32.8 35.7 39.8 41.4 40.1 DE 17.3 23.3 24.6 26.7 31.1 32.1 28.9 29.4 33.1 39.6 44.1 42.7 40.6 EE 14.6 20.3 23.4 25.7 27.8 26.5 27.0 29.7 32.3 33.9 33.0 32.9 35.0 IE 13.5 24.5 24.8 23.9 23.6 24.2 26.6 28.3 29.3 30.0 30.6 33.3 38.0 EL 21.6 20.9 24.2 29.1 30.7 28.8 29.4 30.0 31.4 32.8 35.6 39.2 42.6 ES 17.7 27.1 28.7 30.7 29.8 28.7 28.8 28.9 30.0 31.9 35.1 39.6 44.8 FR 12.0 29.6 31.7 31.8 29.9 28.1 31.5 34.8 36.9 39.5 40.9 42.1 41.6 IT 18.9 26.7 28.7 30.6 32.3 32.1 32.5 31.8 32.4 35.6 40.2 44.1 45.6 CY 10.5 22.5 22.3 21.9 22.6 23.5 25.5 27.9 30.5 32.2 31.3 31.3 33.0 LV 14.9 19.7 22.6 25.3 28.1 27.8 26.7 28.2 31.1 33.8 33.4 33.1 34.6 LT 14.7 19.9 22.7 26.2 27.9 27.0 25.3 26.2 29.8 34.5 35.9 35.4 34.5 LU 14.1 23.7 26.3 27.4 26.5 25.1 25.5 27.1 30.2 34.2 37.4 38.3 37.8 HU 16.9 22.6 23.7 24.9 24.0 25.3 28.2 32.7 33.7 30.5 31.1 34.2 39.6 MT 16.3 20.2 22.5 21.6 22.4 22.8 29.2 33.4 36.3 36.2 33.9 33.9 36.5 NL 14.6 25.4 25.4 24.1 23.8 24.9 28.8 30.7 33.3 37.8 41.6 42.4 39.9 AT 12.6 26.5 27.0 26.4 26.8 29.2 28.2 27.8 30.8 36.5 40.7 41.0 39.2 PL 14.9 21.3 24.4 25.9 23.9 21.0 24.7 31.7 36.4 35.1 31.8 32.1 36.1 PT 17.8 23.7 25.2 27.8 28.9 28.5 29.1 30.4 31.5 33.1 34.7 37.9 41.4 RO 19.6 17.9 20.3 23.3 24.2 22.2 24.3 27.1 29.1 26.9 30.5 32.6 37.5 SI 20.1 21.3 23.5 27.0 26.5 26.2 26.4 30.5 34.0 35.6 36.8 37.8 41.4 SK 15.3 21.2 22.2 22.0 19.7 19.6 22.3 27.8 30.7 30.4 29.5 31.5 36.5 FI 13.4 25.4 27.2 25.4 25.2 25.8 32.0 35.8 38.7 40.1 40.2 38.6 38.8 SE 6.8 31.0 29.3 26.2 26.0 29.4 33.9 34.4 34.6 36.1 38.5 39.1 37.8 UK 8.2 28.0 28.1 27.0 27.2 27.9 30.5 30.7 32.4 36.3 38.9 38.2 36.3 NO 7.4 31.8 30.5 26.4 24.3 25.5 29.9 31.4 32.9 35.0 38.1 40.0 39.2 EU27 15.2 25.3 26.8 27.8 28.4 28.2 29.4 30.9 33.0 35.7 38.2 39.5 40.5 EA16 16.4 25.8 27.4 28.9 29.9 29.6 30.0 31.0 33.0 36.5 39.7 41.4 42.2 EU15 15.0 26.3 27.6 28.6 29.5 29.5 30.3 31.0 33.0 36.6 39.7 41.1 41.3 EU12 16.6 20.6 22.9 24.4 23.5 22.5 25.6 30.3 33.0 31.7 31.4 32.9 37.2 EU25 15.0 25.7 27.1 28.1 28.7 28.5 29.6 31.1 33.2 36.1 38.6 39.9 40.7 EA12 16.5 25.9 27.5 29.0 30.1 29.8 30.1 31.0 33.1 36.7 39.9 41.6 42.4 EU10 15.6 21.5 23.8 24.8 23.5 22.5 25.8 31.3 34.3 33.2 31.7 33.0 37.2
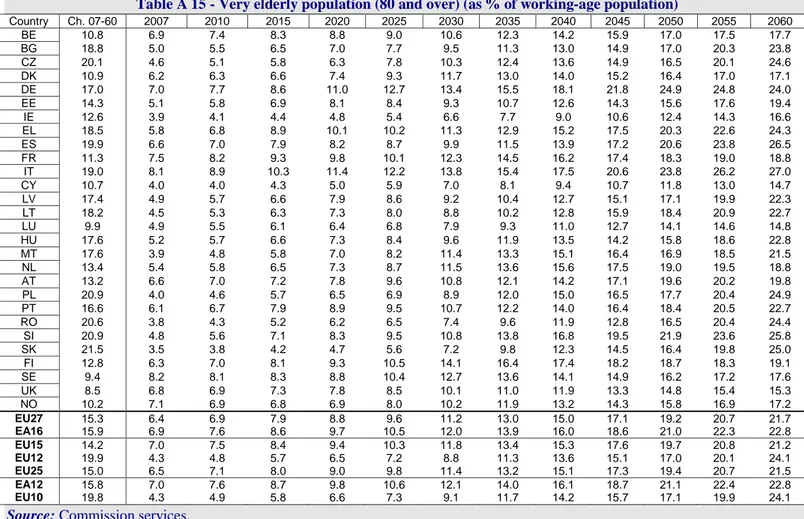
Table A 15 - Very elderly population (80 and over) (as % of working-age population)
Country Ch. 07-60 2007 2010 2015 2020 2025 2030 2035 2040 2045 2050 2055 2060 BE 10.8 6.9 7.4 8.3 8.8 9.0 10.6 12.3 14.2 15.9 17.0 17.5 17.7 BG 18.8 5.0 5.5 6.5 7.0 7.7 9.5 11.3 13.0 14.9 17.0 20.3 23.8 CZ 20.1 4.6 5.1 5.8 6.3 7.8 10.3 12.4 13.6 14.9 16.5 20.1 24.6 DK 10.9 6.2 6.3 6.6 7.4 9.3 11.7 13.0 14.0 15.2 16.4 17.0 17.1 DE 17.0 7.0 7.7 8.6 11.0 12.7 13.4 15.5 18.1 21.8 24.9 24.8 24.0 EE 14.3 5.1 5.8 6.9 8.1 8.4 9.3 10.7 12.6 14.3 15.6 17.6 19.4 IE 12.6 3.9 4.1 4.4 4.8 5.4 6.6 7.7 9.0 10.6 12.4 14.3 16.6 EL 18.5 5.8 6.8 8.9 10.1 10.2 11.3 12.9 15.2 17.5 20.3 22.6 24.3 ES 19.9 6.6 7.0 7.9 8.2 8.7 9.9 11.5 13.9 17.2 20.6 23.8 26.5 FR 11.3 7.5 8.2 9.3 9.8 10.1 12.3 14.5 16.2 17.4 18.3 19.0 18.8 IT 19.0 8.1 8.9 10.3 11.4 12.2 13.8 15.4 17.5 20.6 23.8 26.2 27.0 CY 10.7 4.0 4.0 4.3 5.0 5.9 7.0 8.1 9.4 10.7 11.8 13.0 14.7 LV 17.4 4.9 5.7 6.6 7.9 8.6 9.2 10.4 12.7 15.1 17.1 19.9 22.3 LT 18.2 4.5 5.3 6.3 7.3 8.0 8.8 10.2 12.8 15.9 18.4 20.9 22.7 LU 9.9 4.9 5.5 6.1 6.4 6.8 7.9 9.3 11.0 12.7 14.1 14.6 14.8 HU 17.6 5.2 5.7 6.6 7.3 8.4 9.6 11.9 13.5 14.2 15.8 18.6 22.8 MT 17.6 3.9 4.8 5.8 7.0 8.2 11.4 13.3 15.1 16.4 16.9 18.5 21.5 NL 13.4 5.4 5.8 6.5 7.3 8.7 11.5 13.6 15.6 17.5 19.0 19.5 18.8 AT 13.2 6.6 7.0 7.2 7.8 9.6 10.8 12.1 14.2 17.1 19.6 20.2 19.8 PL 20.9 4.0 4.6 5.7 6.5 6.9 8.9 12.0 15.0 16.5 17.7 20.4 24.9 PT 16.6 6.1 6.7 7.9 8.9 9.5 10.7 12.2 14.0 16.4 18.4 20.5 22.7 RO 20.6 3.8 4.3 5.2 6.2 6.5 7.4 9.6 11.9 12.8 16.5 20.4 24.4 SI 20.9 4.8 5.6 7.1 8.3 9.5 10.8 13.8 16.8 19.5 21.9 23.6 25.8 SK 21.5 3.5 3.8 4.2 4.7 5.6 7.2 9.8 12.3 14.5 16.4 19.8 25.0 FI 12.8 6.3 7.0 8.1 9.3 10.5 14.1 16.4 17.4 18.2 18.7 18.3 19.1 SE 9.4 8.2 8.1 8.3 8.8 10.4 12.7 13.6 14.1 14.9 16.2 17.2 17.6 UK 8.5 6.8 6.9 7.3 7.8 8.5 10.1 11.0 11.9 13.3 14.8 15.4 15.3 NO 10.2 7.1 6.9 6.8 6.9 8.0 10.2 11.9 13.2 14.3 15.8 16.9 17.2 EU27 15.3 6.4 6.9 7.9 8.8 9.6 11.2 13.0 15.0 17.1 19.2 20.7 21.7 EA16 15.9 6.9 7.6 8.6 9.7 10.5 12.0 13.9 16.0 18.6 21.0 22.3 22.8 EU15 14.2 7.0 7.5 8.4 9.4 10.3 11.8 13.4 15.3 17.6 19.7 20.8 21.2 EU12 19.9 4.3 4.8 5.7 6.5 7.2 8.8 11.3 13.6 15.1 17.0 20.1 24.1 EU25 15.0 6.5 7.1 8.0 9.0 9.8 11.4 13.2 15.1 17.3 19.4 20.7 21.5 EA12 15.8 7.0 7.6 8.7 9.8 10.6 12.1 14.0 16.1 18.7 21.1 22.4 22.8 EU10 19.8 4.3 4.9 5.8 6.6 7.3 9.1 11.7 14.2 15.7 17.1 19.9 24.1Source: Commission services.
Table A 16 – Potential GDP (annual growth rate)
Country Avg 07-60 2007 2010 2015 2020 2025 2030 2035 2040 2045 2050 2055 2060 BE 1.8 2.5 2.5 2.3 1.9 1.6 1.6 1.7 1.8 1.7 1.7 1.7 1.7 BG 1.9 6.4 4.0 3.0 2.4 2.0 1.7 1.5 1.4 0.7 0.3 0.7 0.8 CZ 1.8 5.2 4.2 3.0 2.5 1.6 1.4 1.1 0.9 0.9 0.7 0.9 1.1 DK 1.7 2.3 1.7 1.7 1.6 1.8 1.5 1.6 1.7 1.9 1.9 1.7 1.6 DE 1.2 1.4 1.9 1.9 1.5 0.9 1.3 1.1 1.1 1.2 1.0 1.0 1.0 EE 2.1 7.8 5.0 3.2 2.6 2.3 2.2 1.3 1.0 0.7 0.6 0.8 1.2 IE 2.4 5.2 4.1 3.4 2.9 2.6 2.3 2.1 1.8 1.5 1.6 1.8 2.0 EL 1.8 3.8 3.0 2.7 2.9 1.8 1.3 1.1 1.0 1.1 1.2 1.3 1.4 ES 1.9 3.7 2.9 3.1 3.4 2.5 1.8 1.3 0.9 0.8 1.1 1.4 1.6 FR 1.8 2.1 2.0 2.0 1.9 1.8 1.7 1.8 1.8 1.8 1.8 1.8 1.8 IT 1.4 1.5 1.5 2.1 1.9 1.7 1.4 1.1 1.0 1.2 1.3 1.4 1.4 CY 2.8 3.6 3.8 3.8 3.9 3.2 2.9 2.6 2.3 2.0 1.8 1.8 1.8 LV 1.8 8.6 5.0 3.0 2.1 2.0 1.8 1.0 0.7 0.2 -0.1 0.4 1.1 LT 1.8 8.0 5.0 3.6 2.5 1.8 1.5 0.8 0.8 0.5 0.2 0.2 0.4 LU 2.7 4.5 5.0 4.0 2.7 2.3 2.1 2.2 2.2 2.2 2.2 2.0 2.0 HU 1.7 2.9 3.3 2.8 2.4 2.1 2.1 1.5 1.1 1.0 0.8 0.9 1.0 MT 1.7 2.9 2.3 2.7 2.7 1.9 1.7 1.4 1.2 1.0 0.8 0.8 1.0 NL 1.5 2.1 1.9 1.7 1.5 1.3 1.2 1.4 1.5 1.6 1.5 1.4 1.3 AT 1.7 2.2 2.2 1.9 1.9 1.6 1.5 1.6 1.5 1.5 1.5 1.4 1.5 PL 1.7 5.9 4.2 3.1 2.5 2.5 2.0 1.0 0.5 0.3 0.3 0.3 0.5 PT 1.8 1.3 2.0 2.1 2.1 2.1 2.5 2.2 1.8 1.5 1.2 1.3 1.4 RO 2.0 6.4 5.2 3.9 2.9 2.2 1.6 1.8 1.1 0.6 0.3 0.6 0.3 SI 1.6 4.9 3.4 3.2 2.6 1.4 0.8 0.7 0.7 0.7 0.8 1.0 1.1 SK 2.0 6.5 6.2 4.2 3.4 2.3 2.0 0.8 0.5 0.3 0.2 0.3 0.5 FI 1.7 3.4 2.6 1.9 1.7 1.5 1.5 1.6 1.6 1.6 1.5 1.4 1.5 SE 1.9 3.5 2.7 2.2 1.9 1.9 1.7 1.8 1.9 1.8 1.7 1.6 1.7 UK 2.1 2.7 2.7 2.4 2.0 2.0 2.1 2.1 2.1 2.1 1.9 1.8 1.8 NO 2.0 6.0 2.1 2.1 2.0 1.9 1.7 1.7 1.9 1.9 1.9 1.8 1.8 EU27 1.7 2.7 2.5 2.3 2.1 1.8 1.7 1.5 1.4 1.4 1.3 1.4 1.4 EA16 1.6 2.3 2.2 2.2 2.1 1.6 1.6 1.4 1.3 1.3 1.3 1.4 1.4 EU15 1.7 2.3 2.2 2.2 2.0 1.7 1.6 1.5 1.5 1.5 1.5 1.5 1.5 EU12 1.8 5.7 4.4 3.3 2.6 2.2 1.8 1.2 0.8 0.6 0.4 0.6 0.7 EU25 1.7 2.6 2.4 2.3 2.1 1.8 1.7 1.5 1.4 1.4 1.4 1.4 1.5 EA12 1.6 2.2 2.1 2.2 2.0 1.6 1.5 1.4 1.3 1.3 1.4 1.4 1.5 EU10 1.8 5.5 4.2 3.2 2.6 2.2 1.9 1.1 0.7 0.6 0.5 0.6 0.8
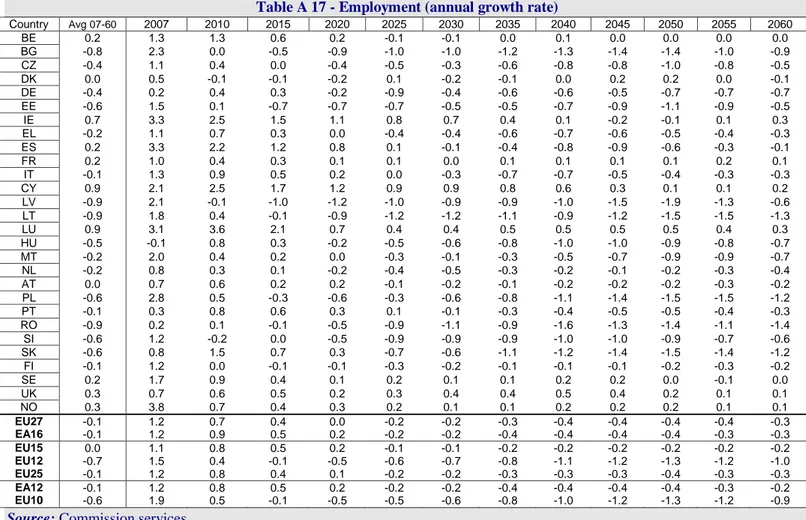
Table A 17 - Employment (annual growth rate)
Country Avg 07-60 2007 2010 2015 2020 2025 2030 2035 2040 2045 2050 2055 2060 BE 0.2 1.3 1.3 0.6 0.2 -0.1 -0.1 0.0 0.1 0.0 0.0 0.0 0.0 BG -0.8 2.3 0.0 -0.5 -0.9 -1.0 -1.0 -1.2 -1.3 -1.4 -1.4 -1.0 -0.9 CZ -0.4 1.1 0.4 0.0 -0.4 -0.5 -0.3 -0.6 -0.8 -0.8 -1.0 -0.8 -0.5 DK 0.0 0.5 -0.1 -0.1 -0.2 0.1 -0.2 -0.1 0.0 0.2 0.2 0.0 -0.1 DE -0.4 0.2 0.4 0.3 -0.2 -0.9 -0.4 -0.6 -0.6 -0.5 -0.7 -0.7 -0.7 EE -0.6 1.5 0.1 -0.7 -0.7 -0.7 -0.5 -0.5 -0.7 -0.9 -1.1 -0.9 -0.5 IE 0.7 3.3 2.5 1.5 1.1 0.8 0.7 0.4 0.1 -0.2 -0.1 0.1 0.3 EL -0.2 1.1 0.7 0.3 0.0 -0.4 -0.4 -0.6 -0.7 -0.6 -0.5 -0.4 -0.3 ES 0.2 3.3 2.2 1.2 0.8 0.1 -0.1 -0.4 -0.8 -0.9 -0.6 -0.3 -0.1 FR 0.2 1.0 0.4 0.3 0.1 0.1 0.0 0.1 0.1 0.1 0.1 0.2 0.1 IT -0.1 1.3 0.9 0.5 0.2 0.0 -0.3 -0.7 -0.7 -0.5 -0.4 -0.3 -0.3 CY 0.9 2.1 2.5 1.7 1.2 0.9 0.9 0.8 0.6 0.3 0.1 0.1 0.2 LV -0.9 2.1 -0.1 -1.0 -1.2 -1.0 -0.9 -0.9 -1.0 -1.5 -1.9 -1.3 -0.6 LT -0.9 1.8 0.4 -0.1 -0.9 -1.2 -1.2 -1.1 -0.9 -1.2 -1.5 -1.5 -1.3 LU 0.9 3.1 3.6 2.1 0.7 0.4 0.4 0.5 0.5 0.5 0.5 0.4 0.3 HU -0.5 -0.1 0.8 0.3 -0.2 -0.5 -0.6 -0.8 -1.0 -1.0 -0.9 -0.8 -0.7 MT -0.2 2.0 0.4 0.2 0.0 -0.3 -0.1 -0.3 -0.5 -0.7 -0.9 -0.9 -0.7 NL -0.2 0.8 0.3 0.1 -0.2 -0.4 -0.5 -0.3 -0.2 -0.1 -0.2 -0.3 -0.4 AT 0.0 0.7 0.6 0.2 0.2 -0.1 -0.2 -0.1 -0.2 -0.2 -0.2 -0.3 -0.2 PL -0.6 2.8 0.5 -0.3 -0.6 -0.3 -0.6 -0.8 -1.1 -1.4 -1.5 -1.5 -1.2 PT -0.1 0.3 0.8 0.6 0.3 0.1 -0.1 -0.3 -0.4 -0.5 -0.5 -0.4 -0.3 RO -0.9 0.2 0.1 -0.1 -0.5 -0.9 -1.1 -0.9 -1.6 -1.3 -1.4 -1.1 -1.4 SI -0.6 1.2 -0.2 0.0 -0.5 -0.9 -0.9 -0.9 -1.0 -1.0 -0.9 -0.7 -0.6 SK -0.6 0.8 1.5 0.7 0.3 -0.7 -0.6 -1.1 -1.2 -1.4 -1.5 -1.4 -1.2 FI -0.1 1.2 0.0 -0.1 -0.1 -0.3 -0.2 -0.1 -0.1 -0.1 -0.2 -0.3 -0.2 SE 0.2 1.7 0.9 0.4 0.1 0.2 0.1 0.1 0.2 0.2 0.0 -0.1 0.0 UK 0.3 0.7 0.6 0.5 0.2 0.3 0.4 0.4 0.5 0.4 0.2 0.1 0.1 NO 0.3 3.8 0.7 0.4 0.3 0.2 0.1 0.1 0.2 0.2 0.2 0.1 0.1 EU27 -0.1 1.2 0.7 0.4 0.0 -0.2 -0.2 -0.3 -0.4 -0.4 -0.4 -0.4 -0.3 EA16 -0.1 1.2 0.9 0.5 0.2 -0.2 -0.2 -0.4 -0.4 -0.4 -0.4 -0.3 -0.3 EU15 0.0 1.1 0.8 0.5 0.2 -0.1 -0.1 -0.2 -0.2 -0.2 -0.2 -0.2 -0.2 EU12 -0.7 1.5 0.4 -0.1 -0.5 -0.6 -0.7 -0.8 -1.1 -1.2 -1.3 -1.2 -1.0 EU25 -0.1 1.2 0.8 0.4 0.1 -0.2 -0.2 -0.3 -0.3 -0.3 -0.4 -0.3 -0.3 EA12 -0.1 1.2 0.8 0.5 0.2 -0.2 -0.2 -0.4 -0.4 -0.4 -0.4 -0.3 -0.2 EU10 -0.6 1.9 0.5 -0.1 -0.5 -0.5 -0.6 -0.8 -1.0 -1.2 -1.3 -1.2 -0.9Source: Commission services.
Table A 18 – Labour input – hours worked (annual growth rate)
Country Avg 07-60 2007 2010 2015 2020 2025 2030 2035 2040 2045 2050 2055 2060 BE 0.2 1.2 1.2 0.6 0.1 -0.1 -0.1 0.0 0.1 0.0 0.0 0.0 0.0 BG -0.8 2.4 0.0 -0.5 -0.9 -1.0 -1.0 -1.2 -1.3 -1.4 -1.4 -1.0 -0.9 CZ -0.4 1.0 0.4 0.0 -0.4 -0.5 -0.3 -0.6 -0.8 -0.8 -1.0 -0.8 -0.5 DK 0.0 0.3 -0.3 -0.2 -0.1 0.1 -0.2 -0.1 0.0 0.2 0.2 0.1 -0.1 DE -0.5 -0.1 0.4 0.2 -0.2 -0.9 -0.4 -0.6 -0.6 -0.5 -0.7 -0.7 -0.7 EE -0.6 1.6 0.1 -0.7 -0.7 -0.7 -0.5 -0.5 -0.7 -1.0 -1.1 -0.9 -0.5 IE 0.7 2.9 2.5 1.5 1.0 0.8 0.7 0.4 0.1 -0.1 -0.1 0.1 0.3 EL -0.2 1.3 0.7 0.3 0.0 -0.4 -0.5 -0.6 -0.7 -0.6 -0.5 -0.4 -0.3 ES 0.1 2.7 2.1 1.2 0.8 0.1 -0.1 -0.4 -0.8 -0.9 -0.6 -0.3 -0.1 FR 0.1 0.6 0.4 0.3 0.1 0.1 0.0 0.1 0.1 0.1 0.1 0.2 0.1 IT -0.1 1.2 0.9 0.5 0.2 0.0 -0.3 -0.6 -0.6 -0.5 -0.4 -0.3 -0.3 CY 0.8 1.9 2.5 1.7 1.1 0.9 0.8 0.8 0.6 0.3 0.1 0.1 0.2 LV -0.9 2.0 -0.1 -1.0 -1.2 -1.0 -0.9 -0.9 -1.0 -1.5 -1.9 -1.3 -0.6 LT -0.8 2.4 0.4 -0.1 -0.9 -1.2 -1.2 -1.1 -0.9 -1.2 -1.5 -1.5 -1.3 LU 0.9 2.7 3.6 2.1 0.7 0.4 0.4 0.5 0.5 0.5 0.5 0.4 0.3 HU -0.5 -0.3 0.8 0.3 -0.2 -0.5 -0.6 -0.8 -1.0 -0.9 -0.9 -0.8 -0.7 MT -0.2 1.4 0.4 0.2 0.0 -0.2 -0.1 -0.3 -0.5 -0.7 -0.9 -0.9 -0.7 NL -0.2 0.5 0.2 0.0 -0.3 -0.4 -0.5 -0.3 -0.2 -0.1 -0.2 -0.3 -0.4 AT 0.0 0.6 0.6 0.2 0.2 -0.1 -0.2 -0.1 -0.2 -0.2 -0.2 -0.3 -0.2 PL -0.7 2.8 0.4 -0.3 -0.6 -0.4 -0.7 -0.9 -1.2 -1.4 -1.4 -1.4 -1.2 PT -0.1 0.2 0.8 0.6 0.3 0.1 -0.1 -0.3 -0.4 -0.5 -0.5 -0.4 -0.3 RO -0.8 1.0 0.1 -0.1 -0.5 -0.9 -1.1 -0.9 -1.6 -1.3 -1.4 -1.1 -1.4 SI -0.6 1.2 -0.3 0.0 -0.5 -0.9 -0.9 -1.0 -1.0 -1.0 -0.9 -0.7 -0.6 SK -0.6 1.0 1.5 0.7 0.3 -0.7 -0.7 -1.1 -1.2 -1.4 -1.5 -1.4 -1.2 FI -0.1 0.8 0.0 -0.1 -0.1 -0.3 -0.2 -0.1 -0.1 -0.1 -0.2 -0.3 -0.2 SE 0.2 1.6 0.9 0.4 0.1 0.2 0.0 0.1 0.2 0.1 0.0 -0.1 0.0 UK 0.3 0.2 0.6 0.5 0.2 0.3 0.4 0.4 0.5 0.4 0.2 0.1 0.1 NO 0.3 3.9 0.6 0.4 0.3 0.2 0.0 0.0 0.2 0.2 0.2 0.1 0.1 EU27 -0.1 1.0 0.7 0.3 0.0 -0.2 -0.2 -0.4 -0.4 -0.4 -0.4 -0.4 -0.3 EA16 -0.1 0.9 0.9 0.5 0.2 -0.2 -0.2 -0.4 -0.4 -0.4 -0.4 -0.3 -0.3 EU15 0.0 0.8 0.8 0.5 0.2 -0.1 -0.1 -0.2 -0.2 -0.2 -0.2 -0.2 -0.2 EU12 -0.7 1.7 0.4 -0.1 -0.5 -0.6 -0.7 -0.9 -1.2 -1.2 -1.3 -1.1 -1.0 EU25 -0.1 1.0 0.7 0.4 0.1 -0.2 -0.2 -0.3 -0.4 -0.4 -0.4 -0.3 -0.3 EA12 -0.1 0.9 0.8 0.5 0.2 -0.2 -0.2 -0.4 -0.4 -0.4 -0.4 -0.3 -0.2 EU10 -0.6 1.9 0.5 -0.1 -0.5 -0.5 -0.6 -0.8 -1.0 -1.2 -1.2 -1.2 -0.9
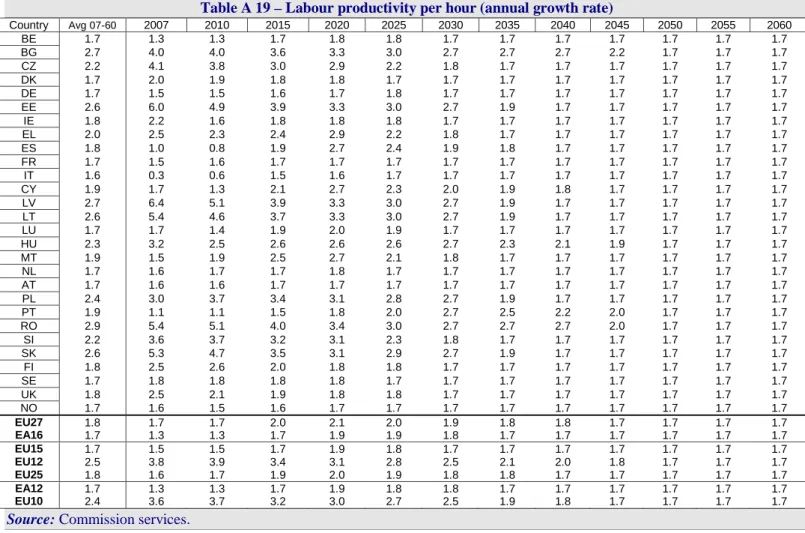
Table A 19 – Labour productivity per hour (annual growth rate)
Country Avg 07-60 2007 2010 2015 2020 2025 2030 2035 2040 2045 2050 2055 2060 BE 1.7 1.3 1.3 1.7 1.8 1.8 1.7 1.7 1.7 1.7 1.7 1.7 1.7 BG 2.7 4.0 4.0 3.6 3.3 3.0 2.7 2.7 2.7 2.2 1.7 1.7 1.7 CZ 2.2 4.1 3.8 3.0 2.9 2.2 1.8 1.7 1.7 1.7 1.7 1.7 1.7 DK 1.7 2.0 1.9 1.8 1.8 1.7 1.7 1.7 1.7 1.7 1.7 1.7 1.7 DE 1.7 1.5 1.5 1.6 1.7 1.8 1.7 1.7 1.7 1.7 1.7 1.7 1.7 EE 2.6 6.0 4.9 3.9 3.3 3.0 2.7 1.9 1.7 1.7 1.7 1.7 1.7 IE 1.8 2.2 1.6 1.8 1.8 1.8 1.7 1.7 1.7 1.7 1.7 1.7 1.7 EL 2.0 2.5 2.3 2.4 2.9 2.2 1.8 1.7 1.7 1.7 1.7 1.7 1.7 ES 1.8 1.0 0.8 1.9 2.7 2.4 1.9 1.8 1.7 1.7 1.7 1.7 1.7 FR 1.7 1.5 1.6 1.7 1.7 1.7 1.7 1.7 1.7 1.7 1.7 1.7 1.7 IT 1.6 0.3 0.6 1.5 1.6 1.7 1.7 1.7 1.7 1.7 1.7 1.7 1.7 CY 1.9 1.7 1.3 2.1 2.7 2.3 2.0 1.9 1.8 1.7 1.7 1.7 1.7 LV 2.7 6.4 5.1 3.9 3.3 3.0 2.7 1.9 1.7 1.7 1.7 1.7 1.7 LT 2.6 5.4 4.6 3.7 3.3 3.0 2.7 1.9 1.7 1.7 1.7 1.7 1.7 LU 1.7 1.7 1.4 1.9 2.0 1.9 1.7 1.7 1.7 1.7 1.7 1.7 1.7 HU 2.3 3.2 2.5 2.6 2.6 2.6 2.7 2.3 2.1 1.9 1.7 1.7 1.7 MT 1.9 1.5 1.9 2.5 2.7 2.1 1.8 1.7 1.7 1.7 1.7 1.7 1.7 NL 1.7 1.6 1.7 1.7 1.8 1.7 1.7 1.7 1.7 1.7 1.7 1.7 1.7 AT 1.7 1.6 1.6 1.7 1.7 1.7 1.7 1.7 1.7 1.7 1.7 1.7 1.7 PL 2.4 3.0 3.7 3.4 3.1 2.8 2.7 1.9 1.7 1.7 1.7 1.7 1.7 PT 1.9 1.1 1.1 1.5 1.8 2.0 2.7 2.5 2.2 2.0 1.7 1.7 1.7 RO 2.9 5.4 5.1 4.0 3.4 3.0 2.7 2.7 2.7 2.0 1.7 1.7 1.7 SI 2.2 3.6 3.7 3.2 3.1 2.3 1.8 1.7 1.7 1.7 1.7 1.7 1.7 SK 2.6 5.3 4.7 3.5 3.1 2.9 2.7 1.9 1.7 1.7 1.7 1.7 1.7 FI 1.8 2.5 2.6 2.0 1.8 1.8 1.7 1.7 1.7 1.7 1.7 1.7 1.7 SE 1.7 1.8 1.8 1.8 1.8 1.7 1.7 1.7 1.7 1.7 1.7 1.7 1.7 UK 1.8 2.5 2.1 1.9 1.8 1.8 1.7 1.7 1.7 1.7 1.7 1.7 1.7 NO 1.7 1.6 1.5 1.6 1.7 1.7 1.7 1.7 1.7 1.7 1.7 1.7 1.7 EU27 1.8 1.7 1.7 2.0 2.1 2.0 1.9 1.8 1.8 1.7 1.7 1.7 1.7 EA16 1.7 1.3 1.3 1.7 1.9 1.9 1.8 1.7 1.7 1.7 1.7 1.7 1.7 EU15 1.7 1.5 1.5 1.7 1.9 1.8 1.7 1.7 1.7 1.7 1.7 1.7 1.7 EU12 2.5 3.8 3.9 3.4 3.1 2.8 2.5 2.1 2.0 1.8 1.7 1.7 1.7 EU25 1.8 1.6 1.7 1.9 2.0 1.9 1.8 1.8 1.7 1.7 1.7 1.7 1.7 EA12 1.7 1.3 1.3 1.7 1.9 1.8 1.8 1.7 1.7 1.7 1.7 1.7 1.7 EU10 2.4 3.6 3.7 3.2 3.0 2.7 2.5 1.9 1.8 1.7 1.7 1.7 1.7Source: Commission services.
Table A 20 - TFP (annual growth rate)
Country Avg 07-60 2007 2010 2015 2020 2025 2030 2035 2040 2045 2050 2055 2060 BE 1.1 0.8 1.0 1.1 1.1 1.1 1.1 1.1 1.1 1.1 1.1 1.1 1.1 BG 1.5 1.2 0.9 1.5 1.7 1.7 1.7 1.7 1.7 1.4 1.1 1.1 1.1 CZ 1.4 3.1 2.6 1.8 1.8 1.3 1.2 1.1 1.1 1.1 1.1 1.1 1.1 DK 1.1 1.0 1.1 1.1 1.1 1.1 1.1 1.1 1.1 1.1 1.1 1.1 1.1 DE 1.1 1.0 1.1 1.1 1.1 1.1 1.1 1.1 1.1 1.1 1.1 1.1 1.1 EE 1.5 2.7 2.2 1.8 1.8 1.8 1.8 1.2 1.1 1.1 1.1 1.1 1.1 IE 1.1 1.4 1.2 1.1 1.1 1.1 1.1 1.1 1.1 1.1 1.1 1.1 1.1 EL 1.2 1.3 1.1 1.3 1.7 1.3 1.2 1.1 1.1 1.1 1.1 1.1 1.1 ES 1.1 0.3 0.3 1.1 1.7 1.5 1.3 1.2 1.1 1.1 1.1 1.1 1.1 FR 1.1 0.9 0.9 1.1 1.1 1.1 1.1 1.1 1.1 1.1 1.1 1.1 1.1 IT 1.0 0.1 0.4 1.1 1.1 1.1 1.1 1.1 1.1 1.1 1.1 1.1 1.1 CY 1.2 0.7 0.7 1.3 1.7 1.5 1.3 1.2 1.2 1.1 1.1 1.1 1.1 LV 1.5 3.1 2.6 1.9 1.8 1.8 1.8 1.2 1.1 1.1 1.1 1.1 1.1 LT 1.5 2.8 2.3 1.8 1.8 1.8 1.8 1.2 1.1 1.1 1.1 1.1 1.1 LU 1.1 0.8 1.0 1.1 1.1 1.1 1.1 1.1 1.1 1.1 1.1 1.1 1.1 HU 1.4 1.5 1.3 1.4 1.5 1.6 1.7 1.5 1.3 1.2 1.1 1.1 1.1 MT 1.2 1.0 1.1 1.6 1.7 1.3 1.2 1.1 1.1 1.1 1.1 1.1 1.1 NL 1.1 1.1 1.1 1.1 1.1 1.1 1.1 1.1 1.1 1.1 1.1 1.1 1.1 AT 1.1 1.0 1.1 1.1 1.1 1.1 1.1 1.1 1.1 1.1 1.1 1.1 1.1 PL 1.4 1.7 1.5 1.6 1.7 1.7 1.7 1.2 1.1 1.1 1.1 1.1 1.1 PT 1.2 0.5 0.8 1.0 1.2 1.3 1.7 1.6 1.4 1.3 1.1 1.1 1.1 RO 1.6 2.5 2.2 1.9 1.8 1.8 1.8 1.8 1.8 1.3 1.1 1.1 1.1 SI 1.3 1.5 1.5 1.6 1.7 1.3 1.2 1.1 1.1 1.1 1.1 1.1 1.1 SK 1.6 3.5 3.2 2.0 1.8 1.8 1.8 1.2 1.1 1.1 1.1 1.1 1.1 FI 1.2 2.0 1.8 1.2 1.1 1.1 1.1 1.1 1.1 1.1 1.1 1.1 1.1 SE 1.1 1.6 1.3 1.1 1.1 1.1 1.1 1.1 1.1 1.1 1.1 1.1 1.1 UK 1.1 1.4 1.3 1.1 1.1 1.1 1.1 1.1 1.1 1.1 1.1 1.1 1.1 NO 1.1 2.1 1.0 1.1 1.1 1.1 1.1 1.1 1.1 1.1 1.1 1.1 1.1 EU27 1.1 1.0 1.0 1.2 1.3 1.2 1.2 1.1 1.1 1.1 1.1 1.1 1.1 EA16 1.1 0.8 0.9 1.1 1.2 1.2 1.1 1.1 1.1 1.1 1.1 1.1 1.1 EU15 1.1 0.9 0.9 1.1 1.2 1.2 1.1 1.1 1.1 1.1 1.1 1.1 1.1 EU12 1.4 2.1 1.9 1.7 1.7 1.6 1.6 1.3 1.3 1.2 1.1 1.1 1.1 EU25 1.1 1.0 1.0 1.2 1.2 1.2 1.2 1.1 1.1 1.1 1.1 1.1 1.1 EA12 1.1 0.7 0.8 1.1 1.2 1.2 1.1 1.1 1.1 1.1 1.1 1.1 1.1 EU10 1.4 2.1 1.9 1.7 1.7 1.6 1.6 1.2 1.1 1.1 1.1 1.1 1.1
Table A 21 – Capital deepening (contribution to labour productivity growth)
Country Avg 07-60 2007 2010 2015 2020 2025 2030 2035 2040 2045 2050 2055 2060 BE 0.6 0.5 0.4 0.6 0.7 0.7 0.6 0.6 0.6 0.6 0.6 0.6 0.6 BG 1.3 2.7 3.1 2.1 1.6 1.3 1.0 1.0 1.0 0.8 0.6 0.6 0.6 CZ 0.8 1.0 1.3 1.2 1.2 0.9 0.6 0.6 0.6 0.6 0.6 0.6 0.6 DK 0.6 0.9 0.8 0.7 0.7 0.6 0.6 0.6 0.6 0.6 0.6 0.6 0.6 DE 0.6 0.6 0.4 0.5 0.6 0.7 0.6 0.6 0.6 0.6 0.6 0.6 0.6 EE 1.2 3.3 2.7 2.1 1.6 1.2 0.9 0.7 0.6 0.6 0.6 0.6 0.6 IE 0.6 0.8 0.5 0.7 0.7 0.7 0.6 0.6 0.6 0.6 0.6 0.6 0.6 EL 0.8 1.2 1.3 1.1 1.1 0.9 0.6 0.6 0.6 0.6 0.6 0.6 0.6 ES 0.7 0.8 0.5 0.7 0.9 0.9 0.7 0.6 0.6 0.6 0.6 0.6 0.6 FR 0.6 0.7 0.6 0.6 0.6 0.6 0.6 0.6 0.6 0.6 0.6 0.6 0.6 IT 0.5 0.2 0.2 0.4 0.5 0.6 0.6 0.6 0.6 0.6 0.6 0.6 0.6 CY 0.7 1.0 0.6 0.8 1.0 0.9 0.7 0.6 0.6 0.6 0.6 0.6 0.6 LV 1.1 3.3 2.5 2.0 1.6 1.2 1.0 0.7 0.6 0.6 0.6 0.6 0.6 LT 1.1 2.6 2.4 1.9 1.6 1.3 1.0 0.7 0.6 0.6 0.6 0.6 0.6 LU 0.7 0.9 0.4 0.8 0.9 0.8 0.6 0.6 0.6 0.6 0.6 0.6 0.6 HU 0.9 1.8 1.2 1.1 1.1 1.0 0.9 0.8 0.7 0.7 0.6 0.6 0.6 MT 0.7 0.5 0.8 0.9 0.9 0.8 0.6 0.6 0.6 0.6 0.6 0.6 0.6 NL 0.6 0.6 0.6 0.6 0.7 0.6 0.6 0.6 0.6 0.6 0.6 0.6 0.6 AT 0.6 0.6 0.5 0.6 0.6 0.6 0.6 0.6 0.6 0.6 0.6 0.6 0.6 PL 1.0 1.3 2.2 1.8 1.4 1.1 0.9 0.7 0.6 0.6 0.6 0.6 0.6 PT 0.7 0.6 0.4 0.5 0.6 0.7 0.9 0.9 0.8 0.7 0.6 0.6 0.6 RO 1.2 2.9 2.9 2.1 1.6 1.3 1.0 1.0 1.0 0.7 0.6 0.6 0.6 SI 1.0 2.1 2.2 1.5 1.4 1.0 0.6 0.6 0.6 0.6 0.6 0.6 0.6 SK 1.0 1.8 1.5 1.5 1.3 1.2 0.9 0.7 0.6 0.6 0.6 0.6 0.6 FI 0.6 0.5 0.8 0.8 0.7 0.7 0.6 0.6 0.6 0.6 0.6 0.6 0.6 SE 0.6 0.3 0.5 0.7 0.7 0.6 0.6 0.6 0.6 0.6 0.6 0.6 0.6 UK 0.7 1.1 0.8 0.8 0.7 0.7 0.6 0.6 0.6 0.6 0.6 0.6 0.6 NO 0.6 -0.5 0.5 0.5 0.6 0.6 0.6 0.6 0.6 0.6 0.6 0.6 0.6 EU27 0.7 0.7 0.7 0.8 0.8 0.7 0.7 0.6 0.6 0.6 0.6 0.6 0.6 EA16 0.6 0.6 0.5 0.6 0.7 0.7 0.6 0.6 0.6 0.6 0.6 0.6 0.6 EU15 0.6 0.6 0.5 0.6 0.7 0.7 0.6 0.6 0.6 0.6 0.6 0.6 0.6 EU12 1.0 1.7 2.0 1.7 1.4 1.1 0.9 0.7 0.7 0.6 0.6 0.6 0.6 EU25 0.7 0.7 0.7 0.7 0.8 0.7 0.6 0.6 0.6 0.6 0.6 0.6 0.6 EA12 0.6 0.5 0.5 0.6 0.7 0.7 0.6 0.6 0.6 0.6 0.6 0.6 0.6 EU10 1.0 1.4 1.8 1.6 1.3 1.1 0.9 0.7 0.6 0.6 0.6 0.6 0.6Source: Commission services.
Table A 22 – GDP per capita (annual growth rate)
Country Avg 07-60 2007 2010 2015 2020 2025 2030 2035 2040 2045 2050 2055 2060 BE 1.5 1.8 1.9 1.8 1.5 1.2 1.3 1.4 1.6 1.6 1.6 1.6 1.6 BG 2.5 7.0 4.6 3.5 2.9 2.7 2.4 2.2 2.0 1.4 1.0 1.4 1.6 CZ 1.9 4.8 4.0 2.9 2.5 1.8 1.7 1.4 1.1 1.1 1.1 1.3 1.6 DK 1.6 1.9 1.4 1.4 1.4 1.5 1.2 1.5 1.6 1.9 1.9 1.7 1.5 DE 1.5 1.6 1.9 1.9 1.6 1.0 1.5 1.4 1.5 1.6 1.5 1.5 1.5 EE 2.4 8.0 5.2 3.4 2.8 2.6 2.6 1.7 1.4 1.1 1.0 1.2 1.7 IE 1.5 2.6 1.9 1.7 1.7 1.7 1.7 1.5 1.3 1.0 1.1 1.4 1.7 EL 1.8 3.4 2.6 2.5 2.8 1.8 1.3 1.1 1.1 1.1 1.4 1.6 1.8 ES 1.6 2.1 1.5 2.1 2.9 2.2 1.7 1.2 0.8 0.8 1.2 1.6 1.9 FR 1.5 1.5 1.4 1.5 1.5 1.4 1.4 1.5 1.6 1.6 1.7 1.7 1.7 IT 1.4 0.9 1.1 1.8 1.7 1.6 1.3 1.0 1.1 1.3 1.5 1.7 1.8 CY 1.7 2.0 2.1 2.2 2.4 2.0 1.8 1.7 1.6 1.3 1.2 1.2 1.4 LV 2.4 9.2 5.5 3.4 2.6 2.5 2.5 1.6 1.3 0.8 0.5 1.1 1.9 LT 2.3 8.6 5.5 3.9 2.8 2.2 2.0 1.4 1.4 1.1 0.9 0.9 1.2 LU 1.8 2.9 3.8 2.9 1.6 1.3 1.2 1.3 1.5 1.6 1.6 1.6 1.5 HU 2.0 4.0 3.4 2.9 2.6 2.4 2.4 1.8 1.4 1.3 1.1 1.3 1.5 MT 1.7 2.2 1.9 2.4 2.4 1.7 1.7 1.6 1.4 1.2 1.1 1.0 1.3 NL 1.5 2.0 1.6 1.5 1.3 1.1 1.1 1.4 1.6 1.8 1.7 1.6 1.5 AT 1.5 1.8 1.8 1.6 1.6 1.3 1.2 1.4 1.5 1.5 1.5 1.5 1.6 PL 2.1 6.7 4.2 3.1 2.6 2.7 2.4 1.5 1.1 0.9 0.9 0.9 1.3 PT 1.7 1.0 1.5 1.7 1.8 1.9 2.4 2.1 1.7 1.5 1.3 1.5 1.6 RO 2.5 7.5 5.4 4.1 3.2 2.5 2.1 2.2 1.6 1.2 0.9 1.3 1.2 SI 1.8 4.5 3.1 3.0 2.6 1.6 1.1 1.1 1.1 1.1 1.3 1.5 1.7 SK 2.3 6.5 6.1 4.1 3.4 2.4 2.3 1.2 1.0 0.8 0.8 1.0 1.3 FI 1.7 3.0 2.2 1.6 1.5 1.3 1.4 1.7 1.7 1.7 1.6 1.5 1.6 SE 1.6 2.8 2.0 1.6 1.4 1.4 1.4 1.6 1.7 1.6 1.5 1.4 1.5 UK 1.6 1.2 2.1 1.8 1.4 1.5 1.6 1.7 1.8 1.8 1.6 1.5 1.5 NO 1.5 5.1 1.3 1.3 1.3 1.2 1.2 1.3 1.5 1.6 1.6 1.5 1.5 EU27 1.7 2.2 2.1 2.0 1.9 1.6 1.6 1.5 1.4 1.5 1.5 1.6 1.7 EA16 1.5 1.7 1.7 1.9 1.8 1.5 1.5 1.3 1.3 1.4 1.5 1.6 1.7 EU15 1.6 1.6 1.7 1.8 1.7 1.5 1.5 1.4 1.4 1.5 1.5 1.6 1.7 EU12 2.2 6.1 4.4 3.3 2.8 2.5 2.2 1.6 1.3 1.1 0.9 1.2 1.4 EU25 1.6 2.0 2.0 2.0 1.8 1.6 1.6 1.4 1.4 1.5 1.5 1.6 1.7 EA12 1.5 1.6 1.6 1.8 1.8 1.5 1.5 1.3 1.3 1.4 1.5 1.6 1.7 EU10 2.1 5.7 4.2 3.2 2.7 2.4 2.2 1.5 1.2 1.0 0.9 1.1 1.4