STATISTICAL ANNEX – CROSS-COUNTRY TABLES
STATISTICAL ANNEX
LIST OF TABLES
Main demographic and macroeconomic assumptions
Table A 1 - Fertility rate ...294
Table A 2 - Life expectancy at birth - Men ...294
Table A 3 - Life expectancy at birth - Women ...295
Table A 4 - Life expectancy at 65 - Men...295
Table A 5 - Life expectancy at 65 - Women...296
Table A 6 - Net migration (thousands) ...296
Table A 7 - Net migration as % of population...297
Table A 8 - Population (millions) ...297
Table A 9 - Children population (0-14) as % of total population...298
Table A 10 - Prime age population (25-54) as % of total population...298
Table A 11 - Working age population (15-64) as % of total population ...299
Table A 12 - Elderly population (65 and over) as % of total population ...299
Table A 13 - Very elderly population (80 and over) as % of total population ...300
Table A 14 - Very elderly population (80 and over) as % of elderly population ...300
Table A 15 - Very elderly population (80 and over) as % of working age population ...301
Table A 16 - Potential GDP (growth rate)...301
Table A 17 - Employment (growth rate) ...302
Table A 18 - Labour input : hours worked (growth rate) ...302
Table A 19 - Labour productivity per hour (growth rate)...303
Table A 20 - TFP (growth rate) ...303
Table A 21 - Capital deepening (contribution to labour productivity growth)...304
Table A 22 - GDP per capita (growth rate) ...304
Table A 25 - Working age population (15-64) (thousands)...306
Table A 26 - Working age population growth (15-64)...306
Table A 27 - Working age population (20-64) (thousands)...307
Table A 28 - Working age population growth (20-64)...307
Table A 29 - Labour force 15-64 (thousands) ...308
Table A 30 - Labour force 20-64 (thousands) ...308
Table A 31 - Participation rate (20-64)...309
Table A 32 - Participation rate (15-64)...309
Table A 33 - Participation rate (15-24)...310
Table A 34 - Participation rate (25-54)...310
Table A 35 - Participation rate (55-64)...311
Table A 36 - Participation rate (20-64) - Women...311
Table A 37 - Participation rate (15-64) - Women...312
Table A 38 - Participation rate (15-24) - Women...312
Table A 39 - Participation rate (25-54) - Women...313
Table A 40 - Participation rate (55-64) - Women...313
Table A 41 - Participation rate (20-64) - Men ...314
Table A 42 - Participation rate (15-64) - Men ...314
Table A 43 - Participation rate (15-24) - Men ...315
Table A 44 - Participation rate (25-54) - Men ...315
Table A 45 - Participation rate (55-64) - Men ...316
Table A 46 - Average effective exit age (Total)...316
Table A 47 - Average effective exit age (Men) ...317
Table A 48 - Average effective exit age (Women)...317
Table A 49 - Employment rate (15-64) ...318
Table A 52 - Unemployment rate (15-64) ...319
Table A 53 - Unemployment rate (20-64) ...320
Table A 54 - Unemployment rate (15-74) ...320
Table A 55 - Employment (20-64) (millions)...321
Table A 56 - Employment (15-64) (millions)...321
Table A 57 - Share of young (15-24) in employment (15-64)...322
Table A 58 - Share of prime-age (25-54) in employment (15-64) ...322
Table A 59 - Share of older (55-64) in employment (15-64) ...323
Table A 60 - Share of older population (55-64) ...323
Table A 61 - Old-age dependency ratio (20-64)...324
Table A 62 - Total dependency ratio (20-64) ...324
Table A 63 - Total economic dependency ratio (20-74)...325
Table A 64 - Economic old-age dependency ratio (20-64) ...325
Table A 65 - Economic old-age dependency ratio (20-74) ...326
Pension expenditure projections
Table A 66 - Public pensions, gross as % of GDP ...328
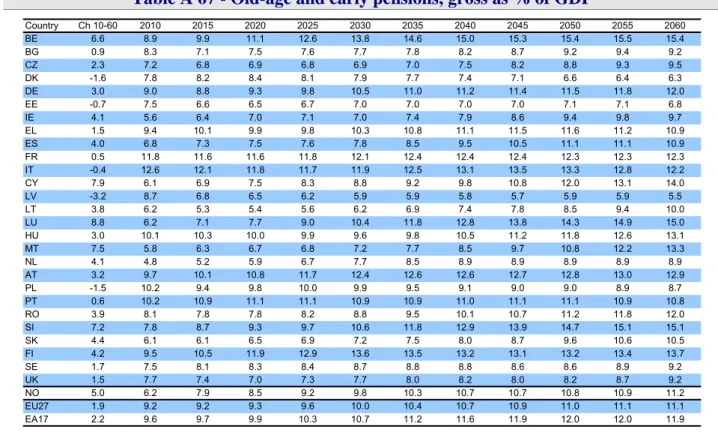
Table A 67 - Old-age and early pensions, gross as % of GDP ...328
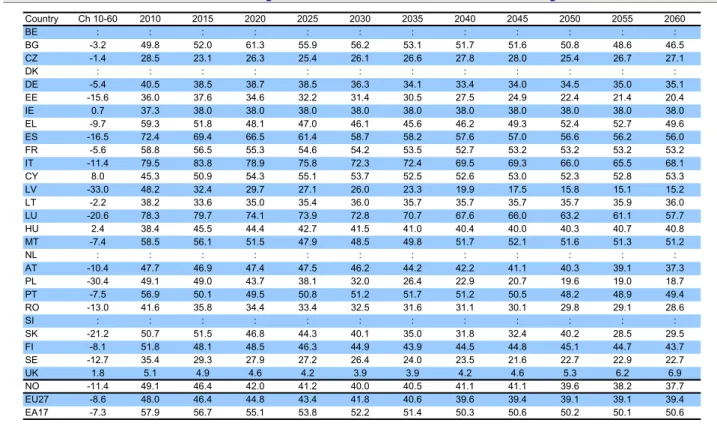
Table A 68 - Earnings-related pensions, gross as % of GDP ...329
Table A 69 - Disability pensions, gross as % of GDP...329
Table A 70 - Survivors pensions, gross as % of GDP ...330
Table A 71 - Occupational pensions, gross as % of GDP ...330
Table A 72 - Private pensions, gross as % of GDP ...331
Table A 73 - New pensions, gross as % of GDP ...331
Table A 74 - Public pensions, net as % of GDP ...332
Table A 75 - Public pensions, contributions as % of GDP...332
Table A 78 - Pensioners (Public pensions, 1000 persons)...334
Table A 79 - Pensioners aged 65+ (1000 persons) ...334
Table A 80 - Share of pensioners below age 65 as % of all pensioners ...335
Table A 81 - Benefit ratio (Public pensions) ...335
Table A 82 - Gross replacement rate at retirement (Public pensions) ...336
Table A 83 - Average accrual rates (new pensions, earnings related)...336
Table A 84 - Average contributory period (new pensions, earnings related)...337
Table A 85 - Contributors (Public pensions, in 1000 persons)...337
Table A 86 - Support ratio (contributors/100 pensioners, Public pensions)...338
Table A 87 - Public pensions, gross as % of GDP - Higher life expectancy scenario ...338
Table A 88 - Public pensions, gross as % of GDP - Higher labour productivity scenario...339
Table A 89 - Public pensions, gross as % of GDP - Lower migration scenario...339
Table A 90 - Public pensions, gross as % of GDP - Higher employment rate (1 p.p) scenario ....340
Table A 91 - Public pensions, gross as % of GDP - Higher older workers employment rate
scenario ...340
Table A 92 - Public pensions, gross as % of GDP (p.p. ch. from 2010) ...341
Table A 93 - Public pensions, gross as % of GDP (p.p. ch. from 2010 due to dependency ratio) 341
Table A 94 - Public pensions, gross as % of GDP (p.p. ch. from 2010 due to coverage ratio)...342
Table A 95 - Public pensions, gross as % of GDP (p.p. ch. from 2010 due to employment effect)
...342
Table A 96 - Public pensions, gross as % of GDP (p.p. ch. from 2010 due to benefit ratio)...343
Table A 97 - Public pensions, gross as % of GDP (p.p. ch. from 2010 due to labour intensity) ..343
Table A 98 - Public pensions, gross as % of GDP (p.p. ch. from 2010 due to interaction effect
(residual))...344
Health care projections
Table A 99 - Health care spending as % of GDP - AWG reference scenario ...346
Table A 100 - Health care spending as % of GDP - Demographic scenario...346
Table A 102 - Health care spending as % of GDP - Constant health scenario...347
Table A 103 - Health care spending as % of GDP - Death-related cost scenario ...348
Table A 104 - Health care spending as % of GDP - Income elasticity scenario ...348
Table A 105 - Health care spending as % of GDP - EU27 Cost convergence scenario...349
Table A 106 - Health care spending as % of GDP - Labour intensity scenario ...349
Table A 107 - Health care spending as % of GDP - Sector-specific composite indexation scenario
...350
Table A 108 - Health care spending as % of GDP - Non-demographic determinants scenario....350
Table A 109 - Health care spending as % of GDP – AWG risk scenario ...351
Long-term care projections
Table A 110 - Long-term care spending as % of GDP - AWG reference scenario...354
Table A 111 - Long-term care spending as % of GDP - Demographic scenario ...354
Table A 112 - Long-term care spending as % of GDP - High Life expectancy scenario...355
Table A 113 - Long-term care spending as % of GDP - Base case scenario...355
Table A 114 - Long-term care spending as % of GDP - Constant disability scenario ...356
Table A 115 - Long-term care spending as % of GDP - Shift 1% of dependents to formal scenario
...356
Table A 116 - Long-term care spending as % of GDP - Coverage convergence scenario...357
Table A 117 - Long-term care spending as % of GDP - Cost convergence scenario...357
Table A 118 - Long-term care spending as % of GDP – AWG risk scenario ...358
Table A 119 - Number of dependent people (thousands) - AWG reference scenario...358
Table A 120 - Number of dependents receiving formal care (services in kind) - AWG reference
scenario ...359
Table A 121 - Number of dependents relying on cash benefits or informal care - AWG reference
scenario ...359
Table A 122 - Number of dependent people (thousands) – Base case scenario...360
Table A 123 - Number of dependents receiving formal care (services in kind) - Base case scenario
...360
Table A 124 - Number of dependents relying on cash benefits or informal care - Base case
Table A 125 - Number of dependent people (thousands) - Constant disability scenario ...361
Table A 126 - Number of dependents receiving formal care (services in kind) - Constant disability
scenario ...361
Table A 127 - Number of dependents relying on cash benefits or informal care - Constant
disability scenario ...362
Table A 128 - Number of dependent people (thousands) - Shift 1% of dependents to formal
scenario ...363
Table A 129 - Number of dependents receiving formal care (services in kind) - Shift 1% of
dependents to formal scenario ...363
Table A 130 - Number of dependents relying on cash benefits or informal care - Shift 1% of
dependents to formal scenario ...364
Table A 131 - Number of dependent people (thousands) - Coverage convergence scenario...364
Table A 132 - Number of dependents receiving formal care (services in kind) - Coverage
convergence scenario...365
Table A 133 - Number of dependents relying on cash benefits or informal care - Coverage
convergence scenario...365
Education projections
Table A 134 - Education spending as % of GDP - Total - Baseline...368
Table A 135 - Education spending as % of GDP - Primary education (ISCED1) - Baseline ...368
Table A 136 - Education spending as % of GDP - Lower secondary education (ISCED2) -
Baseline...369
Table A 137 - Education spending as % of GDP - Upper secondary education (ISCED3&4) -
Baseline...369
Table A 138 - Education spending as % of GDP - Tertiary education (ISCED 5&6) - Baseline .370
Table A 139 - Number of students (thousands) - Total ...370
Table A 140 - Number of students as % of population 5-24 - Total ...371
Table A 141 - Number of students (thousands) - Primary education (ISCED1)...371
Table A 142 - Number of students (thousands) - Lower secondary education (ISCED2) ...372
Table A 143 - Number of students (thousands) - Upper secondary education (ISCED3&4) ...372
Table A 146 - Number of teachers (thousands) - Primary education (ISCED1)...374
Table A 147 - Number of teachers (thousands) - Lower secondary education (ISCED2) ...374
Table A 148 - Number of teachers (thousands) - Upper secondary education (ISCED3&4) ...375
Table A 149 - Number of teachers (thousands) - Tertiary education (ISCED5&6)...375
Table A 150 - Education spending as % of GDP - Total - Inertia scenario...376
Table A 151 - Education spending as % of GDP - Total - EU2020 scenario...376
Unemployment benefit projections
Table A 152 - Unemployment benefit spending as % of GDP...377
Main demographic and macroeconomic assumptions
Table A 1 – Fertility rate
Country Ch 10-60 2010 2015 2020 2025 2030 2035 2040 2045 2050 2055 2060 BE 0.0 1.8 1.8 1.8 1.8 1.8 1.8 1.8 1.8 1.8 1.8 1.8 BG 0.1 1.6 1.6 1.6 1.6 1.6 1.6 1.6 1.6 1.6 1.7 1.7 CZ 0.1 1.5 1.5 1.5 1.5 1.5 1.6 1.6 1.6 1.6 1.6 1.6 DK 0.0 1.8 1.8 1.8 1.8 1.8 1.8 1.8 1.8 1.8 1.8 1.8 DE 0.2 1.4 1.4 1.4 1.4 1.4 1.4 1.5 1.5 1.5 1.5 1.5 EE 0.1 1.6 1.6 1.6 1.6 1.7 1.7 1.7 1.7 1.7 1.7 1.7 IE -0.1 2.1 2.1 2.1 2.0 2.0 2.0 2.0 2.0 2.0 2.0 2.0 EL 0.1 1.5 1.5 1.5 1.6 1.6 1.6 1.6 1.6 1.6 1.6 1.6 ES 0.2 1.4 1.4 1.4 1.4 1.5 1.5 1.5 1.5 1.5 1.5 1.6 FR -0.1 2.0 2.0 2.0 2.0 2.0 2.0 2.0 2.0 2.0 2.0 1.9 IT 0.2 1.4 1.4 1.5 1.5 1.5 1.5 1.5 1.5 1.5 1.6 1.6 CY 0.1 1.5 1.5 1.5 1.5 1.5 1.6 1.6 1.6 1.6 1.6 1.6 LV 0.2 1.3 1.3 1.4 1.4 1.4 1.4 1.4 1.4 1.5 1.5 1.5 LT 0.1 1.5 1.6 1.6 1.6 1.6 1.6 1.6 1.6 1.6 1.6 1.7 LU 0.1 1.6 1.6 1.6 1.6 1.6 1.6 1.6 1.7 1.7 1.7 1.7 HU 0.2 1.3 1.3 1.4 1.4 1.4 1.4 1.4 1.5 1.5 1.5 1.5 MT 0.1 1.4 1.5 1.5 1.5 1.5 1.5 1.5 1.5 1.6 1.6 1.6 NL 0.0 1.8 1.8 1.8 1.8 1.8 1.8 1.8 1.8 1.8 1.8 1.8 AT 0.2 1.4 1.4 1.4 1.4 1.5 1.5 1.5 1.5 1.5 1.5 1.6 PL 0.2 1.4 1.4 1.4 1.4 1.5 1.5 1.5 1.5 1.5 1.5 1.6 PT 0.2 1.3 1.3 1.4 1.4 1.4 1.4 1.4 1.5 1.5 1.5 1.5 RO 0.2 1.4 1.4 1.4 1.4 1.4 1.5 1.5 1.5 1.5 1.5 1.5 SI 0.1 1.5 1.5 1.6 1.6 1.6 1.6 1.6 1.6 1.6 1.6 1.6 SK 0.2 1.4 1.4 1.4 1.5 1.5 1.5 1.5 1.5 1.5 1.6 1.6 FI 0.0 1.9 1.9 1.9 1.9 1.9 1.9 1.9 1.9 1.9 1.9 1.9 SE 0.0 1.9 1.9 1.9 1.9 1.9 1.9 1.9 1.9 1.9 1.9 1.9 UK 0.0 1.9 1.9 1.9 1.9 1.9 1.9 1.9 1.9 1.9 1.9 1.9 NO 0.0 1.9 1.9 1.9 1.9 1.9 1.9 1.9 1.9 1.9 1.9 1.9 EU27 0.1 1.6 1.6 1.6 1.6 1.6 1.7 1.7 1.7 1.7 1.7 1.7 EA17 0.1 1.6 1.6 1.6 1.6 1.6 1.6 1.6 1.6 1.7 1.7 1.7Source: Commission services, EPC.
Table A 2 – Life expectancy at birth - Men
Country Ch 10-60 2010 2015 2020 2025 2030 2035 2040 2045 2050 2055 2060 BE 7.3 77.3 78.1 79.0 79.7 80.5 81.2 82.0 82.7 83.3 84.0 84.6 BG 11.4 70.3 71.6 72.9 74.2 75.4 76.5 77.6 78.7 79.7 80.7 81.7 CZ 8.8 74.3 75.3 76.3 77.3 78.2 79.1 79.9 80.8 81.6 82.4 83.2 DK 7.4 77.0 77.8 78.6 79.4 80.2 80.9 81.7 82.4 83.1 83.8 84.4 DE 7.2 77.6 78.5 79.3 80.0 80.8 81.5 82.2 82.9 83.6 84.2 84.8 EE 11.8 69.8 71.2 72.5 73.8 75.0 76.2 77.4 78.5 79.6 80.6 81.6 IE 7.5 77.0 77.9 78.7 79.5 80.3 81.0 81.8 82.5 83.2 83.9 84.5 EL 7.1 77.8 78.6 79.4 80.2 80.9 81.6 82.3 83.0 83.7 84.3 84.9 ES 6.8 78.6 79.4 80.2 80.9 81.6 82.3 83.0 83.6 84.2 84.8 85.4 FR 7.2 77.9 78.7 79.6 80.3 81.1 81.8 82.5 83.2 83.9 84.5 85.1 IT 6.6 78.9 79.7 80.4 81.1 81.8 82.4 83.1 83.7 84.3 84.9 85.5 CY 6.8 78.3 79.1 79.9 80.6 81.3 82.0 82.7 83.3 83.9 84.5 85.1 LV 12.8 68.3 69.8 71.2 72.6 74.0 75.3 76.6 77.8 78.9 80.0 81.1 LT 12.9 67.7 69.2 70.7 72.1 73.5 74.8 76.1 77.3 78.5 79.6 80.7 LU 7.1 77.8 78.6 79.4 80.1 80.9 81.6 82.3 83.0 83.6 84.3 84.9 HU 11.5 70.4 71.8 73.0 74.3 75.5 76.7 77.8 78.9 80.0 81.0 81.9 MT 7.3 77.6 78.5 79.3 80.1 80.8 81.6 82.3 83.0 83.6 84.3 84.9 NL 6.5 78.7 79.4 80.1 80.8 81.5 82.1 82.8 83.4 84.0 84.6 85.2 AT 7.2 77.6 78.4 79.2 80.0 80.7 81.5 82.2 82.9 83.5 84.2 84.8 PL 10.7 71.7 73.0 74.2 75.3 76.4 77.5 78.6 79.6 80.6 81.5 82.4 PT 7.7 76.5 77.4 78.3 79.1 79.9 80.7 81.5 82.2 82.9 83.6 84.2 RO 11.8 70.0 71.4 72.8 74.1 75.3 76.5 77.6 78.8 79.8 80.8 81.8 SI 8.1 75.8 76.8 77.7 78.5 79.4 80.2 81.0 81.8 82.5 83.3 84.0 SK 10.6 71.6 72.8 74.0 75.1 76.2 77.3 78.4 79.4 80.3 81.3 82.2 FI 7.7 76.6 77.5 78.4 79.2 80.0 80.8 81.6 82.3 83.0 83.7 84.4 SE 6.1 79.4 80.1 80.8 81.4 82.1 82.7 83.3 83.8 84.4 85.0 85.5 UK 7.0 78.3 79.1 79.9 80.6 81.4 82.1 82.7 83.4 84.0 84.6 85.2 NO 6.5 78.7 79.4 80.2 80.9 81.5 82.2 82.8 83.4 84.1 84.6 85.2 EU27 7.9 76.7 77.6 78.5 79.4 80.2 81.0 81.8 82.6 83.3 84.0 84.6 EA17 7.1 77.9 78.7 79.5 80.3 81.0 81.8 82.5 83.1 83.8 84.4 85.0
Table A 3 - Life expectancy at birth - Women
Country Ch 10-60 2010 2015 2020 2025 2030 2035 2040 2045 2050 2055 2060 BE 6.4 82.6 83.3 84.0 84.7 85.4 86.0 86.7 87.3 87.9 88.4 89.0 BG 9.1 77.5 78.5 79.6 80.5 81.5 82.4 83.3 84.2 85.0 85.8 86.6 CZ 7.4 80.4 81.3 82.1 82.9 83.6 84.4 85.1 85.8 86.5 87.2 87.8 DK 7.3 81.1 82.0 82.8 83.6 84.3 85.1 85.8 86.5 87.2 87.8 88.4 DE 6.2 82.7 83.4 84.1 84.7 85.4 86.0 86.6 87.2 87.8 88.3 88.9 EE 7.9 80.1 81.0 81.9 82.7 83.6 84.4 85.1 85.9 86.6 87.3 88.0 IE 6.9 82.0 82.8 83.5 84.3 85.0 85.7 86.4 87.0 87.7 88.3 88.9 EL 5.5 82.8 83.4 84.0 84.5 85.1 85.7 86.2 86.7 87.3 87.8 88.3 ES 5.3 84.7 85.3 85.8 86.4 86.9 87.5 88.0 88.5 89.0 89.5 89.9 FR 5.5 84.6 85.2 85.8 86.4 87.0 87.6 88.1 88.6 89.1 89.6 90.0 IT 5.6 84.2 84.8 85.4 86.0 86.6 87.2 87.7 88.2 88.8 89.3 89.7 CY 6.2 82.8 83.5 84.2 84.8 85.4 86.1 86.7 87.3 87.9 88.4 89.0 LV 9.2 78.0 79.1 80.1 81.1 82.1 83.1 83.9 84.8 85.6 86.4 87.2 LT 8.4 78.7 79.6 80.6 81.5 82.4 83.2 84.0 84.8 85.6 86.3 87.1 LU 6.6 82.9 83.7 84.4 85.1 85.8 86.5 87.1 87.7 88.3 88.9 89.5 HU 9.0 78.4 79.5 80.5 81.5 82.4 83.3 84.2 85.0 85.9 86.6 87.4 MT 6.6 82.3 83.1 83.8 84.6 85.3 85.9 86.6 87.2 87.8 88.4 88.9 NL 6.3 82.8 83.5 84.2 84.9 85.5 86.2 86.8 87.4 88.0 88.5 89.1 AT 6.1 83.0 83.7 84.4 85.0 85.6 86.3 86.9 87.4 88.0 88.5 89.1 PL 7.8 80.1 81.0 81.9 82.7 83.5 84.3 85.1 85.8 86.6 87.2 87.9 PT 6.1 82.5 83.2 83.9 84.5 85.1 85.7 86.3 86.9 87.5 88.0 88.6 RO 9.3 77.5 78.5 79.6 80.6 81.6 82.5 83.4 84.3 85.1 86.0 86.7 SI 6.5 82.3 83.0 83.7 84.4 85.1 85.8 86.4 87.0 87.6 88.2 88.8 SK 8.3 79.1 80.1 81.0 81.9 82.7 83.6 84.4 85.2 86.0 86.7 87.4 FI 6.0 83.2 83.9 84.6 85.2 85.9 86.5 87.0 87.6 88.2 88.7 89.2 SE 5.9 83.4 84.1 84.8 85.4 86.0 86.6 87.2 87.7 88.3 88.8 89.3 UK 6.7 82.4 83.2 83.9 84.7 85.4 86.0 86.7 87.3 87.9 88.5 89.1 NO 6.1 83.1 83.8 84.5 85.2 85.8 86.4 87.0 87.6 88.1 88.7 89.2 EU27 6.5 82.5 83.3 84.0 84.7 85.4 86.1 86.7 87.3 87.9 88.5 89.1 EA17 5.9 83.5 84.2 84.9 85.5 86.1 86.7 87.3 87.9 88.4 88.9 89.4Source: Commission services, EPC.
Table A 4 - Life expectancy at 65 - Men
Country Ch 10-60 2010 2015 2020 2025 2030 2035 2040 2045 2050 2055 2060 BE 4.9 17.4 17.9 18.4 18.9 19.4 19.9 20.4 20.9 21.4 21.8 22.3 BG 6.7 13.8 14.5 15.3 15.9 16.6 17.3 18.0 18.7 19.3 19.9 20.6 CZ 5.9 15.3 15.9 16.5 17.1 17.7 18.4 18.9 19.5 20.1 20.7 21.2 DK 5.2 16.8 17.4 17.9 18.5 19.0 19.5 20.0 20.6 21.1 21.5 22.0 DE 5.0 17.4 17.9 18.5 19.0 19.5 20.0 20.5 21.0 21.5 21.9 22.4 EE 6.8 14.1 14.8 15.5 16.2 16.9 17.6 18.3 19.0 19.6 20.3 20.9 IE 5.3 16.8 17.4 18.0 18.5 19.1 19.6 20.1 20.7 21.2 21.7 22.2 EL 4.7 17.9 18.4 18.9 19.4 19.9 20.4 20.8 21.3 21.7 22.2 22.6 ES 4.7 18.2 18.7 19.2 19.7 20.2 20.7 21.1 21.6 22.0 22.5 22.9 FR 4.5 18.5 19.0 19.5 19.9 20.4 20.8 21.3 21.7 22.1 22.6 23.0 IT 4.7 18.1 18.6 19.1 19.6 20.1 20.6 21.0 21.5 22.0 22.4 22.8 CY 4.8 17.8 18.3 18.8 19.3 19.8 20.2 20.7 21.2 21.6 22.1 22.5 LV 7.2 13.5 14.2 15.0 15.7 16.5 17.2 17.9 18.6 19.3 20.0 20.6 LT 6.9 13.5 14.3 15.0 15.7 16.4 17.1 17.8 18.5 19.1 19.8 20.4 LU 5.0 17.3 17.9 18.4 18.9 19.5 20.0 20.5 21.0 21.4 21.9 22.4 HU 6.9 14.0 14.8 15.5 16.2 16.9 17.7 18.3 19.0 19.7 20.3 20.9 MT 5.2 17.0 17.6 18.1 18.7 19.2 19.7 20.3 20.8 21.3 21.8 22.2 NL 4.9 17.5 18.0 18.5 19.0 19.5 20.0 20.5 21.0 21.4 21.9 22.3 AT 4.8 17.6 18.1 18.6 19.1 19.6 20.1 20.6 21.1 21.5 22.0 22.4 PL 6.4 14.8 15.5 16.2 16.9 17.5 18.2 18.8 19.4 20.0 20.6 21.2 PT 5.0 17.1 17.6 18.1 18.7 19.2 19.7 20.2 20.7 21.1 21.6 22.1 RO 6.7 14.1 14.8 15.5 16.2 16.9 17.6 18.3 18.9 19.6 20.2 20.8 SI 5.5 16.4 17.0 17.6 18.1 18.7 19.2 19.8 20.3 20.8 21.4 21.9 SK 6.6 14.1 14.8 15.5 16.2 16.9 17.6 18.2 18.9 19.5 20.2 20.8 FI 5.0 17.3 17.8 18.3 18.9 19.4 19.9 20.4 20.9 21.4 21.8 22.3 SE 4.4 18.2 18.7 19.2 19.6 20.1 20.5 21.0 21.4 21.8 22.3 22.7 UK 4.8 18.0 18.5 19.0 19.5 20.0 20.5 21.0 21.4 21.9 22.3 22.8 NO 4.6 17.9 18.4 18.9 19.4 19.9 20.3 20.8 21.2 21.7 22.1 22.5 EU27 5.2 17.2 17.8 18.3 18.9 19.4 19.9 20.4 21.0 21.4 21.9 22.4 EA17 4.8 17.8 18.3 18.8 19.3 19.8 20.3 20.8 21.3 21.7 22.2 22.6
Table A 5 - Life expectancy at 65 - Women
Country Ch 10-60 2010 2015 2020 2025 2030 2035 2040 2045 2050 2055 2060 BE 4.8 20.9 21.4 21.9 22.4 22.9 23.4 23.9 24.3 24.8 25.2 25.7 BG 6.6 17.0 17.7 18.4 19.1 19.7 20.4 21.1 21.7 22.4 23.0 23.6 CZ 5.8 18.7 19.3 19.9 20.5 21.1 21.7 22.3 22.8 23.4 23.9 24.5 DK 5.6 19.5 20.2 20.8 21.4 21.9 22.5 23.1 23.6 24.1 24.6 25.1 DE 4.8 20.6 21.1 21.6 22.1 22.6 23.1 23.6 24.1 24.5 25.0 25.4 EE 5.8 19.1 19.7 20.4 21.0 21.6 22.2 22.7 23.3 23.8 24.4 24.9 IE 5.5 20.0 20.6 21.2 21.8 22.4 22.9 23.5 24.0 24.5 25.0 25.5 EL 4.4 20.2 20.7 21.1 21.6 22.0 22.5 22.9 23.3 23.8 24.2 24.6 ES 4.1 22.1 22.6 23.0 23.4 23.9 24.3 24.7 25.1 25.5 25.9 26.3 FR 3.9 22.7 23.1 23.6 24.0 24.4 24.8 25.2 25.5 25.9 26.3 26.6 IT 4.4 21.7 22.2 22.7 23.1 23.6 24.0 24.5 24.9 25.3 25.7 26.1 CY 5.3 20.0 20.6 21.1 21.7 22.2 22.7 23.3 23.8 24.3 24.8 25.3 LV 6.3 18.1 18.8 19.5 20.1 20.8 21.4 22.1 22.7 23.3 23.9 24.4 LT 5.8 18.4 19.0 19.6 20.2 20.8 21.4 22.0 22.6 23.1 23.7 24.2 LU 4.9 21.1 21.7 22.2 22.8 23.3 23.8 24.3 24.7 25.2 25.6 26.1 HU 6.4 18.1 18.8 19.5 20.2 20.9 21.5 22.2 22.8 23.4 24.0 24.6 MT 5.2 20.2 20.7 21.3 21.8 22.4 22.9 23.4 23.9 24.4 24.9 25.4 NL 4.8 20.9 21.4 21.9 22.4 22.9 23.4 23.8 24.3 24.8 25.2 25.6 AT 4.7 20.9 21.4 21.9 22.4 22.9 23.3 23.8 24.3 24.7 25.1 25.6 PL 5.7 19.1 19.7 20.3 20.9 21.5 22.1 22.7 23.2 23.8 24.3 24.8 PT 4.7 20.4 20.9 21.4 21.9 22.4 22.8 23.3 23.8 24.2 24.7 25.1 RO 6.6 17.2 17.9 18.6 19.3 20.0 20.6 21.3 22.0 22.6 23.2 23.8 SI 5.1 20.2 20.8 21.3 21.9 22.4 22.9 23.4 23.9 24.4 24.8 25.3 SK 6.3 18.0 18.6 19.3 19.9 20.6 21.2 21.9 22.5 23.1 23.7 24.3 FI 4.5 21.3 21.8 22.2 22.7 23.2 23.6 24.1 24.5 25.0 25.4 25.8 SE 4.7 21.1 21.6 22.1 22.6 23.1 23.5 24.0 24.5 24.9 25.3 25.7 UK 5.0 20.7 21.2 21.8 22.3 22.8 23.3 23.8 24.3 24.8 25.3 25.7 NO 4.7 21.0 21.5 22.0 22.5 23.0 23.5 23.9 24.4 24.8 25.3 25.7 EU27 4.9 20.7 21.2 21.8 22.3 22.8 23.3 23.8 24.3 24.7 25.2 25.6 EA17 4.5 21.4 21.9 22.4 22.8 23.3 23.8 24.2 24.7 25.1 25.5 25.9Source: Commission services, EPC.
Table A 6 - Net migration (thousands)
Country Ch 10-60 2010 2015 2020 2025 2030 2035 2040 2045 2050 2055 2060 BE -29.3 61.3 53.7 46.2 44.4 42.6 40.9 39.1 37.3 35.5 33.8 32.0 BG 10.7 -9.9 -10.9 -14.6 -9.5 -3.3 4.8 5.5 4.6 3.8 3.0 0.7 CZ -12.2 30.5 32.1 29.0 25.1 25.6 26.0 29.9 26.5 24.1 22.1 18.3 DK -3.6 12.3 11.6 11.4 11.4 12.0 10.3 9.9 9.2 8.7 8.6 8.7 DE 31.2 41.0 89.3 114.6 129.8 133.0 108.5 82.4 92.0 87.7 90.1 72.3 EE 0.6 -0.5 -0.6 -1.0 -0.7 -0.3 0.5 0.6 0.7 0.8 0.6 0.0 IE 37.1 -21.5 -0.4 22.5 21.6 20.8 19.9 19.0 18.3 17.3 16.4 15.6 EL -0.9 26.2 32.6 37.0 36.4 35.8 37.0 35.9 34.8 29.8 27.0 25.3 ES 106.1 79.1 170.6 267.4 257.2 254.0 252.4 249.6 234.1 209.7 195.4 185.2 FR -9.0 71.9 83.9 92.7 89.1 87.0 83.4 76.8 75.5 70.7 66.9 62.9 IT -116.4 360.7 352.4 344.1 334.8 338.7 326.3 312.3 286.4 269.8 259.1 244.3 CY 1.9 2.2 4.1 6.0 5.7 5.5 5.3 5.0 4.9 4.7 4.5 4.1 LV 4.0 -3.4 -1.7 -0.5 0.3 0.4 1.3 1.5 1.6 1.9 1.7 0.6 LT 13.8 -13.0 -8.8 -5.1 -2.8 -1.0 1.4 1.2 1.5 2.2 1.9 0.8 LU -3.8 6.3 5.0 3.7 3.6 3.4 3.3 3.1 3.0 2.8 2.7 2.6 HU -3.7 22.5 26.2 27.3 23.0 22.1 23.8 26.7 23.8 22.0 20.9 18.9 MT 1.6 -1.2 -0.3 0.5 0.5 0.4 0.4 0.5 0.5 0.5 0.5 0.4 NL -29.4 35.5 20.6 9.3 11.1 11.8 11.0 5.2 5.7 5.9 7.6 6.2 AT 6.7 19.1 27.0 35.2 36.1 35.6 32.9 29.9 29.1 27.9 27.2 25.8 PL 2.4 11.7 20.5 13.0 4.4 3.2 14.0 26.4 33.0 34.2 23.9 14.1 PT 9.3 18.5 27.7 36.8 37.6 37.2 36.7 37.0 34.2 30.7 29.2 27.8 RO 7.9 -0.2 7.5 8.4 4.6 3.2 16.5 17.6 18.6 16.8 13.2 7.6 SI -7.1 11.0 8.7 6.3 5.6 5.7 5.3 5.6 5.6 5.0 4.4 3.8 SK -3.7 10.6 10.8 9.9 8.3 8.2 8.4 10.3 10.4 9.9 8.7 6.8 FI -7.5 14.8 13.8 11.4 10.3 9.7 8.9 8.6 8.5 8.2 8.0 7.3 SE -40.4 59.9 44.0 28.2 27.1 26.0 24.9 23.8 22.7 21.7 22.0 19.5 UK -64.2 197.9 195.4 193.0 185.6 178.1 170.7 163.3 155.9 148.5 141.0 133.6 NO -24.9 36.9 27.2 17.4 16.7 16.0 15.4 14.7 14.0 13.4 12.7 12.0 EU27 -98.0 1043.0 1215.0 1332.5 1300.7 1295.2 1274.4 1226.7 1178.3 1100.9 1040.3 945.0 EA17 -15.8 744.9 909.3 1051.4 1039.2 1036.7 989.6 931.7 891.9 827.7 791.4 729.1
Table A 7 - Net migration as % of population
Country Ch 10-60 2010 2015 2020 2025 2030 2035 2040 2045 2050 2055 2060 BE -0.3 0.6 0.5 0.4 0.4 0.3 0.3 0.3 0.3 0.3 0.3 0.2 BG 0.1 -0.1 -0.1 -0.2 -0.1 -0.1 0.1 0.1 0.1 0.1 0.1 0.0 CZ -0.1 0.3 0.3 0.3 0.2 0.2 0.2 0.3 0.2 0.2 0.2 0.2 DK -0.1 0.2 0.2 0.2 0.2 0.2 0.2 0.2 0.2 0.1 0.1 0.1 DE 0.1 0.1 0.1 0.1 0.2 0.2 0.1 0.1 0.1 0.1 0.1 0.1 EE 0.0 0.0 0.0 -0.1 -0.1 0.0 0.0 0.0 0.1 0.1 0.1 0.0 IE 0.7 -0.5 0.0 0.5 0.4 0.4 0.4 0.3 0.3 0.3 0.3 0.2 EL 0.0 0.2 0.3 0.3 0.3 0.3 0.3 0.3 0.3 0.3 0.2 0.2 ES 0.2 0.2 0.4 0.6 0.5 0.5 0.5 0.5 0.4 0.4 0.4 0.4 FR 0.0 0.1 0.1 0.1 0.1 0.1 0.1 0.1 0.1 0.1 0.1 0.1 IT -0.2 0.6 0.6 0.5 0.5 0.5 0.5 0.5 0.4 0.4 0.4 0.4 CY 0.1 0.3 0.5 0.7 0.6 0.6 0.5 0.5 0.5 0.4 0.4 0.4 LV 0.2 -0.2 -0.1 0.0 0.0 0.0 0.1 0.1 0.1 0.1 0.1 0.0 LT 0.4 -0.4 -0.3 -0.2 -0.1 0.0 0.0 0.0 0.1 0.1 0.1 0.0 LU -0.9 1.2 0.9 0.6 0.6 0.5 0.5 0.5 0.4 0.4 0.4 0.4 HU 0.0 0.2 0.3 0.3 0.2 0.2 0.2 0.3 0.3 0.2 0.2 0.2 MT 0.4 -0.3 -0.1 0.1 0.1 0.1 0.1 0.1 0.1 0.1 0.1 0.1 NL -0.2 0.2 0.1 0.1 0.1 0.1 0.1 0.0 0.0 0.0 0.0 0.0 AT 0.1 0.2 0.3 0.4 0.4 0.4 0.4 0.3 0.3 0.3 0.3 0.3 PL 0.0 0.0 0.1 0.0 0.0 0.0 0.0 0.1 0.1 0.1 0.1 0.0 PT 0.1 0.2 0.3 0.3 0.3 0.3 0.3 0.3 0.3 0.3 0.3 0.3 RO 0.0 0.0 0.0 0.0 0.0 0.0 0.1 0.1 0.1 0.1 0.1 0.0 SI -0.3 0.5 0.4 0.3 0.3 0.3 0.2 0.3 0.3 0.2 0.2 0.2 SK -0.1 0.2 0.2 0.2 0.1 0.1 0.2 0.2 0.2 0.2 0.2 0.1 FI -0.1 0.3 0.3 0.2 0.2 0.2 0.2 0.1 0.1 0.1 0.1 0.1 SE -0.5 0.6 0.5 0.3 0.3 0.2 0.2 0.2 0.2 0.2 0.2 0.2 UK -0.1 0.3 0.3 0.3 0.3 0.3 0.2 0.2 0.2 0.2 0.2 0.2 NO -0.6 0.8 0.5 0.3 0.3 0.3 0.3 0.2 0.2 0.2 0.2 0.2 EU27 0.0 0.2 0.2 0.3 0.3 0.2 0.2 0.2 0.2 0.2 0.2 0.2 EA17 0.0 0.2 0.3 0.3 0.3 0.3 0.3 0.3 0.3 0.2 0.2 0.2Source: Commission services, EPC.
Table A 8 - Population (millions)
Country Ch 10-60 2010 2015 2020 2025 2030 2035 2040 2045 2050 2055 2060 BE 2.6 10.9 11.3 11.6 11.9 12.2 12.5 12.7 13.0 13.1 13.3 13.5 BG -2.0 7.5 7.3 7.1 6.8 6.6 6.4 6.2 6.1 5.9 5.7 5.5 CZ -0.1 10.5 10.7 10.8 10.9 10.8 10.8 10.7 10.7 10.7 10.6 10.5 DK 0.5 5.5 5.6 5.7 5.8 5.9 6.0 6.0 6.0 6.0 6.1 6.1 DE -15.5 81.7 80.9 80.0 79.0 77.7 76.3 74.6 72.7 70.6 68.3 66.2 EE -0.2 1.3 1.3 1.3 1.3 1.3 1.3 1.2 1.2 1.2 1.2 1.2 IE 2.1 4.5 4.6 4.8 5.1 5.3 5.5 5.8 6.0 6.2 6.4 6.6 EL 0.0 11.3 11.5 11.5 11.6 11.6 11.6 11.6 11.6 11.6 11.4 11.3 ES 6.2 46.1 47.0 48.1 49.1 50.1 51.0 51.8 52.4 52.7 52.6 52.2 FR 8.9 64.9 66.5 68.0 69.2 70.4 71.4 72.3 72.8 73.2 73.5 73.7 IT 4.4 60.5 61.9 63.0 63.8 64.6 65.2 65.7 66.0 65.9 65.5 64.9 CY 0.3 0.8 0.8 0.9 0.9 1.0 1.0 1.0 1.1 1.1 1.1 1.1 LV -0.6 2.2 2.2 2.1 2.1 2.0 2.0 1.9 1.8 1.8 1.7 1.7 LT -0.7 3.3 3.2 3.2 3.1 3.0 3.0 2.9 2.9 2.8 2.7 2.7 LU 0.2 0.5 0.5 0.6 0.6 0.6 0.7 0.7 0.7 0.7 0.7 0.7 HU -1.2 10.0 10.0 9.9 9.8 9.7 9.6 9.4 9.3 9.2 9.0 8.8 MT 0.0 0.4 0.4 0.4 0.4 0.4 0.4 0.4 0.4 0.4 0.4 0.4 NL 0.4 16.6 17.0 17.2 17.4 17.6 17.7 17.6 17.5 17.3 17.2 17.1 AT 0.5 8.4 8.5 8.6 8.7 8.9 8.9 9.0 9.0 9.0 8.9 8.9 PL -5.6 38.2 38.4 38.4 38.1 37.5 36.8 36.0 35.3 34.5 33.6 32.6 PT -0.4 10.6 10.7 10.7 10.8 10.8 10.8 10.8 10.7 10.6 10.4 10.2 RO -4.2 21.4 21.2 21.0 20.6 20.2 19.8 19.4 18.9 18.4 17.9 17.2 SI 0.0 2.1 2.1 2.1 2.2 2.2 2.1 2.1 2.1 2.1 2.1 2.1 SK -0.3 5.4 5.5 5.6 5.6 5.6 5.5 5.5 5.4 5.3 5.2 5.1 FI 0.4 5.4 5.5 5.6 5.7 5.7 5.7 5.7 5.7 5.7 5.7 5.7 SE 2.2 9.4 9.8 10.1 10.4 10.6 10.8 10.9 11.1 11.2 11.4 11.5 UK 16.8 62.2 64.4 66.5 68.5 70.4 72.0 73.6 75.1 76.5 77.8 79.0 NO 1.7 4.9 5.2 5.4 5.6 5.8 6.0 6.1 6.3 6.4 6.5 6.6 EU27 14.7 501.8 508.9 514.9 519.5 522.6 524.7 525.7 525.5 523.8 520.7 516.5 EA17 9.5 331.4 336.1 340.1 343.4 345.8 347.7 348.6 348.3 346.8 344.1 340.8
Table A 9 - Children population (0-14) as % of total population
Country Ch 10-60 2010 2015 2020 2025 2030 2035 2040 2045 2050 2055 2060 BE -0.6 16.9 17.1 17.3 17.2 16.8 16.5 16.4 16.4 16.5 16.5 16.3 BG -0.6 13.7 14.6 14.9 14.2 13.2 12.8 13.0 13.4 13.5 13.3 13.1 CZ -0.8 14.3 15.3 15.7 14.9 13.9 13.2 13.3 13.7 14.1 13.9 13.6 DK -1.9 18.0 17.3 16.9 16.8 16.9 16.9 16.7 16.3 16.1 16.0 16.1 DE -0.9 13.4 12.8 12.6 12.6 12.5 12.3 12.1 12.0 12.1 12.3 12.5 EE -0.8 15.2 16.5 17.2 16.4 15.2 14.2 14.1 14.6 15.0 14.9 14.4 IE -3.5 21.5 22.6 22.2 20.3 18.7 18.3 18.9 19.5 19.4 18.8 18.0 EL -0.9 14.4 14.8 14.8 14.1 13.4 13.1 13.2 13.5 13.7 13.6 13.5 ES -2.3 15.0 15.4 14.8 13.7 12.8 12.6 12.8 13.0 13.1 12.9 12.7 FR -2.1 18.5 18.3 18.1 17.7 17.3 17.0 16.8 16.8 16.7 16.6 16.4 IT -1.6 14.1 13.9 13.5 12.9 12.6 12.5 12.5 12.6 12.6 12.5 12.5 CY -2.0 16.8 16.7 17.3 17.2 16.5 15.5 14.8 14.6 14.8 14.9 14.8 LV -1.9 13.8 14.7 14.9 14.0 13.0 12.1 11.9 12.1 12.3 12.2 11.9 LT -1.2 15.0 15.3 16.3 16.2 15.1 13.8 13.3 13.5 14.0 14.1 13.7 LU -2.5 17.7 17.0 16.7 16.5 16.1 15.7 15.4 15.2 15.1 15.1 15.1 HU -2.4 14.7 14.6 14.4 13.9 13.3 12.8 12.6 12.5 12.5 12.5 12.3 MT -2.5 15.5 14.9 15.0 14.7 14.1 13.4 12.9 12.8 13.0 13.1 13.1 NL -2.0 17.5 16.8 16.2 16.1 16.1 16.0 15.8 15.5 15.4 15.4 15.5 AT -1.3 14.8 14.1 13.9 13.8 13.8 13.6 13.4 13.2 13.2 13.4 13.5 PL -3.1 15.1 15.2 15.6 14.9 13.6 12.5 12.1 12.2 12.5 12.4 12.0 PT -3.1 15.1 14.5 13.5 12.8 12.4 12.3 12.3 12.3 12.2 12.0 12.0 RO -3.6 15.2 15.0 14.8 14.0 13.0 12.3 12.0 12.0 11.9 11.8 11.6 SI -0.4 14.1 14.7 15.2 14.6 13.6 12.9 12.9 13.5 13.9 13.9 13.6 SK -3.0 15.3 15.3 15.6 15.0 13.8 12.8 12.4 12.5 12.7 12.6 12.4 FI -0.6 16.6 16.6 16.9 16.8 16.5 16.1 15.9 15.9 16.1 16.1 16.0 SE 0.2 16.6 17.3 17.9 18.0 17.6 17.0 16.5 16.5 16.8 16.9 16.8 UK -0.3 17.4 17.7 18.2 18.1 17.8 17.4 17.2 17.2 17.3 17.3 17.1 NO -1.7 18.8 18.5 18.6 18.6 18.3 17.8 17.4 17.2 17.2 17.2 17.1 EU27 -1.4 15.6 15.6 15.5 15.1 14.6 14.3 14.2 14.3 14.3 14.3 14.2 EA17 -1.5 15.4 15.3 15.0 14.5 14.1 13.9 13.9 13.9 14.0 13.9 13.9Source: Commission services, EPC.
Table A 10 - Prime age population (25-54) as % of total population
Country Ch 10-60 2010 2015 2020 2025 2030 2035 2040 2045 2050 2055 2060 BE -5.6 41.5 40.3 38.9 37.6 36.8 36.5 36.2 36.1 35.8 35.8 35.9 BG -8.9 42.8 42.7 41.6 39.3 37.1 35.4 34.4 33.1 32.9 33.6 33.8 CZ -8.7 43.8 43.7 43.2 41.7 39.1 37.0 36.3 35.5 34.8 35.0 35.1 DK -4.7 40.2 39.2 38.2 37.1 36.3 36.2 36.4 36.3 35.9 35.6 35.5 DE -9.3 42.6 41.4 38.6 36.3 35.7 35.3 34.6 33.7 33.4 33.2 33.2 EE -7.1 41.9 42.4 41.2 39.5 37.9 37.3 36.2 34.4 34.0 34.6 34.8 IE -7.9 44.7 42.3 39.5 38.3 37.5 37.0 36.4 37.0 37.3 37.0 36.8 EL -10.1 44.0 42.7 41.3 39.1 36.9 35.1 34.0 33.8 33.7 33.7 33.8 ES -12.3 46.6 44.9 42.8 40.5 38.3 36.4 35.4 35.1 34.8 34.6 34.4 FR -5.0 39.7 38.7 37.3 36.2 35.3 35.2 35.0 34.8 34.8 34.7 34.7 IT -9.0 43.3 42.2 40.5 38.3 36.5 35.7 35.4 35.0 34.6 34.5 34.3 CY -7.7 43.9 43.3 43.1 42.7 41.7 40.6 39.2 38.1 37.0 36.4 36.2 LV -10.1 43.1 43.9 43.1 41.2 39.4 38.6 36.6 33.8 32.5 33.0 33.0 LT -8.6 43.1 43.1 42.0 40.2 38.3 37.7 36.9 35.3 34.2 34.1 34.5 LU -9.2 45.5 44.6 43.3 41.7 40.4 39.3 38.3 37.6 37.0 36.6 36.4 HU -8.6 42.8 42.7 43.5 42.6 40.8 38.5 37.4 36.2 35.1 34.6 34.2 MT -6.8 41.4 40.6 40.5 40.8 40.1 39.0 37.9 36.6 35.4 34.7 34.6 NL -7.0 41.7 40.1 38.2 36.4 35.6 35.5 35.4 35.1 34.9 34.9 34.7 AT -8.7 44.0 42.8 40.9 38.8 37.8 37.5 36.9 36.4 35.7 35.4 35.3 PL -10.6 44.0 43.4 43.3 42.7 40.9 38.9 36.6 34.9 33.7 33.4 33.4 PT -10.0 43.8 42.9 41.5 40.3 38.9 37.1 35.9 35.4 34.9 34.5 33.8 RO -11.4 44.2 45.2 45.5 43.2 41.0 38.7 36.9 34.3 33.6 33.1 32.8 SI -10.8 44.9 43.7 41.7 39.6 37.7 36.0 34.8 33.9 33.7 33.8 34.1 SK -12.0 45.7 45.5 45.1 43.9 41.6 38.9 36.9 35.3 34.0 33.7 33.7 FI -4.2 39.2 37.9 37.0 36.1 35.9 35.6 35.3 35.2 34.9 35.0 35.0 SE -3.6 39.1 39.2 39.0 37.2 36.2 36.1 36.2 35.7 35.1 35.4 35.5 UK -4.9 41.0 40.6 39.3 37.7 36.8 37.0 36.8 36.4 36.0 36.0 36.2 NO -5.5 41.2 40.6 39.9 38.5 37.1 36.7 36.5 36.2 35.8 35.6 35.6 EU27 -8.1 42.7 41.8 40.3 38.6 37.2 36.4 35.7 35.1 34.7 34.6 34.5 EA17 -8.5 42.8 41.6 39.7 37.8 36.5 35.8 35.2 34.8 34.6 34.4 34.3
Table A 11 - Working age population (15-64) as % of total population
Country Ch 10-60 2010 2015 2020 2025 2030 2035 2040 2045 2050 2055 2060 BE -7.7 65.9 64.7 63.3 62.0 60.7 59.8 59.3 59.0 58.6 58.4 58.2 BG -14.4 68.7 66.0 64.1 63.1 62.5 61.4 59.4 57.0 55.3 54.0 54.3 CZ -14.5 70.3 67.0 64.5 64.0 64.0 63.7 61.6 58.7 57.1 56.1 55.8 DK -7.1 65.4 64.0 63.1 62.1 60.5 59.2 58.7 58.7 59.2 59.1 58.4 DE -11.2 66.0 65.6 64.2 62.1 59.2 56.7 56.2 56.0 55.6 54.9 54.8 EE -12.6 67.7 65.5 63.5 62.6 62.4 62.2 61.0 59.3 57.1 55.0 55.1 IE -6.9 67.0 64.3 63.2 63.6 63.6 62.7 60.8 58.9 57.7 58.7 60.1 EL -11.3 66.5 65.1 64.2 63.5 62.7 60.8 58.5 56.2 54.8 54.8 55.2 ES -12.2 68.0 66.5 65.9 65.4 64.1 61.9 59.2 56.5 55.3 55.4 55.9 FR -7.7 64.8 63.0 61.5 60.4 59.3 58.4 57.6 57.4 57.2 57.0 57.0 IT -9.8 65.7 64.6 64.1 63.4 61.7 59.5 57.5 56.3 55.9 55.9 55.9 CY -12.4 70.0 68.3 66.1 64.4 63.8 64.0 63.9 62.8 60.7 59.0 57.6 LV -16.4 68.9 67.3 65.9 64.8 63.8 63.0 61.3 59.3 56.6 53.5 52.5 LT -13.8 68.9 68.0 66.0 64.0 62.7 62.0 61.1 60.0 58.2 56.0 55.0 LU -9.9 68.4 68.4 67.6 66.1 64.3 62.7 61.6 60.7 59.7 59.0 58.5 HU -13.2 68.6 67.5 65.6 64.8 64.9 64.1 62.4 59.7 58.1 56.6 55.5 MT -13.6 69.4 66.7 64.3 62.4 61.7 62.1 62.0 60.9 59.3 57.3 55.8 NL -9.8 67.0 65.3 63.9 61.9 59.6 57.8 57.2 57.5 57.8 57.6 57.3 AT -10.3 67.6 67.1 66.2 64.4 61.8 59.7 58.9 58.8 58.4 58.0 57.3 PL -18.0 71.3 69.4 66.2 64.0 63.8 63.8 62.7 60.1 56.9 54.5 53.4 PT -10.9 66.8 66.1 65.7 64.9 63.4 61.7 59.5 57.5 56.4 56.1 56.0 RO -16.3 69.9 69.1 67.6 66.6 66.8 64.5 62.2 59.3 57.0 54.2 53.7 SI -14.6 69.4 67.5 64.8 63.2 62.0 60.9 59.4 57.2 55.4 54.5 54.8 SK -18.2 72.4 70.8 68.0 66.2 65.5 65.0 63.2 60.2 57.4 55.3 54.1 FI -9.3 66.2 63.2 60.9 59.3 58.4 58.1 58.6 58.4 57.9 57.5 56.9 SE -8.2 65.1 62.8 61.4 60.5 59.9 59.6 59.4 59.2 58.6 57.7 56.9 UK -7.7 66.0 64.3 63.0 62.0 60.8 59.9 59.6 59.7 59.3 58.6 58.3 NO -8.2 66.2 65.1 63.7 62.3 61.3 60.3 59.6 59.4 59.0 58.4 57.9 EU27 -10.7 67.0 65.5 64.2 62.9 61.5 60.1 58.9 57.8 57.0 56.4 56.2 EA17 -10.1 66.3 65.1 63.9 62.7 61.0 59.2 57.9 57.0 56.4 56.1 56.2Source: Commission services, EPC.
Table A 12 - Elderly population (65 and over) as % of total population
Country Ch 10-60 2010 2015 2020 2025 2030 2035 2040 2045 2050 2055 2060 BE 8.3 17.2 18.2 19.3 20.8 22.5 23.7 24.3 24.6 24.9 25.2 25.5 BG 15.0 17.6 19.4 21.0 22.8 24.3 25.8 27.6 29.6 31.2 32.6 32.6 CZ 15.3 15.4 17.7 19.8 21.0 22.1 23.0 25.1 27.5 28.8 30.0 30.6 DK 9.0 16.6 18.6 20.0 21.2 22.6 23.9 24.7 24.9 24.7 24.9 25.5 DE 12.2 20.6 21.6 23.2 25.3 28.4 31.0 31.7 32.0 32.3 32.8 32.8 EE 13.4 17.0 18.0 19.3 20.9 22.5 23.6 24.9 26.1 27.9 30.1 30.5 IE 10.5 11.5 13.0 14.6 16.1 17.7 19.0 20.3 21.6 22.9 22.5 21.9 EL 12.2 19.1 20.1 21.1 22.4 23.9 26.1 28.3 30.3 31.5 31.6 31.2 ES 14.4 17.0 18.1 19.2 20.9 23.1 25.5 28.0 30.4 31.6 31.7 31.4 FR 9.9 16.7 18.7 20.3 21.8 23.4 24.6 25.6 25.8 26.1 26.5 26.6 IT 11.4 20.3 21.5 22.4 23.7 25.7 28.0 30.0 31.1 31.5 31.6 31.6 CY 14.4 13.2 15.0 16.6 18.4 19.7 20.5 21.3 22.6 24.4 26.0 27.6 LV 18.3 17.3 18.1 19.2 21.2 23.2 24.9 26.8 28.5 31.2 34.3 35.6 LT 15.1 16.1 16.7 17.7 19.8 22.3 24.2 25.6 26.4 27.8 29.9 31.2 LU 12.5 14.0 14.7 15.8 17.4 19.6 21.6 23.0 24.2 25.2 25.8 26.4 HU 15.5 16.7 17.9 20.0 21.3 21.8 23.1 25.1 27.8 29.4 30.9 32.2 MT 16.1 15.1 18.4 20.7 22.9 24.2 24.5 25.1 26.3 27.8 29.6 31.2 NL 11.8 15.4 17.9 19.9 22.0 24.3 26.2 27.0 27.0 26.9 27.0 27.2 AT 11.5 17.6 18.8 19.9 21.8 24.4 26.6 27.7 27.9 28.4 28.6 29.2 PL 21.0 13.5 15.4 18.2 21.0 22.6 23.7 25.3 27.6 30.6 33.0 34.6 PT 14.0 18.0 19.3 20.7 22.3 24.2 26.0 28.2 30.2 31.4 31.8 32.0 RO 19.9 14.9 15.8 17.6 19.5 20.2 23.2 25.7 28.7 31.1 34.1 34.8 SI 15.0 16.5 17.7 20.0 22.2 24.4 26.2 27.7 29.3 30.7 31.6 31.5 SK 21.2 12.3 13.8 16.4 18.8 20.7 22.2 24.4 27.3 29.9 32.1 33.5 FI 9.8 17.3 20.2 22.3 23.8 25.1 25.7 25.5 25.6 26.0 26.4 27.1 SE 8.0 18.3 19.8 20.7 21.5 22.5 23.5 24.1 24.2 24.5 25.4 26.3 UK 8.0 16.5 18.0 18.8 19.8 21.4 22.7 23.2 23.1 23.4 24.1 24.6 NO 10.0 15.0 16.4 17.6 19.0 20.4 21.9 23.0 23.4 23.8 24.4 25.0 EU27 12.1 17.4 18.9 20.3 22.0 23.8 25.6 27.0 27.9 28.7 29.3 29.5 EA17 11.6 18.3 19.7 21.1 22.7 24.9 26.9 28.2 29.1 29.6 29.9 29.9Table A 13 - Very elderly population (80 and over) as % of total population
Country Ch 10-60 2010 2015 2020 2025 2030 2035 2040 2045 2050 2055 2060 BE 4.9 5.0 5.4 5.6 5.6 6.4 7.3 8.2 9.1 9.6 9.8 9.9 BG 9.0 3.9 4.5 4.8 5.4 6.7 7.7 8.5 9.2 10.1 11.4 12.9 CZ 8.7 3.6 3.9 4.0 5.0 6.5 7.6 7.9 8.2 8.7 10.4 12.3 DK 6.0 4.1 4.2 4.7 5.8 7.0 7.5 8.0 8.8 9.6 10.1 10.1 DE 8.4 5.1 5.8 7.3 8.0 8.2 9.2 10.7 12.9 14.5 14.1 13.5 EE 7.0 4.2 4.8 5.5 5.7 6.4 7.3 8.4 9.1 9.6 10.3 11.2 IE 6.3 2.8 3.0 3.3 3.8 4.7 5.4 6.1 6.8 7.5 8.2 9.1 EL 8.6 4.8 5.9 6.5 6.4 7.0 7.7 8.7 9.7 11.0 12.3 13.4 ES 9.4 5.0 5.7 5.9 6.2 6.9 7.6 8.7 10.1 11.5 13.0 14.3 FR 5.7 5.3 5.9 6.0 6.1 7.5 8.6 9.4 10.1 10.7 11.1 11.0 IT 8.2 5.9 6.5 7.2 7.5 8.3 8.8 9.7 11.1 12.6 13.8 14.1 CY 6.4 3.0 3.3 3.8 4.5 5.4 6.2 7.1 7.7 8.0 8.4 9.3 LV 8.8 4.0 4.6 5.5 5.8 6.3 7.2 8.6 9.8 10.7 11.7 12.8 LT 7.1 3.7 4.4 4.9 5.3 5.6 6.4 7.8 9.3 10.2 10.6 10.8 LU 6.5 3.7 4.1 4.3 4.5 5.0 5.9 6.9 8.1 9.2 9.8 10.2 HU 8.7 4.0 4.4 4.8 5.4 6.3 7.6 8.3 8.4 9.1 10.7 12.7 MT 7.9 3.4 4.0 4.7 5.5 7.4 8.6 9.6 10.0 9.7 10.1 11.3 NL 7.1 4.0 4.4 4.9 5.6 7.1 8.2 9.2 10.4 11.3 11.5 11.1 AT 6.7 4.8 5.0 5.6 6.4 7.0 7.6 8.8 10.5 11.8 12.0 11.6 PL 9.2 3.4 3.9 4.3 4.4 5.7 7.6 9.2 9.5 9.6 10.6 12.6 PT 9.0 4.6 5.4 5.9 6.3 7.1 7.9 8.9 10.1 11.1 12.4 13.6 RO 10.1 3.2 3.8 4.3 4.4 5.1 6.4 7.5 7.7 9.6 11.3 13.3 SI 8.8 4.0 4.7 5.2 5.6 6.5 8.0 9.3 10.3 11.0 11.7 12.8 SK 9.5 2.7 3.0 3.2 3.7 4.7 6.3 7.5 8.2 8.8 10.2 12.3 FI 5.7 4.7 5.1 5.6 6.3 8.1 9.3 9.8 10.2 10.3 10.1 10.4 SE 4.7 5.3 5.2 5.4 6.4 7.6 8.1 8.3 8.8 9.4 9.9 10.0 UK 4.6 4.7 4.9 5.2 5.7 6.7 7.1 7.7 8.7 9.4 9.5 9.3 NO 5.1 4.5 4.2 4.3 4.9 6.1 6.8 7.5 8.1 8.9 9.5 9.6 EU27 7.4 4.7 5.3 5.8 6.2 7.1 8.0 9.0 10.1 11.1 11.7 12.1 EA17 7.6 5.1 5.7 6.4 6.7 7.5 8.4 9.4 10.8 11.9 12.5 12.7Source: Commission services, EPC.
Table A 14 - Very elderly population (80 and over) as % of elderly population
Country Ch 10-60 2010 2015 2020 2025 2030 2035 2040 2045 2050 2055 2060 BE 9.9 29.0 29.7 28.8 26.9 28.6 30.8 33.9 37.1 38.7 39.0 38.9 BG 17.6 22.0 23.5 23.0 23.6 27.4 29.8 30.8 31.0 32.3 35.0 39.6 CZ 16.6 23.5 21.8 20.4 23.6 29.4 33.0 31.5 29.7 30.1 34.6 40.0 DK 14.9 24.8 22.5 23.4 27.3 30.9 31.6 32.5 35.5 39.0 40.6 39.7 DE 16.4 24.9 27.0 31.6 31.5 28.9 29.5 33.8 40.4 44.7 42.9 41.3 EE 12.3 24.5 26.7 28.7 27.1 28.3 31.1 33.7 35.1 34.4 34.3 36.7 IE 17.0 24.4 23.0 22.6 23.7 26.3 28.4 30.0 31.5 32.6 36.4 41.4 EL 17.8 25.2 29.5 31.0 28.7 29.3 29.5 30.8 31.8 35.0 39.0 43.0 ES 16.4 29.2 31.5 30.6 29.8 29.9 30.0 31.1 33.1 36.4 41.0 45.6 FR 9.6 31.9 31.6 29.7 28.1 32.0 34.9 36.9 39.4 40.9 41.8 41.5 IT 15.6 28.9 30.4 32.2 31.6 32.1 31.5 32.2 35.6 39.9 43.5 44.6 CY 11.4 22.4 21.8 22.9 24.3 27.2 30.3 33.4 34.3 32.6 32.2 33.8 LV 12.8 23.1 25.6 28.5 27.6 27.1 28.7 32.0 34.4 34.2 34.1 35.9 LT 11.6 23.0 26.3 27.8 26.6 25.2 26.3 30.6 35.3 36.5 35.5 34.7 LU 12.1 26.6 28.1 27.3 25.5 25.7 27.1 30.0 33.7 36.5 37.8 38.7 HU 15.4 24.0 24.7 23.9 25.4 28.8 33.1 33.2 30.1 31.1 34.6 39.4 MT 14.0 22.3 21.9 22.8 24.0 30.7 35.1 38.3 37.8 34.8 34.1 36.3 NL 15.1 25.6 24.3 24.3 25.4 29.4 31.2 34.0 38.5 42.2 42.7 40.8 AT 12.3 27.4 26.8 28.2 29.5 28.8 28.5 31.8 37.6 41.6 41.7 39.7 PL 11.4 24.9 25.5 23.5 20.7 25.2 32.1 36.2 34.5 31.3 32.0 36.3 PT 17.1 25.3 27.7 28.6 28.4 29.1 30.4 31.6 33.3 35.2 38.8 42.4 RO 17.1 21.2 23.8 24.6 22.6 25.4 27.8 29.3 26.8 31.0 33.2 38.2 SI 16.3 24.4 26.7 26.2 25.3 26.6 30.6 33.5 35.0 35.8 37.0 40.7 SK 14.3 22.3 21.7 19.6 19.8 22.9 28.3 30.6 30.2 29.4 31.7 36.6 FI 11.2 27.2 25.3 25.1 26.4 32.5 36.1 38.6 39.9 39.6 38.1 38.3 SE 8.9 28.9 26.0 26.1 30.0 33.9 34.3 34.5 36.3 38.4 38.8 37.8 UK 9.7 28.2 27.3 27.8 28.7 31.3 31.5 33.5 37.5 40.0 39.5 37.8 NO 8.4 30.1 25.9 24.1 25.7 29.7 31.2 32.6 34.7 37.5 39.0 38.5 EU27 13.8 27.1 28.0 28.6 28.3 29.8 31.3 33.4 36.1 38.5 39.8 40.9 EA17 14.7 27.7 29.0 30.2 29.5 30.2 31.2 33.4 37.0 40.0 41.6 42.5Table A 15 - Very elderly population (80 and over) as % of working age population
Country Ch 10-60 2010 2015 2020 2025 2030 2035 2040 2045 2050 2055 2060 BE 9.5 7.6 8.4 8.8 9.0 10.6 12.2 13.9 15.5 16.4 16.8 17.1 BG 18.1 5.6 6.9 7.6 8.5 10.7 12.5 14.3 16.1 18.2 21.1 23.8 CZ 16.8 5.1 5.8 6.3 7.7 10.1 11.9 12.8 13.9 15.2 18.5 22.0 DK 11.1 6.3 6.6 7.4 9.3 11.6 12.7 13.7 15.1 16.3 17.1 17.3 DE 16.9 7.8 8.9 11.4 12.9 13.8 16.1 19.1 23.1 26.0 25.6 24.7 EE 14.2 6.2 7.3 8.7 9.1 10.2 11.8 13.8 15.4 16.8 18.8 20.3 IE 11.0 4.2 4.7 5.2 6.0 7.3 8.6 10.0 11.6 12.9 14.0 15.1 EL 17.1 7.2 9.1 10.2 10.1 11.2 12.7 14.9 17.2 20.1 22.5 24.3 ES 18.3 7.3 8.6 8.9 9.5 10.8 12.3 14.7 17.8 20.8 23.4 25.6 FR 11.1 8.2 9.3 9.8 10.2 12.6 14.7 16.4 17.7 18.6 19.4 19.4 IT 16.3 8.9 10.1 11.2 11.8 13.4 14.8 16.8 19.7 22.5 24.6 25.2 CY 11.9 4.2 4.8 5.8 6.9 8.4 9.7 11.2 12.3 13.1 14.2 16.2 LV 18.5 5.8 6.9 8.3 9.0 9.9 11.4 14.0 16.6 18.8 21.9 24.4 LT 14.3 5.4 6.5 7.5 8.2 9.0 10.3 12.8 15.5 17.5 18.9 19.7 LU 12.0 5.4 6.0 6.4 6.7 7.8 9.3 11.2 13.4 15.4 16.5 17.5 HU 17.1 5.8 6.5 7.3 8.4 9.7 11.9 13.3 14.0 15.8 18.9 22.9 MT 15.4 4.8 6.0 7.3 8.8 12.1 13.8 15.5 16.4 16.3 17.6 20.3 NL 13.5 5.9 6.7 7.6 9.1 12.0 14.1 16.1 18.0 19.6 20.0 19.4 AT 13.0 7.1 7.5 8.5 10.0 11.4 12.7 14.9 17.9 20.2 20.6 20.2 PL 18.8 4.7 5.7 6.5 6.8 8.9 11.9 14.6 15.8 16.9 19.4 23.5 PT 17.4 6.8 8.1 9.0 9.8 11.1 12.8 14.9 17.5 19.6 22.0 24.3 RO 20.3 4.5 5.5 6.4 6.6 7.7 10.0 12.1 13.0 16.9 20.9 24.8 SI 17.6 5.8 7.0 8.1 8.9 10.4 13.2 15.6 17.9 19.8 21.4 23.4 SK 18.9 3.8 4.2 4.7 5.6 7.3 9.7 11.8 13.7 15.3 18.4 22.7 FI 11.1 7.1 8.1 9.2 10.6 14.0 16.0 16.8 17.5 17.8 17.5 18.2 SE 9.4 8.1 8.2 8.8 10.6 12.7 13.5 14.0 14.9 16.1 17.1 17.5 UK 8.9 7.1 7.6 8.3 9.2 11.0 11.9 13.0 14.5 15.8 16.2 15.9 NO 9.8 6.8 6.5 6.7 7.9 9.9 11.4 12.6 13.7 15.1 16.3 16.6 EU27 14.4 7.1 8.0 9.1 9.9 11.5 13.3 15.3 17.4 19.4 20.7 21.5 EA17 15.0 7.7 8.8 9.9 10.7 12.3 14.1 16.3 18.9 21.0 22.2 22.6Source: Commission services, EPC.
Table A 16 - Potential GDP (growth rate)
Country AVG 10-60 2010 2015 2020 2025 2030 2035 2040 2045 2050 2055 2060 BE 1.6 1.4 1.6 1.4 1.5 1.6 1.8 1.8 1.8 1.7 1.7 1.8 BG 1.3 1.8 2.3 1.2 1.3 1.5 1.4 1.3 0.9 0.8 1.0 1.0 CZ 1.5 2.1 2.1 1.8 1.7 1.7 1.6 1.5 1.3 1.1 1.1 1.2 DK 1.4 0.5 1.1 1.3 1.6 1.4 1.4 1.6 1.7 1.7 1.6 1.5 DE 0.8 1.2 1.2 1.0 0.7 0.5 0.6 0.8 0.9 0.8 0.7 0.8 EE 1.5 -0.8 2.4 1.9 2.3 2.0 1.8 1.6 1.2 0.9 0.9 1.2 IE 2.1 -1.5 1.9 3.3 3.4 2.7 2.2 1.8 1.6 2.0 2.2 2.3 EL 1.0 -0.3 -0.1 1.2 1.2 1.4 1.2 1.0 1.0 1.3 1.3 1.4 ES 1.6 0.7 1.4 2.4 2.8 2.2 1.5 1.1 1.0 1.2 1.5 1.6 FR 1.7 1.6 1.4 1.9 1.8 1.6 1.6 1.6 1.6 1.6 1.6 1.6 IT 1.3 0.3 0.7 1.8 1.9 1.4 1.2 1.2 1.3 1.5 1.5 1.5 CY 1.8 1.7 1.3 1.8 1.9 2.4 2.3 2.2 1.8 1.6 1.4 1.5 LV 1.1 -1.9 1.9 1.9 2.5 1.9 1.5 1.3 0.6 0.3 0.5 0.6 LT 1.3 -0.3 1.8 1.5 2.0 1.7 1.7 1.7 1.3 0.7 0.6 0.8 LU 1.9 2.2 3.3 2.0 1.8 1.8 1.8 1.7 1.7 1.7 1.6 1.7 HU 1.2 0.2 0.6 1.4 1.9 1.9 1.4 1.2 1.0 0.9 0.9 0.9 MT 1.4 1.4 2.0 1.9 2.0 1.9 1.7 1.4 1.1 0.8 0.7 0.9 NL 1.3 1.1 1.6 1.2 1.1 1.1 1.2 1.4 1.4 1.4 1.3 1.3 AT 1.4 1.3 1.7 1.5 1.3 1.3 1.4 1.4 1.4 1.3 1.3 1.3 PL 1.5 4.3 3.3 2.0 1.6 1.5 1.4 1.2 0.8 0.5 0.5 0.6 PT 1.2 -0.2 0.5 1.5 2.0 1.9 1.5 1.3 1.2 1.1 1.1 1.1 RO 1.1 2.0 1.8 1.3 1.3 1.3 1.2 1.1 0.7 0.5 0.6 0.5 SI 1.3 1.8 2.3 1.5 1.6 1.4 1.2 1.0 0.9 0.9 1.1 1.3 SK 1.6 3.5 2.9 3.0 2.5 1.7 1.2 0.9 0.7 0.6 0.7 1.0 FI 1.5 1.8 1.4 1.7 1.3 1.4 1.6 1.6 1.5 1.4 1.4 1.5 SE 1.8 2.1 1.6 1.8 1.8 1.7 1.8 1.8 1.8 1.6 1.5 1.7 UK 1.9 1.2 2.0 2.1 1.9 1.9 1.9 2.0 1.9 1.8 1.7 1.8 NO 1.9 2.7 2.4 2.0 1.8 1.8 1.8 1.9 1.9 1.8 1.7 1.7 EU27 1.4 1.2 1.5 1.7 1.7 1.5 1.4 1.4 1.3 1.3 1.3 1.4 EA17 1.3 1.0 1.2 1.6 1.6 1.4 1.3 1.3 1.2 1.3 1.3 1.4
Table A 17 - Employment (growth rate)
Country AVG 10-60 2010 2015 2020 2025 2030 2035 2040 2045 2050 2055 2060 BE 0.2 0.7 0.5 0.1 0.0 0.1 0.2 0.2 0.2 0.1 0.2 0.2 BG -0.9 -0.8 -0.9 -1.1 -1.0 -0.9 -0.9 -1.1 -1.2 -1.1 -0.8 -0.5 CZ -0.3 -0.1 -0.3 -0.2 -0.2 -0.1 -0.3 -0.3 -0.5 -0.6 -0.5 -0.3 DK 0.0 0.0 -0.3 0.1 0.1 -0.1 -0.1 0.0 0.2 0.2 0.0 0.0 DE -0.6 0.5 0.0 -0.4 -0.8 -1.1 -1.0 -0.7 -0.7 -0.8 -0.8 -0.7 EE -0.6 -2.0 -0.9 -0.2 0.2 -0.1 -0.3 -0.5 -0.8 -1.0 -0.8 -0.4 IE 0.5 -2.7 0.0 1.5 1.8 1.2 0.6 0.3 0.1 0.4 0.7 0.8 EL -0.2 -0.2 0.2 0.5 0.0 -0.2 -0.4 -0.6 -0.6 -0.3 -0.2 -0.1 ES 0.2 -1.1 0.4 1.7 1.7 0.6 -0.1 -0.5 -0.6 -0.4 -0.1 0.0 FR 0.2 0.4 0.0 0.6 0.3 0.1 0.0 0.1 0.0 0.0 0.1 0.1 IT 0.0 0.2 0.3 0.9 0.3 -0.1 -0.3 -0.4 -0.3 -0.1 0.0 -0.1 CY 0.4 0.6 0.3 1.0 0.7 0.7 0.6 0.5 0.1 -0.1 -0.2 -0.1 LV -0.9 -3.0 -0.6 0.1 0.5 -0.4 -0.8 -1.0 -1.4 -1.6 -1.2 -1.0 LT -0.8 -3.3 -1.1 0.0 0.1 -0.5 -0.5 -0.5 -0.7 -1.1 -1.1 -0.7 LU 0.5 2.4 2.1 0.7 0.3 0.2 0.2 0.2 0.2 0.1 0.1 0.1 HU -0.5 -0.7 -0.7 0.5 0.3 -0.3 -0.7 -1.0 -1.0 -0.9 -0.8 -0.7 MT -0.2 1.2 0.6 0.2 0.2 0.1 -0.1 -0.4 -0.7 -0.8 -0.9 -0.7 NL -0.2 0.3 0.3 -0.2 -0.4 -0.5 -0.3 -0.2 -0.1 -0.2 -0.2 -0.3 AT -0.1 0.7 0.2 0.0 -0.2 -0.2 -0.1 -0.1 -0.2 -0.2 -0.3 -0.2 PL -0.6 1.8 0.5 -0.3 -0.6 -0.6 -0.7 -1.0 -1.2 -1.3 -1.2 -0.9 PT -0.3 -1.1 -0.1 0.6 0.6 0.0 -0.4 -0.6 -0.7 -0.6 -0.5 -0.4 RO -1.0 -0.6 -0.8 -0.6 -0.8 -1.0 -1.1 -1.2 -1.4 -1.4 -1.2 -1.1 SI -0.3 -0.1 0.0 0.1 0.0 -0.2 -0.4 -0.6 -0.7 -0.7 -0.5 -0.2 SK -0.6 0.1 -0.7 0.2 0.1 -0.3 -0.8 -1.1 -1.2 -1.2 -1.0 -0.6 FI -0.1 0.4 -0.9 -0.2 -0.2 -0.1 0.1 0.0 0.0 -0.1 -0.1 0.0 SE 0.2 0.9 -0.1 0.3 0.3 0.2 0.3 0.3 0.2 0.1 0.0 0.1 UK 0.3 0.2 0.0 0.4 0.4 0.3 0.4 0.5 0.4 0.2 0.2 0.2 NO 0.4 -0.2 0.8 0.4 0.3 0.3 0.3 0.3 0.3 0.3 0.2 0.2 EU27 -0.1 0.5 0.3 0.3 0.1 -0.2 -0.3 -0.3 -0.3 -0.3 -0.3 -0.2 EA17 -0.1 0.1 0.1 0.4 0.2 -0.2 -0.3 -0.3 -0.3 -0.3 -0.2 -0.2Source: Commission services, EPC.
Table A 18 - Labour input : hours worked (growth rate)
Country AVG 10-60 2010 2015 2020 2025 2030 2035 2040 2045 2050 2055 2060 BE 0.2 0.7 0.5 0.1 0.0 0.1 0.2 0.2 0.2 0.1 0.2 0.2 BG -1.0 -0.8 -1.1 -1.1 -1.0 -0.8 -0.9 -1.1 -1.2 -1.1 -0.8 -0.5 CZ -0.3 -0.1 -0.4 -0.2 -0.2 -0.1 -0.3 -0.3 -0.5 -0.6 -0.5 -0.3 DK 0.0 0.0 -0.3 0.0 0.1 -0.1 -0.1 0.0 0.2 0.2 0.0 0.0 DE -0.6 0.3 -0.1 -0.4 -0.8 -1.1 -1.0 -0.7 -0.7 -0.8 -0.8 -0.7 EE -0.6 -2.4 -0.6 -0.2 0.2 -0.1 -0.3 -0.5 -0.8 -1.0 -0.8 -0.4 IE 0.5 -3.2 -0.3 1.5 1.8 1.2 0.6 0.3 0.1 0.4 0.7 0.8 EL -0.1 0.3 0.2 0.5 0.0 -0.2 -0.4 -0.6 -0.6 -0.3 -0.2 -0.1 ES 0.2 -0.9 0.3 1.7 1.7 0.6 -0.1 -0.5 -0.6 -0.4 -0.1 0.0 FR 0.2 0.4 -0.1 0.6 0.3 0.1 0.0 0.1 0.1 0.0 0.1 0.1 IT 0.1 0.1 0.3 0.9 0.3 -0.1 -0.3 -0.4 -0.3 -0.1 0.0 -0.1 CY 0.4 0.8 0.4 1.0 0.7 0.7 0.6 0.5 0.1 -0.1 -0.2 0.0 LV -1.0 -4.4 -0.9 0.1 0.5 -0.4 -0.8 -1.0 -1.4 -1.6 -1.2 -1.0 LT -0.7 -2.3 -0.2 0.0 0.1 -0.5 -0.5 -0.5 -0.7 -1.1 -1.1 -0.7 LU 0.4 1.5 1.6 0.7 0.3 0.2 0.2 0.2 0.2 0.1 0.1 0.1 HU -0.5 -0.9 -0.8 0.5 0.3 -0.3 -0.7 -1.0 -1.0 -0.9 -0.8 -0.7 MT -0.2 0.4 0.2 0.2 0.2 0.1 -0.1 -0.4 -0.7 -0.8 -0.9 -0.7 NL -0.2 0.1 0.1 -0.2 -0.4 -0.5 -0.3 -0.2 -0.1 -0.2 -0.2 -0.3 AT -0.1 0.1 0.2 0.0 -0.2 -0.2 -0.1 -0.1 -0.2 -0.2 -0.3 -0.2 PL -0.6 1.8 0.3 -0.4 -0.6 -0.6 -0.7 -1.0 -1.2 -1.3 -1.2 -0.9 PT -0.2 -0.5 0.0 0.6 0.5 0.0 -0.4 -0.6 -0.7 -0.6 -0.5 -0.4 RO -1.0 -0.5 -0.7 -0.6 -0.8 -1.0 -1.1 -1.2 -1.4 -1.4 -1.2 -1.1 SI -0.3 0.2 0.0 0.1 0.0 -0.3 -0.4 -0.6 -0.7 -0.7 -0.5 -0.2 SK -0.6 0.2 -0.9 0.2 0.1 -0.3 -0.8 -1.1 -1.2 -1.2 -1.0 -0.6 FI -0.1 0.3 -0.9 -0.2 -0.2 -0.1 0.1 0.0 0.0 -0.1 -0.1 0.0 SE 0.2 1.2 -0.1 0.3 0.3 0.2 0.3 0.3 0.2 0.1 0.0 0.1 UK 0.3 -0.3 0.0 0.4 0.4 0.3 0.4 0.5 0.4 0.2 0.2 0.2 NO 0.4 0.6 0.8 0.3 0.3 0.3 0.3 0.3 0.3 0.3 0.2 0.2 EU27 -0.1 0.1 0.0 0.3 0.1 -0.2 -0.3 -0.3 -0.4 -0.3 -0.3 -0.2 EA17 -0.1 0.0 0.1 0.5 0.2 -0.2 -0.3 -0.3 -0.3 -0.3 -0.2 -0.2
Table A 19 - Labour productivity per hour (growth rate)
Country AVG 10-60 2010 2015 2020 2025 2030 2035 2040 2045 2050 2055 2060 BE 1.4 0.7 1.1 1.3 1.5 1.5 1.5 1.5 1.5 1.5 1.5 1.5 BG 2.3 2.7 3.4 2.3 2.3 2.3 2.3 2.3 2.1 1.9 1.7 1.5 CZ 1.9 2.2 2.5 2.0 1.9 1.8 1.8 1.8 1.8 1.7 1.6 1.5 DK 1.4 0.5 1.4 1.3 1.5 1.5 1.5 1.5 1.5 1.5 1.5 1.5 DE 1.5 0.9 1.3 1.4 1.5 1.5 1.5 1.5 1.5 1.5 1.5 1.5 EE 2.1 1.7 3.0 2.1 2.1 2.1 2.1 2.1 2.0 1.8 1.7 1.5 IE 1.6 1.8 2.2 1.8 1.5 1.5 1.5 1.5 1.5 1.5 1.5 1.5 EL 1.1 -0.6 -0.3 0.7 1.2 1.6 1.6 1.6 1.6 1.6 1.6 1.5 ES 1.4 1.6 1.1 0.7 1.1 1.6 1.6 1.6 1.6 1.6 1.6 1.5 FR 1.5 1.1 1.5 1.4 1.5 1.5 1.5 1.5 1.5 1.5 1.5 1.5 IT 1.3 0.2 0.4 0.9 1.5 1.5 1.5 1.5 1.5 1.5 1.5 1.5 CY 1.4 0.9 0.9 0.8 1.2 1.7 1.7 1.7 1.7 1.6 1.6 1.5 LV 2.1 2.6 2.9 1.9 2.1 2.3 2.3 2.3 2.1 1.9 1.7 1.5 LT 1.9 2.1 2.1 1.5 1.9 2.2 2.2 2.2 2.0 1.9 1.7 1.5 LU 1.5 0.7 1.6 1.4 1.5 1.5 1.5 1.5 1.5 1.5 1.5 1.5 HU 1.7 1.1 1.5 0.9 1.5 2.1 2.1 2.1 2.0 1.8 1.7 1.5 MT 1.7 1.0 1.8 1.7 1.7 1.8 1.8 1.8 1.7 1.7 1.6 1.5 NL 1.5 1.0 1.5 1.4 1.5 1.5 1.5 1.5 1.5 1.5 1.5 1.5 AT 1.5 1.3 1.5 1.5 1.5 1.5 1.5 1.5 1.5 1.5 1.5 1.5 PL 2.2 2.5 2.9 2.3 2.2 2.1 2.1 2.1 2.0 1.8 1.7 1.5 PT 1.4 0.3 0.5 0.9 1.4 2.0 2.0 2.0 1.9 1.8 1.6 1.5 RO 2.1 2.5 2.5 1.9 2.1 2.3 2.3 2.3 2.1 1.9 1.7 1.5 SI 1.6 1.7 2.3 1.4 1.5 1.6 1.6 1.7 1.6 1.6 1.6 1.5 SK 2.3 3.2 3.8 2.8 2.4 2.0 2.0 2.0 1.9 1.8 1.7 1.5 FI 1.7 1.5 2.3 2.0 1.5 1.5 1.5 1.5 1.5 1.5 1.5 1.5 SE 1.5 0.8 1.6 1.5 1.5 1.5 1.5 1.5 1.5 1.5 1.5 1.5 UK 1.6 1.5 2.0 1.7 1.5 1.5 1.5 1.5 1.5 1.5 1.5 1.5 NO 1.6 1.7 1.7 1.7 1.5 1.5 1.5 1.5 1.5 1.5 1.5 1.5 EU27 1.5 1.1 1.5 1.4 1.6 1.6 1.6 1.6 1.6 1.6 1.6 1.6 EA17 1.4 0.9 1.2 1.2 1.5 1.6 1.6 1.6 1.6 1.6 1.5 1.5Source: Commission services, EPC.
Table A 20 - TFP (growth rate)
Country AVG 10-60 2010 2015 2020 2025 2030 2035 2040 2045 2050 2055 2060 BE 0.9 0.5 0.6 0.8 1.0 1.0 1.0 1.0 1.0 1.0 1.0 1.0 BG 1.4 0.9 1.5 1.5 1.5 1.5 1.5 1.5 1.4 1.3 1.1 1.0 CZ 1.2 1.4 1.4 1.3 1.2 1.2 1.2 1.2 1.1 1.1 1.0 1.0 DK 0.9 0.4 0.7 0.8 1.0 1.0 1.0 1.0 1.0 1.0 1.0 1.0 DE 0.9 0.5 0.8 0.9 1.0 1.0 1.0 1.0 1.0 1.0 1.0 1.0 EE 1.2 0.1 1.4 1.4 1.4 1.4 1.4 1.4 1.3 1.2 1.1 1.0 IE 1.0 0.4 1.3 1.2 1.0 1.0 1.0 1.0 1.0 1.0 1.0 1.0 EL 0.8 -0.3 0.2 0.5 0.8 1.1 1.1 1.1 1.0 1.0 1.0 1.0 ES 0.8 0.3 0.1 0.4 0.7 1.0 1.0 1.0 1.0 1.0 1.0 1.0 FR 0.9 0.7 0.8 0.9 1.0 1.0 1.0 1.0 1.0 1.0 1.0 1.0 IT 0.8 0.0 0.1 0.6 1.0 1.0 1.0 1.0 1.0 1.0 1.0 1.0 CY 0.8 0.0 0.2 0.5 0.8 1.1 1.1 1.1 1.1 1.1 1.0 1.0 LV 1.2 0.6 1.1 1.2 1.3 1.5 1.5 1.5 1.3 1.2 1.1 1.0 LT 1.1 0.4 0.8 1.0 1.2 1.4 1.4 1.4 1.3 1.2 1.1 1.0 LU 0.9 0.4 0.8 0.9 1.0 1.0 1.0 1.0 1.0 1.0 1.0 1.0 HU 1.0 -0.2 0.2 0.6 1.0 1.4 1.4 1.4 1.3 1.2 1.1 1.0 MT 1.1 0.9 1.0 1.1 1.1 1.2 1.2 1.2 1.1 1.1 1.0 1.0 NL 1.0 0.7 0.9 0.9 1.0 1.0 1.0 1.0 1.0 1.0 1.0 1.0 AT 1.0 0.8 1.0 1.0 1.0 1.0 1.0 1.0 1.0 1.0 1.0 1.0 PL 1.3 1.4 1.6 1.5 1.4 1.4 1.4 1.4 1.3 1.2 1.1 1.0 PT 0.9 0.0 0.2 0.6 0.9 1.3 1.3 1.3 1.2 1.1 1.1 1.0 RO 1.3 1.0 1.1 1.2 1.4 1.5 1.5 1.5 1.4 1.3 1.1 1.0 SI 1.0 0.7 0.8 0.9 1.0 1.1 1.1 1.1 1.1 1.0 1.0 1.0 SK 1.4 2.2 2.0 1.8 1.5 1.3 1.3 1.3 1.2 1.1 1.1 1.0 FI 1.1 1.2 1.5 1.3 1.0 1.0 1.0 1.0 1.0 1.0 1.0 1.0 SE 1.0 0.7 1.0 1.0 1.0 1.0 1.0 1.0 1.0 1.0 1.0 1.0 UK 1.0 1.0 1.2 1.1 1.0 1.0 1.0 1.0 1.0 1.0 1.0 1.0 NO 1.1 1.3 1.2 1.1 1.0 1.0 1.0 1.0 1.0 1.0 1.0 1.0 EU27 1.0 0.6 0.8 0.9 1.0 1.1 1.1 1.1 1.0 1.0 1.0 1.0 EA17 0.9 0.4 0.6 0.8 1.0 1.0 1.0 1.0 1.0 1.0 1.0 1.0
Table A 21 - Capital deepening (contribution to labour productivity growth)
Country AVG 10-60 2010 2015 2020 2025 2030 2035 2040 2045 2050 2055 2060 BE 0.5 0.2 0.4 0.4 0.5 0.5 0.5 0.5 0.5 0.5 0.5 0.5 BG 0.9 1.8 1.9 0.8 0.8 0.8 0.8 0.8 0.7 0.7 0.6 0.5 CZ 0.7 0.8 1.1 0.7 0.7 0.6 0.6 0.6 0.6 0.6 0.6 0.5 DK 0.5 0.1 0.8 0.5 0.5 0.5 0.5 0.5 0.5 0.5 0.5 0.5 DE 0.5 0.4 0.5 0.5 0.5 0.5 0.5 0.5 0.5 0.5 0.5 0.5 EE 0.8 1.6 1.7 0.7 0.7 0.7 0.7 0.7 0.7 0.6 0.6 0.5 IE 0.6 1.4 0.9 0.6 0.5 0.5 0.5 0.5 0.5 0.5 0.5 0.5 EL 0.3 -0.3 -0.4 0.2 0.4 0.6 0.6 0.6 0.6 0.6 0.5 0.5 ES 0.6 1.3 1.0 0.2 0.4 0.6 0.6 0.6 0.6 0.6 0.5 0.5 FR 0.5 0.4 0.8 0.5 0.5 0.5 0.5 0.5 0.5 0.5 0.5 0.5 IT 0.5 0.2 0.3 0.3 0.5 0.5 0.5 0.5 0.5 0.5 0.5 0.5 CY 0.5 0.9 0.7 0.3 0.4 0.6 0.6 0.6 0.6 0.6 0.6 0.5 LV 0.9 2.0 1.8 0.7 0.7 0.8 0.8 0.8 0.7 0.7 0.6 0.5 LT 0.8 1.7 1.3 0.5 0.6 0.8 0.8 0.8 0.7 0.7 0.6 0.5 LU 0.6 0.3 0.8 0.5 0.5 0.5 0.5 0.5 0.5 0.5 0.5 0.5 HU 0.7 1.3 1.2 0.3 0.5 0.7 0.7 0.8 0.7 0.6 0.6 0.5 MT 0.6 0.1 0.7 0.6 0.6 0.6 0.6 0.6 0.6 0.6 0.6 0.5 NL 0.5 0.3 0.6 0.5 0.5 0.5 0.5 0.5 0.5 0.5 0.5 0.5 AT 0.5 0.4 0.6 0.5 0.5 0.5 0.5 0.5 0.5 0.5 0.5 0.5 PL 0.8 1.1 1.3 0.8 0.8 0.7 0.7 0.8 0.7 0.6 0.6 0.5 PT 0.5 0.3 0.3 0.3 0.5 0.7 0.7 0.7 0.7 0.6 0.6 0.5 RO 0.8 1.5 1.5 0.7 0.7 0.8 0.8 0.8 0.8 0.7 0.6 0.5 SI 0.7 1.0 1.5 0.5 0.5 0.6 0.6 0.6 0.6 0.6 0.6 0.5 SK 0.8 1.1 1.8 1.0 0.8 0.7 0.7 0.7 0.7 0.6 0.6 0.5 FI 0.6 0.2 0.8 0.7 0.5 0.5 0.5 0.5 0.5 0.5 0.5 0.5 SE 0.5 0.1 0.6 0.5 0.5 0.5 0.5 0.5 0.5 0.5 0.5 0.5 UK 0.6 0.6 0.8 0.6 0.5 0.5 0.5 0.5 0.5 0.5 0.5 0.5 NO 0.5 0.4 0.6 0.6 0.5 0.5 0.5 0.5 0.5 0.5 0.5 0.5 EU27 0.6 0.5 0.7 0.5 0.6 0.6 0.6 0.6 0.6 0.6 0.6 0.6 EA17 0.5 0.5 0.6 0.4 0.5 0.5 0.6 0.6 0.6 0.5 0.5 0.5Source: Commission services, EPC.
Table A 22 - GDP per capita (growth rate)
Country AVG 10-60 2010 2015 2020 2025 2030 2035 2040 2045 2050 2055 2060 BE 1.2 2.8 1.0 0.8 1.0 1.2 1.3 1.4 1.4 1.4 1.5 1.5 BG 1.9 1.9 2.9 2.0 2.1 2.2 2.0 1.8 1.5 1.4 1.6 1.7 CZ 1.6 1.9 1.8 1.6 1.7 1.8 1.7 1.5 1.4 1.2 1.3 1.5 DK 1.2 -0.1 0.8 1.0 1.3 1.2 1.3 1.5 1.6 1.6 1.5 1.4 DE 1.3 1.2 1.4 1.2 1.0 0.8 1.0 1.3 1.4 1.4 1.4 1.5 EE 1.8 -0.8 2.5 2.1 2.7 2.4 2.1 1.8 1.4 1.1 1.2 1.6 IE 1.3 -2.0 1.2 2.2 2.4 1.8 1.3 1.0 0.9 1.3 1.7 1.9 EL 0.9 -4.0 -0.3 1.1 1.1 1.4 1.2 1.0 1.1 1.4 1.6 1.7 ES 1.3 0.0 1.0 1.9 2.4 1.8 1.2 0.8 0.8 1.2 1.5 1.7 FR 1.4 -0.7 0.9 1.5 1.5 1.3 1.3 1.4 1.5 1.5 1.5 1.6 IT 1.2 -0.8 0.3 1.5 1.6 1.2 1.0 1.0 1.2 1.5 1.7 1.7 CY 1.0 -3.6 0.3 0.6 1.0 1.6 1.7 1.6 1.3 1.1 1.0 1.2 LV 1.8 -0.7 2.4 2.5 3.1 2.5 2.1 1.8 1.3 1.0 1.2 1.4 LT 1.7 0.8 2.3 1.9 2.4 2.1 2.1 2.1 1.7 1.2 1.1 1.4 LU 1.2 -0.4 1.9 1.0 0.9 1.0 1.1 1.1 1.2 1.3 1.3 1.4 HU 1.4 -1.5 0.8 1.5 2.1 2.1 1.7 1.4 1.3 1.2 1.2 1.3 MT 1.6 2.1 1.9 1.7 1.9 2.0 2.0 1.6 1.3 1.1 0.9 1.2 NL 1.2 -0.4 1.2 1.0 0.9 0.9 1.2 1.4 1.6 1.6 1.5 1.4 AT 1.3 0.3 1.4 1.2 1.0 1.1 1.3 1.4 1.4 1.4 1.4 1.4 PL 1.8 1.9 3.2 2.0 1.8 1.9 1.8 1.6 1.2 1.0 1.1 1.3 PT 1.3 -0.5 0.5 1.4 1.9 1.9 1.5 1.4 1.4 1.4 1.4 1.5 RO 1.5 2.2 2.0 1.6 1.6 1.7 1.6 1.5 1.2 1.1 1.2 1.2 SI 1.3 1.2 1.8 1.3 1.5 1.4 1.3 1.1 1.0 1.1 1.4 1.6 SK 1.8 3.0 2.6 2.8 2.5 1.8 1.4 1.1 0.9 0.9 1.1 1.5 FI 1.4 0.9 1.0 1.4 1.1 1.3 1.6 1.6 1.5 1.4 1.4 1.5 SE 1.3 0.8 0.8 1.2 1.3 1.4 1.5 1.5 1.5 1.3 1.2 1.5 UK 1.4 -0.6 1.3 1.4 1.3 1.4 1.5 1.6 1.5 1.4 1.4 1.5 NO 1.3 1.3 1.3 1.2 1.1 1.2 1.3 1.4 1.4 1.4 1.4 1.4 EU27 1.4 0.1 1.2 1.5 1.5 1.4 1.3 1.4 1.4 1.4 1.5 1.6 EA17 1.3 0.0 1.0 1.4 1.5 1.2 1.2 1.2 1.3 1.4 1.5 1.6
Table A 23 - GDP per worker (growth rate)
Country AVG 10-60 2010 2015 2020 2025 2030 2035 2040 2045 2050 2055 2060 BE 1.4 0.7 1.1 1.2 1.5 1.5 1.5 1.5 1.5 1.5 1.5 1.5 BG 2.3 2.6 3.2 2.3 2.3 2.3 2.3 2.3 2.1 2.0 1.7 1.6 CZ 1.9 2.2 2.4 2.0 1.9 1.8 1.8 1.8 1.8 1.7 1.6 1.5 DK 1.4 0.6 1.4 1.3 1.5 1.5 1.5 1.5 1.5 1.5 1.5 1.5 DE 1.5 0.7 1.2 1.4 1.5 1.5 1.6 1.5 1.5 1.6 1.6 1.6 EE 2.1 1.3 3.3 2.1 2.1 2.1 2.1 2.1 2.0 1.8 1.7 1.5 IE 1.6 1.2 1.9 1.7 1.5 1.5 1.5 1.5 1.5 1.6 1.5 1.5 EL 1.2 -0.2 -0.3 0.7 1.2 1.6 1.6 1.6 1.6 1.6 1.6 1.5 ES 1.4 1.8 1.0 0.6 1.1 1.6 1.6 1.6 1.6 1.6 1.6 1.5 FR 1.5 1.1 1.4 1.3 1.5 1.5 1.5 1.5 1.5 1.5 1.5 1.5 IT 1.3 0.1 0.5 0.9 1.5 1.6 1.6 1.6 1.5 1.5 1.5 1.5 CY 1.4 1.1 1.1 0.8 1.2 1.7 1.7 1.7 1.7 1.6 1.6 1.5 LV 2.1 1.2 2.6 1.9 2.1 2.3 2.3 2.3 2.1 1.9 1.7 1.6 LT 2.1 3.2 3.0 1.6 1.9 2.2 2.2 2.2 2.0 1.9 1.7 1.6 LU 1.4 -0.1 1.1 1.4 1.5 1.5 1.5 1.5 1.5 1.5 1.5 1.5 HU 1.7 0.9 1.3 0.9 1.5 2.1 2.1 2.1 2.0 1.9 1.7 1.6 MT 1.6 0.2 1.4 1.6 1.7 1.8 1.8 1.8 1.8 1.7 1.6 1.5 NL 1.5 0.8 1.3 1.4 1.5 1.5 1.5 1.5 1.5 1.6 1.6 1.5 AT 1.5 0.6 1.5 1.5 1.5 1.5 1.5 1.5 1.5 1.5 1.5 1.5 PL 2.2 2.4 2.8 2.3 2.2 2.1 2.2 2.2 2.0 1.9 1.7 1.6 PT 1.5 0.9 0.7 0.9 1.4 1.9 2.0 2.0 1.9 1.8 1.7 1.5 RO 2.1 2.6 2.7 1.9 2.1 2.3 2.3 2.3 2.2 2.0 1.8 1.6 SI 1.7 1.9 2.3 1.4 1.5 1.6 1.7 1.7 1.6 1.6 1.6 1.5 SK 2.3 3.4 3.6 2.7 2.4 2.0 2.0 2.0 1.9 1.8 1.7 1.6 FI 1.7 1.4 2.3 2.0 1.5 1.5 1.5 1.5 1.5 1.5 1.5 1.5 SE 1.5 1.1 1.6 1.5 1.5 1.5 1.5 1.5 1.5 1.5 1.5 1.5 UK 1.5 1.0 2.0 1.6 1.5 1.5 1.5 1.5 1.5 1.5 1.5 1.5 NO 1.6 3.0 1.6 1.7 1.5 1.5 1.5 1.5 1.5 1.5 1.5 1.5 EU27 1.5 0.7 1.2 1.4 1.6 1.7 1.7 1.7 1.7 1.6 1.6 1.6 EA17 1.4 0.9 1.1 1.2 1.5 1.6 1.6 1.6 1.6 1.6 1.6 1.6Source: Commission services, EPC.
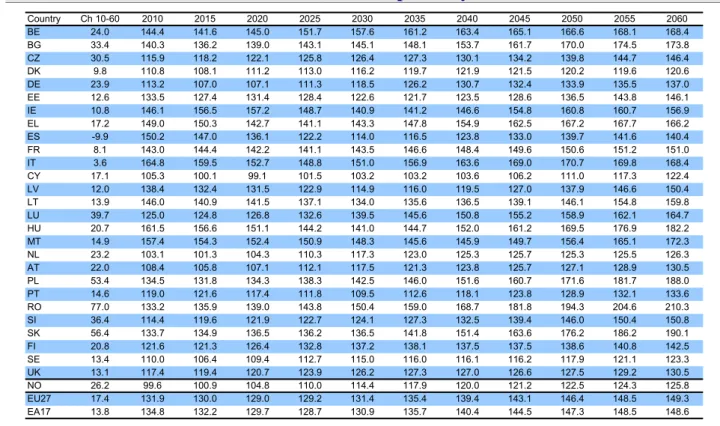
Table A 24 - GDP in 2010 prices (million €)
Country Ch 10-60 2010 2015 2020 2025 2030 2035 2040 2045 2050 2055 2060 BE 460.0 352.3 389.5 419.2 449.9 486.2 528.9 577.1 629.4 685.2 744.8 812.3 BG 36.7 36.0 42.2 46.0 48.9 52.6 56.5 60.4 63.6 66.2 69.2 72.7 CZ 172.1 145.1 163.2 180.0 195.8 213.7 231.8 249.9 267.6 283.2 299.0 317.2 DK 270.8 234.4 254.7 271.3 293.3 315.8 339.2 365.3 396.6 431.9 468.4 505.2 DE 1355.4 2498.8 2737.7 2886.2 3002.9 3088.0 3166.9 3281.2 3426.8 3570.2 3709.1 3854.2 EE 19.4 14.5 16.9 18.6 20.6 23.1 25.3 27.5 29.4 30.9 32.2 33.9 IE 319.4 153.9 165.1 188.5 221.6 257.9 289.9 319.3 347.3 379.6 422.1 473.3 EL 172.9 230.2 231.4 248.6 263.4 280.9 299.7 316.6 333.1 352.6 376.4 403.1 ES 1408.1 1062.6 1163.3 1284.4 1460.7 1656.9 1803.6 1920.8 2023.3 2140.4 2291.3 2470.7 FR 2649.5 1947.6 2176.5 2391.1 2631.0 2859.3 3092.0 3351.4 3629.5 3923.4 4243.3 4597.0 IT 1579.8 1548.8 1648.0 1768.7 1938.8 2099.0 2237.1 2373.2 2520.3 2700.6 2908.7 3128.6 CY 26.5 17.5 19.0 20.8 22.8 25.4 28.5 31.8 35.1 38.1 40.9 44.0 LV 18.0 18.0 20.3 22.1 24.7 27.7 30.0 32.1 33.6 34.3 35.0 36.0 LT 29.6 27.4 31.6 33.7 36.7 40.2 43.5 47.4 51.0 53.4 55.1 57.0 LU 70.3 41.6 49.6 56.2 61.7 67.4 73.6 80.2 87.3 95.0 103.1 111.9 HU 87.5 98.4 105.6 112.2 122.0 134.0 144.8 154.2 162.6 170.6 178.3 185.9 MT 6.7 6.2 6.9 7.5 8.3 9.1 10.0 10.7 11.4 11.9 12.4 12.9 NL 563.5 591.5 652.1 700.4 740.6 781.0 826.1 881.5 944.0 1012.2 1082.2 1155.0 AT 294.9 284.0 313.1 339.0 362.7 386.8 414.1 444.2 476.0 509.3 543.0 578.9 PL 387.1 354.4 429.4 482.1 526.2 567.8 610.5 650.3 680.3 701.7 720.0 741.4 PT 148.8 172.5 172.0 181.8 198.6 219.1 237.9 255.2 271.7 287.5 304.1 321.4 RO 96.2 121.9 139.6 150.6 160.4 171.1 182.1 192.8 200.5 206.7 212.4 218.1 SI 36.4 36.1 41.4 45.2 48.7 52.4 55.9 59.1 62.0 64.8 68.1 72.4 SK 82.3 65.9 77.8 90.6 103.1 114.2 122.2 128.5 133.4 137.5 142.0 148.2 FI 224.6 180.3 206.1 226.2 243.0 259.9 280.4 303.4 327.2 351.6 376.9 404.9 SE 497.5 346.1 389.3 427.0 466.8 509.2 555.8 608.0 665.0 722.7 779.9 843.6 UK 2828.8 1694.5 1928.2 2151.5 2370.1 2599.7 2856.8 3152.5 3477.3 3807.8 4148.7 4523.3 NO 385.7 243.0 275.3 307.0 337.0 368.7 403.0 441.2 483.7 529.3 577.1 628.7 EU27 13842.6 12280.6 13570.5 14749.4 16023.2 17298.3 18543.1 19874.7 21285.3 22769.2 24366.5 26123.2 EA17 9418.4 9204.3 10066.4 10872.9 11778.4 12666.6 13492.2 14362.0 15287.3 16290.7 17400.6 18622.7
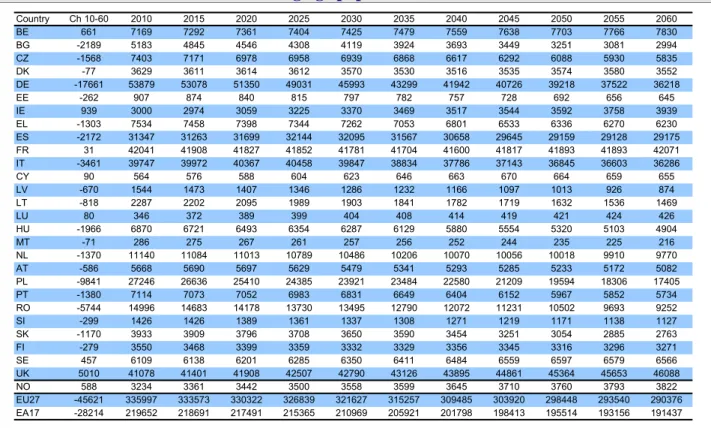
Table A 25 - Working age population (15-64) (thousands)
Country Ch 10-60 2010 2015 2020 2025 2030 2035 2040 2045 2050 2055 2060 BE 661 7169 7292 7361 7404 7425 7479 7559 7638 7703 7766 7830 BG -2189 5183 4845 4546 4308 4119 3924 3693 3449 3251 3081 2994 CZ -1568 7403 7171 6978 6958 6939 6868 6617 6292 6088 5930 5835 DK -77 3629 3611 3614 3612 3570 3530 3516 3535 3574 3580 3552 DE -17661 53879 53078 51350 49031 45993 43299 41942 40726 39218 37522 36218 EE -262 907 874 840 815 797 782 757 728 692 656 645 IE 939 3000 2974 3059 3225 3370 3469 3517 3544 3592 3758 3939 EL -1303 7534 7458 7398 7344 7262 7053 6801 6533 6336 6270 6230 ES -2172 31347 31263 31699 32144 32095 31567 30658 29645 29159 29128 29175 FR 31 42041 41908 41827 41852 41781 41704 41600 41817 41893 41893 42071 IT -3461 39747 39972 40367 40458 39847 38834 37786 37143 36845 36603 36286 CY 90 564 576 588 604 623 646 663 670 664 659 655 LV -670 1544 1473 1407 1346 1286 1232 1166 1097 1013 926 874 LT -818 2287 2202 2095 1989 1903 1841 1782 1719 1632 1536 1469 LU 80 346 372 389 399 404 408 414 419 421 424 426 HU -1966 6870 6721 6493 6354 6287 6129 5880 5554 5320 5103 4904 MT -71 286 275 267 261 257 256 252 244 235 225 216 NL -1370 11140 11084 11013 10789 10486 10206 10070 10056 10018 9910 9770 AT -586 5668 5690 5697 5629 5479 5341 5293 5285 5233 5172 5082 PL -9841 27246 26636 25410 24385 23921 23484 22580 21209 19594 18306 17405 PT -1380 7114 7073 7052 6983 6831 6649 6404 6152 5967 5852 5734 RO -5744 14996 14683 14178 13730 13495 12790 12072 11231 10502 9693 9252 SI -299 1426 1426 1389 1361 1337 1308 1271 1219 1171 1138 1127 SK -1170 3933 3909 3796 3708 3650 3590 3454 3251 3054 2885 2763 FI -279 3550 3468 3399 3359 3332 3329 3356 3345 3316 3296 3271 SE 457 6109 6138 6201 6285 6350 6411 6484 6559 6597 6579 6566 UK 5010 41078 41401 41908 42507 42790 43126 43895 44861 45364 45653 46088 NO 588 3234 3361 3442 3500 3558 3599 3645 3710 3760 3793 3822 EU27 -45621 335997 333573 330322 326839 321627 315257 309485 303920 298448 293540 290376 EA17 -28214 219652 218691 217491 215365 210969 205921 201798 198413 195514 193156 191437Source: Commission services, EPC.
Table A 26 – Working age population growth (15-64)
Country Ch 10-60 2010 2015 2020 2025 2030 2035 2040 2045 2050 2055 2060 BE -0.4 0.6 0.3 0.1 0.1 0.0 0.2 0.3 0.1 0.2 0.1 0.2 BG -1.5 1.2 -1.4 -1.2 -0.9 -0.8 -1.1 -1.4 -1.3 -1.1 -1.0 -0.3 CZ 0.3 -0.4 -0.6 -0.4 0.2 -0.2 -0.3 -1.1 -0.9 -0.6 -0.5 -0.1 DK -1.2 1.0 0.0 0.0 -0.1 -0.4 -0.1 -0.1 0.2 0.2 -0.1 -0.2 DE -0.8 0.2 -0.5 -0.7 -1.1 -1.3 -1.0 -0.5 -0.7 -0.7 -0.9 -0.6 EE -0.1 0.1 -0.8 -0.8 -0.6 -0.3 -0.5 -0.7 -0.9 -1.0 -1.0 0.0 IE 1.8 -1.0 0.1 0.8 1.1 0.8 0.4 0.2 0.0 0.6 1.0 0.8 EL -4.4 4.3 -0.2 -0.2 -0.2 -0.3 -0.7 -0.8 -0.8 -0.4 -0.1 -0.1 ES 0.0 0.0 0.1 0.4 0.2 -0.2 -0.4 -0.7 -0.6 -0.2 0.0 0.0 FR -2.4 2.5 -0.1 0.0 0.0 -0.1 0.0 0.1 0.0 0.0 0.0 0.1 IT -1.0 0.9 0.1 0.1 -0.1 -0.5 -0.5 -0.5 -0.2 -0.1 -0.2 -0.2 CY -6.9 6.9 0.3 0.5 0.5 0.7 0.7 0.5 0.0 -0.2 -0.1 0.0 LV 0.3 -1.0 -1.0 -0.9 -1.0 -0.8 -0.9 -1.2 -1.3 -1.7 -1.7 -0.7 LT 0.4 -0.9 -0.9 -1.0 -1.0 -0.7 -0.7 -0.6 -0.8 -1.2 -1.1 -0.5 LU -5.0 5.0 1.3 0.7 0.4 0.2 0.2 0.3 0.2 0.2 0.1 0.1 HU -2.2 1.5 -0.6 -0.8 -0.3 -0.3 -0.6 -1.2 -1.0 -0.8 -0.8 -0.7 MT 1.3 -1.9 -0.8 -0.5 -0.5 -0.1 -0.1 -0.5 -0.7 -0.8 -1.0 -0.7 NL -1.8 1.6 0.0 -0.3 -0.5 -0.6 -0.6 -0.1 -0.1 -0.1 -0.3 -0.2 AT -1.8 1.4 0.0 0.0 -0.4 -0.6 -0.4 -0.1 -0.1 -0.2 -0.3 -0.3 PL -4.3 3.4 -0.7 -1.0 -0.6 -0.3 -0.5 -1.0 -1.4 -1.6 -1.2 -0.8 PT 0.0 -0.4 -0.1 -0.1 -0.3 -0.5 -0.6 -0.9 -0.7 -0.5 -0.4 -0.4 RO -0.6 -0.2 -0.7 -0.8 -0.5 -0.3 -1.2 -1.3 -1.5 -1.4 -1.4 -0.8 SI -1.0 0.9 -0.3 -0.6 -0.3 -0.4 -0.4 -0.7 -0.9 -0.7 -0.4 -0.1 SK -1.1 0.4 -0.3 -0.6 -0.3 -0.4 -0.4 -1.0 -1.3 -1.3 -1.0 -0.6 FI -0.7 0.6 -0.5 -0.3 -0.2 -0.1 0.1 0.0 -0.1 -0.2 -0.2 -0.1 SE -0.3 0.5 0.1 0.2 0.3 0.1 0.3 0.2 0.2 0.1 -0.2 0.1 UK -1.6 1.9 0.2 0.3 0.2 0.1 0.2 0.5 0.3 0.1 0.1 0.3 NO -1.2 1.4 0.7 0.4 0.4 0.3 0.2 0.3 0.3 0.3 0.1 0.2 EU27 -1.3 1.2 -0.2 -0.2 -0.2 -0.4 -0.4 -0.4 -0.4 -0.3 -0.3 -0.1 EA17 -1.1 1.0 -0.1 -0.1 -0.3 -0.5 -0.5 -0.4 -0.3 -0.2 -0.2 -0.1
Table A 27 – Working age population (20-64) (thousands)
Country Ch 10-60 2010 2015 2020 2025 2030 2035 2040 2045 2050 2055 2060 BE 557 6522 6664 6729 6721 6718 6762 6841 6926 6984 7029 7078 BG -2056 4781 4528 4215 3947 3760 3605 3410 3181 2980 2806 2725 CZ -1491 6803 6705 6484 6362 6344 6312 6103 5812 5605 5418 5312 DK -53 3275 3265 3279 3275 3245 3200 3174 3191 3234 3245 3222 DE -16361 49655 49083 47678 45528 42552 39874 38614 37530 36136 34534 33295 EE -246 829 813 775 739 720 710 694 671 635 596 583 IE 789 2727 2680 2735 2847 2984 3112 3183 3199 3212 3348 3516 EL -1289 6965 6920 6847 6735 6657 6490 6267 6006 5802 5720 5676 ES -2412 29119 29058 29252 29480 29522 29201 28408 27382 26806 26681 26707 FR -161 38084 37914 37790 37701 37589 37541 37490 37731 37782 37749 37923 IT -3426 36792 37050 37344 37347 36822 35930 34918 34268 33939 33670 33366 CY 90 508 528 544 555 568 589 607 615 611 605 598 LV -607 1407 1380 1308 1234 1180 1135 1081 1021 939 851 800 LT -719 2054 2026 1948 1827 1725 1669 1629 1586 1506 1405 1334 LU 73 316 341 357 366 371 374 378 383 385 388 389 HU -1762 6273 6218 6005 5857 5802 5668 5443 5141 4921 4707 4511 MT -61 259 252 247 240 236 235 232 226 217 207 198 NL -1254 10129 10083 10005 9848 9552 9260 9112 9102 9079 8997 8876 AT -504 5169 5236 5270 5207 5057 4911 4858 4855 4810 4754 4665 PL -8830 24772 24633 23636 22416 21857 21568 20898 19722 18179 16861 15942 PT -1268 6551 6517 6476 6438 6321 6167 5936 5684 5497 5387 5283 RO -5261 13768 13578 13119 12643 12444 11823 11202 10423 9720 8923 8507 SI -298 1322 1330 1295 1251 1222 1200 1172 1125 1077 1038 1024 SK -1042 3574 3620 3533 3420 3346 3304 3195 3017 2829 2657 2532 FI -259 3216 3164 3103 3047 3009 3003 3034 3033 3009 2987 2957 SE 434 5481 5628 5661 5689 5725 5761 5833 5937 5988 5952 5915 UK 4369 37178 37750 38340 38515 38612 38834 39574 40575 41062 41238 41547 NO 535 2912 3038 3129 3173 3212 3238 3280 3348 3400 3427 3447 EU27 -43048 307530 306964 303976 299237 293939 288236 283288 278343 272941 267753 264482 EA17 -27071 201738 201253 199980 197472 193246 188661 184940 181753 178809 176346 174666Source: Commission services, EPC.
Table A 28 – Working age population growth (20-64)
Country Ch 10-60 2010 2015 2020 2025 2030 2035 2040 2045 2050 2055 2060 BE -0.5 0.8 0.3 0.1 0.0 0.0 0.2 0.3 0.2 0.2 0.1 0.2 BG -3.8 3.5 -1.4 -1.4 -1.2 -0.8 -1.0 -1.3 -1.4 -1.3 -1.1 -0.3 CZ -0.1 0.0 -0.5 -0.6 -0.1 -0.1 -0.2 -1.0 -0.9 -0.7 -0.6 -0.1 DK -0.8 0.6 0.2 0.1 0.0 -0.4 -0.1 -0.1 0.2 0.2 0.0 -0.2 DE -1.3 0.6 -0.6 -0.7 -1.1 -1.4 -1.1 -0.4 -0.7 -0.8 -0.9 -0.6 EE -1.5 1.5 -0.8 -1.0 -0.9 -0.3 -0.4 -0.5 -0.8 -1.2 -1.2 0.0 IE 1.7 -0.8 -0.1 0.7 0.8 1.0 0.7 0.3 -0.1 0.4 1.0 0.9 EL -4.5 4.3 -0.1 -0.3 -0.4 -0.3 -0.6 -0.8 -0.9 -0.5 -0.2 -0.1 ES -0.1 0.1 0.0 0.2 0.1 0.0 -0.3 -0.7 -0.7 -0.2 0.0 0.0 FR -2.3 2.5 -0.2 0.0 -0.1 -0.1 0.0 0.1 0.0 0.0 0.0 0.1 IT -1.1 1.0 0.1 0.1 -0.1 -0.4 -0.5 -0.6 -0.3 -0.2 -0.2 -0.1 CY -5.1 5.0 0.7 0.6 0.3 0.6 0.7 0.6 0.0 -0.2 -0.2 -0.1 LV -0.9 0.2 -0.9 -1.1 -1.2 -0.8 -0.8 -1.0 -1.3 -1.9 -1.8 -0.7 LT -0.5 -0.1 -0.7 -0.9 -1.4 -0.8 -0.6 -0.4 -0.7 -1.3 -1.3 -0.6 LU -5.0 5.0 1.3 0.8 0.4 0.1 0.2 0.3 0.2 0.2 0.1 0.1 HU -2.3 1.5 -0.4 -0.9 -0.3 -0.2 -0.6 -1.2 -1.0 -0.9 -0.9 -0.7 MT 0.8 -1.6 -0.6 -0.4 -0.6 -0.2 0.0 -0.4 -0.7 -0.8 -1.1 -0.8 NL -1.9 1.6 -0.1 -0.2 -0.5 -0.6 -0.7 -0.1 0.0 -0.1 -0.3 -0.2 AT -1.7 1.3 0.2 0.0 -0.4 -0.7 -0.5 -0.1 -0.1 -0.2 -0.3 -0.4 PL -4.7 3.9 -0.5 -1.0 -0.9 -0.3 -0.3 -0.9 -1.3 -1.7 -1.4 -0.9 PT -0.1 -0.2 -0.2 -0.1 -0.2 -0.5 -0.6 -0.9 -0.8 -0.5 -0.4 -0.4 RO -1.5 0.6 -0.7 -0.8 -0.6 -0.2 -1.2 -1.3 -1.5 -1.5 -1.5 -0.8 SI -1.3 1.2 -0.2 -0.7 -0.6 -0.4 -0.3 -0.6 -0.9 -0.8 -0.6 -0.1 SK -1.9 1.2 -0.1 -0.6 -0.5 -0.3 -0.3 -0.9 -1.2 -1.3 -1.2 -0.7 FI -0.6 0.4 -0.3 -0.4 -0.3 -0.2 0.1 0.1 0.0 -0.2 -0.2 -0.1 SE -0.7 0.8 0.4 0.0 0.2 0.0 0.3 0.3 0.3 0.1 -0.3 0.1 UK -1.4 1.6 0.3 0.2 0.1 0.0 0.2 0.5 0.4 0.1 0.1 0.2 NO -1.2 1.3 0.8 0.4 0.3 0.2 0.2 0.3 0.4 0.3 0.1 0.2 EU27 -1.5 1.4 -0.2 -0.2 -0.3 -0.4 -0.4 -0.3 -0.4 -0.4 -0.4 -0.2 EA17 -1.3 1.1 -0.2 -0.1 -0.3 -0.5 -0.5 -0.4 -0.4 -0.3 -0.3 -0.1
Table A 29 - Labour force 15-64 (thousands)
Country Ch 10-60 2010 2015 2020 2025 2030 2035 2040 2045 2050 2055 2060 BE 509 4853 5049 5105 5081 5076 5115 5173 5227 5270 5308 5362 BG -1397 3476 3345 3126 2943 2814 2677 2528 2372 2232 2129 2079 CZ -940 5204 5170 5083 5008 4959 4884 4738 4593 4456 4329 4264 DK -22 2884 2881 2887 2902 2861 2831 2823 2845 2877 2881 2863 DE -12733 41306 41305 40259 38451 36154 34226 33218 32191 30935 29614 28572 EE -185 672 665 639 615 601 589 574 552 522 495 487 IE 563 2088 2073 2117 2201 2293 2371 2403 2403 2427 2533 2650 EL -630 5151 5244 5274 5219 5129 5016 4870 4716 4611 4560 4521 ES -415 23014 23598 24212 24662 24822 24574 23891 23101 22694 22599 22599 FR 1797 29616 29884 30563 31019 30996 30976 31091 31214 31238 31277 31413 IT -557 24718 25454 26328 26581 26224 25646 25061 24716 24545 24372 24161 CY 97 413 439 459 474 489 505 518 521 518 514 511 LV -466 1138 1142 1087 1027 982 941 894 834 762 702 672 LT -552 1624 1608 1549 1463 1384 1334 1301 1262 1194 1120 1072 LU 53 235 255 266 271 274 277 280 282 284 286 288 HU -997 4285 4374 4402 4374 4289 4139 3938 3733 3570 3417 3288 MT -22 174 176 177 179 180 180 177 172 165 158 152 NL -908 8714 8818 8768 8578 8344 8159 8091 8058 8004 7911 7806 AT -312 4254 4320 4323 4260 4179 4136 4124 4104 4060 4001 3942 PL -6229 17923 17809 17376 16821 16282 15717 14957 14006 13032 12247 11694 PT -874 5270 5320 5338 5334 5257 5127 4932 4737 4593 4495 4397 RO -3931 9563 9450 9145 8774 8392 7857 7331 6789 6318 5903 5632 SI -180 1022 1039 1038 1022 998 974 945 909 876 852 842 SK -838 2710 2721 2696 2624 2544 2452 2321 2179 2046 1939 1872 FI -154 2648 2625 2597 2558 2532 2535 2549 2544 2527 2507 2493 SE 543 4832 4978 5057 5116 5156 5206 5281 5361 5396 5371 5375 UK 4383 30976 31619 32050 32375 32597 32980 33713 34436 34774 34983 35359 NO 451 2529 2632 2696 2733 2767 2795 2836 2889 2932 2955 2980 EU27 -24397 238763 241363 241921 239932 235809 231425 227720 223856 219927 216505 214366 EA17 -14789 156856 158986 160159 159129 156092 152859 150217 147627 145316 143422 142067Source: Commission services, EPC.
Table A 30 - Labour force 20-64 (thousands)
Country Ch 10-60 2010 2015 2020 2025 2030 2035 2040 2045 2050 2055 2060 BE 501 4794 4993 5049 5021 5014 5051 5109 5164 5207 5243 5295 BG -1386 3448 3325 3105 2921 2791 2657 2509 2355 2215 2112 2062 CZ -933 5164 5140 5053 4972 4921 4848 4704 4562 4426 4298 4231 DK -9 2674 2673 2687 2700 2667 2634 2619 2639 2673 2681 2665 DE -12316 40032 40133 39170 37423 35147 33222 32239 31251 30028 28737 27715 EE -183 665 660 633 609 594 583 568 547 517 490 482 IE 535 2040 2023 2060 2136 2223 2306 2343 2343 2361 2461 2575 EL -628 5102 5198 5228 5169 5077 4967 4824 4671 4566 4514 4474 ES -450 22624 23225 23801 24214 24371 24159 23501 22714 22294 22182 22174 FR 1775 28977 29253 29916 30365 30328 30311 30435 30563 30584 30618 30752 IT -551 24453 25197 26063 26308 25952 25387 24807 24462 24289 24113 23902 CY 98 406 433 453 468 482 498 510 514 511 507 503 LV -459 1124 1134 1078 1017 972 932 886 827 755 695 665 LT -547 1613 1600 1542 1456 1376 1327 1294 1256 1189 1115 1066 LU 52 232 252 263 268 271 274 277 279 281 283 284 HU -989 4264 4356 4385 4357 4273 4122 3922 3719 3556 3404 3275 MT -20 167 169 172 174 175 175 172 167 161 153 147 NL -855 8109 8202 8144 7997 7767 7575 7500 7469 7424 7346 7254 AT -276 4034 4119 4136 4074 3994 3948 3933 3915 3874 3818 3759 PL -6140 17720 17647 17237 16676 16122 15565 14822 13888 12923 12136 11581 PT -859 5199 5251 5266 5265 5192 5066 4873 4679 4534 4437 4340 RO -3870 9417 9325 9024 8651 8271 7745 7230 6696 6229 5815 5546 SI -180 1005 1023 1022 1004 979 956 928 894 860 836 825 SK -828 2685 2702 2679 2607 2525 2434 2304 2163 2032 1925 1858 FI -147 2545 2531 2507 2463 2433 2435 2450 2448 2433 2413 2398 SE 542 4630 4815 4891 4931 4961 5003 5076 5165 5205 5175 5172 UK 4156 29358 30106 30616 30764 30899 31233 31949 32685 33024 33193 33515 NO 429 2394 2496 2565 2597 2622 2644 2683 2737 2781 2802 2823 EU27 -23964 232480 235485 236181 234011 229778 225413 221784 218034 214152 210697 208516 EA17 -14331 153068 155365 156563 155565 152525 149347 146773 144243 141957 140074 138737
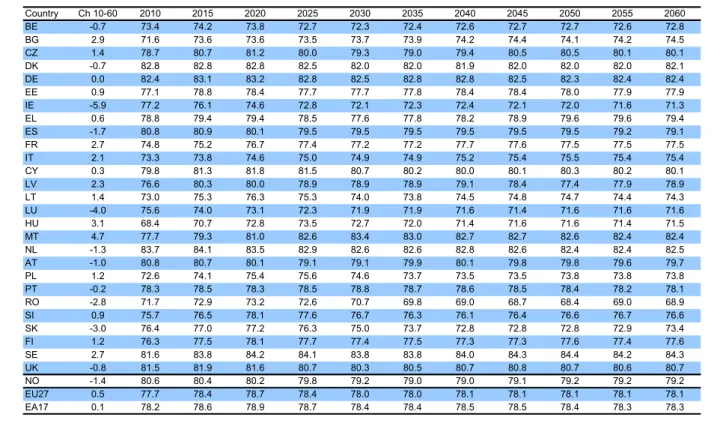
Table A 31 - Participation rate (20-64)
Country Ch 10-60 2010 2015 2020 2025 2030 2035 2040 2045 2050 2055 2060 BE 1.3 73.5 74.9 75.0 74.7 74.6 74.7 74.7 74.6 74.6 74.6 74.8 BG 3.6 72.1 73.4 73.7 74.0 74.2 73.7 73.6 74.0 74.3 75.3 75.7 CZ 3.7 75.9 76.7 77.9 78.2 77.6 76.8 77.1 78.5 79.0 79.3 79.7 DK 1.1 81.6 81.9 81.9 82.4 82.2 82.3 82.5 82.7 82.7 82.6 82.7 DE 2.6 80.6 81.8 82.2 82.2 82.6 83.3 83.5 83.3 83.1 83.2 83.2 EE 2.5 80.2 81.1 81.7 82.3 82.5 82.1 81.8 81.5 81.5 82.3 82.7 IE -1.6 74.8 75.5 75.3 75.0 74.5 74.1 73.6 73.2 73.5 73.5 73.2 EL 5.6 73.2 75.1 76.4 76.7 76.3 76.5 77.0 77.8 78.7 78.9 78.8 ES 5.3 77.7 79.9 81.4 82.1 82.6 82.7 82.7 83.0 83.2 83.1 83.0 FR 5.0 76.1 77.2 79.2 80.5 80.7 80.7 81.2 81.0 81.0 81.1 81.1 IT 5.2 66.5 68.0 69.8 70.4 70.5 70.7 71.0 71.4 71.6 71.6 71.6 CY 4.3 79.9 82.0 83.2 84.4 84.8 84.6 84.1 83.6 83.7 83.8 84.2 LV 3.3 79.9 82.1 82.4 82.4 82.4 82.1 81.9 81.0 80.5 81.7 83.1 LT 1.4 78.5 79.0 79.2 79.7 79.8 79.5 79.5 79.2 78.9 79.3 79.9 LU -0.5 73.5 73.9 73.6 73.2 73.1 73.3 73.1 72.9 72.9 72.9 73.0 HU 4.6 68.0 70.1 73.0 74.4 73.6 72.7 72.1 72.3 72.3 72.3 72.6 MT 10.0 64.3 67.3 69.7 72.5 74.3 74.4 74.1 74.0 73.9 73.9 74.3 NL 1.7 80.0 81.3 81.4 81.2 81.3 81.8 82.3 82.1 81.8 81.7 81.7 AT 2.5 78.0 78.7 78.5 78.3 79.0 80.4 81.0 80.6 80.5 80.3 80.6 PL 1.1 71.5 71.6 72.9 74.4 73.8 72.2 70.9 70.4 71.1 72.0 72.6 PT 2.8 79.4 80.6 81.3 81.8 82.1 82.1 82.1 82.3 82.5 82.4 82.1 RO -3.2 68.4 68.7 68.8 68.4 66.5 65.5 64.5 64.2 64.1 65.2 65.2 SI 4.5 76.0 76.9 78.9 80.3 80.1 79.7 79.2 79.4 79.9 80.5 80.6 SK -1.8 75.1 74.7 75.8 76.2 75.5 73.7 72.1 71.7 71.8 72.4 73.4 FI 2.0 79.1 80.0 80.8 80.8 80.9 81.1 80.8 80.7 80.9 80.8 81.1 SE 3.0 84.5 85.5 86.4 86.7 86.7 86.8 87.0 87.0 86.9 87.0 87.4 UK 1.7 79.0 79.8 79.9 79.9 80.0 80.4 80.7 80.6 80.4 80.5 80.7 NO -0.3 82.2 82.1 82.0 81.8 81.6 81.7 81.8 81.8 81.8 81.8 81.9 EU27 3.2 75.6 76.7 77.7 78.2 78.2 78.2 78.3 78.3 78.5 78.7 78.8 EA17 3.6 75.9 77.2 78.3 78.8 78.9 79.2 79.4 79.4 79.4 79.4 79.4Source: Commission services, EPC.
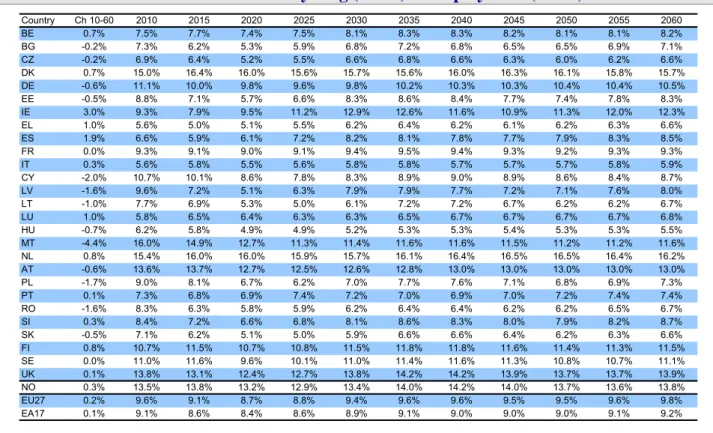
Table A 32 - Participation rate (15-64)
Country Ch 10-60 2010 2015 2020 2025 2030 2035 2040 2045 2050 2055 2060 BE 0.8 67.7 69.2 69.4 68.6 68.4 68.4 68.4 68.4 68.4 68.3 68.5 BG 2.4 67.1 69.0 68.8 68.3 68.3 68.2 68.4 68.8 68.7 69.1 69.4 CZ 2.8 70.3 72.1 72.9 72.0 71.5 71.1 71.6 73.0 73.2 73.0 73.1 DK 1.1 79.5 79.8 79.9 80.3 80.2 80.2 80.3 80.5 80.5 80.5 80.6 DE 2.2 76.7 77.8 78.4 78.4 78.6 79.0 79.2 79.0 78.9 78.9 78.9 EE 1.5 74.1 76.1 76.0 75.5 75.4 75.4 75.7 75.8 75.5 75.5 75.6 IE -2.3 69.6 69.7 69.2 68.2 68.0 68.3 68.3 67.8 67.6 67.4 67.3 EL 4.2 68.4 70.3 71.3 71.1 70.6 71.1 71.6 72.2 72.8 72.7 72.6 ES 4.0 73.4 75.5 76.4 76.7 77.3 77.8 77.9 77.9 77.8 77.6 77.5 FR 4.2 70.4 71.3 73.1 74.1 74.2 74.3 74.7 74.6 74.6 74.7 74.7 IT 4.4 62.2 63.7 65.2 65.7 65.8 66.0 66.3 66.5 66.6 66.6 66.6 CY 4.8 73.2 76.3 77.9 78.6 78.4 78.2 78.0 77.9 78.1 78.0 78.0 LV 3.2 73.7 77.5 77.2 76.3 76.4 76.4 76.6 76.0 75.2 75.8 76.9 LT 2.0 71.0 73.0 73.9 73.5 72.7 72.5 73.0 73.4 73.2 73.0 73.0 LU -0.4 67.9 68.4 68.4 68.0 67.8 67.8 67.6 67.4 67.5 67.5 67.5 HU 4.7 62.4 65.1 67.8 68.8 68.2 67.5 67.0 67.2 67.1 67.0 67.1 MT 9.6 60.7 63.8 66.3 68.7 70.2 70.4 70.3 70.3 70.3 70.2 70.3 NL 1.7 78.2 79.6 79.6 79.5 79.6 79.9 80.3 80.1 79.9 79.8 79.9 AT 2.5 75.0 75.9 75.9 75.7 76.3 77.4 77.9 77.7 77.6 77.4 77.6 PL 1.4 65.8 66.9 68.4 69.0 68.1 66.9 66.2 66.0 66.5 66.9 67.2 PT 2.6 74.1 75.2 75.7 76.4 77.0 77.1 77.0 77.0 77.0 76.8 76.7 RO -2.9 63.8 64.4 64.5 63.9 62.2 61.4 60.7 60.4 60.2 60.9 60.9 SI 3.0 71.7 72.9 74.7 75.1 74.7 74.5 74.3 74.6 74.8 74.9 74.7 SK -1.1 68.9 69.6 71.0 70.8 69.7 68.3 67.2 67.0 67.0 67.2 67.8 FI 1.7 74.6 75.7 76.4 76.1 76.0 76.1 75.9 76.0 76.2 76.1 76.2 SE 2.8 79.1 81.1 81.5 81.4 81.2 81.2 81.4 81.7 81.8 81.6 81.9 UK 1.3 75.4 76.4 76.5 76.2 76.2 76.5 76.8 76.8 76.7 76.6 76.7 NO -0.2 78.2 78.3 78.3 78.1 77.8 77.7 77.8 77.9 78.0 77.9 78.0 EU27 2.8 71.1 72.4 73.2 73.4 73.3 73.4 73.6 73.7 73.7 73.8 73.8 EA17 2.8 71.4 72.7 73.6 73.9 74.0 74.2 74.4 74.4 74.3 74.3 74.2