Open Archive TOULOUSE Archive Ouverte (OATAO)
OATAO is an open access repository that collects the work of Toulouse researchers and
makes it freely available over the web where possible.
This is an author-deposited version published in :
http://oatao.univ-toulouse.fr/
Eprints ID : 18145
To link to this article : DOI:
10.1016/j.minpro.2016.07.002
URL : http://dx.doi.org/10.1016/j.minpro.2016.07.002
To cite this version :
Dubey, R.K. and Climent, Éric and Banerjee,
Chandranath and Majumder, Arun Kumar Performance monitoring
of a hydrocyclone based on underflow discharge angle. (2016)
International Journal of Mineral Processing, vol. 154. pp. 41-52.
ISSN 0301-7516
Any correspondence concerning this service should be sent to the repository
administrator: staff-oatao@listes-diff.inp-toulouse.fr
Performance monitoring of a hydrocyclone based on underflow
discharge angle
R.K. Dubey
a, Eric Climent
b, C. Banerjee
a, A.K. Majumder
a,⁎
aDepartment of Mining Engineering, Indian Institute of Technology Kharagpur, Kharagpur – 721302, India bInstitut de Mécanique des Fluides de Toulouse (IMFT), Université de Toulouse, CNRS-INPT-UPS, Toulouse, France
a b s t r a c t
The performance of a hydrocyclone as a separation device is never perfect and rigorous research efforts are still continuing along various directions towards achieving optimum solutions. The modus operandi of performance optimization is important for quick and non-invasive monitoring of hydrocyclone performance. Therefore, in the present study, an application potential of spray angle as a performance monitoring tool has been explored to in-vestigate the operation state of a hydrocyclone. In this context, phenomenological features of spray discharge over a wide range of injection pressure and feed solid concentration have been investigated. The emphasis of the present study is to verse the amendment of the hydrocyclone operational state with the corresponding change in underflow discharge pattern. The pattern of the underflow discharge profile was captured using a dig-ital camera and analyzed based on an image processing algorithm to detect the discharge angle under different operating and design conditions. Stability and reproducibility of the spray angle at fixed operating condition have also been confirmed. Subsequent analysis shows that the spray angle is sensitive to variations of operating and design variables. More specifically the effect of feed slurry concentration has been characterized and is of major importance for the transition to roping. On this basis, an attempt has also been made to develop an empir-ical correlation based on experimental data. The developed correlation shows that the discharge angle could pos-sibly be used as a reliable tool to monitor hydrocyclone performance.
Keywords: Hydrocyclones Spray angle Image analysis Performance monitoring 1. Introduction
It has been long advocated that spray angle can be used as a perfor-mance monitoring tool for hydrocyclone. Various works have also been carried out in the past which indicate the significance of using underflow discharge pattern as one of the most important process con-trol technique as an alternative to various empirical (Marlow, 1973; Lynch and Rao, 1975; Plitt, 1976; Nageswararao, 1978; Castro, 1990) and theoretical (Hsieh and Rajamani, 1991; Barrientos and Concha, 1992; Monredon et al., 1992) modeling techniques, which suffers from inherent limitations of their own (Neesse, Schneider, Dueck, et al., 2004a; Neesse, Schneider, Golyk and Tiefel, 2004b; Petersen et al., 1996; Van Deventer et al., 2003). Industrial application of using spray angle as an indicator is also advantageous as the spray pattern is easily visible and spigot diameter is the only design variable which can be eas-ily replaced.
Using the underflow discharge angle as an indicator for monitoring the performance of a hydrocyclone, it was imperative to convert the dis-charge pattern from the underflow of a hydrocyclone in a quantifiable parameter. Various attempts were made in the past to achieve similar
conclusions using various mathematical, theoretical and visualization techniques.Van Deventer et al. (2003)andNeesse, Schneider, Dueck, et al. (2004a)proposed that the flow geometry of the spray discharge arises from velocity pattern at the outlet orifice of the underflow. To cal-culate the spray angle, simulated values of the radial, axial and azimuth-al velocities at underflow exit were used. An attempt was made to develop a tool to control underflow discharge using a two-dimensional electrical impedance tomography (Williams et al., 1997). A technique, based on the measurement of the pressure exerted by the underflow to monitor the spray angle was proposed (Viljoen, 1993).Petersen et al. (1996)andVan Vuuren et al. (2011)also made attempts to measure spray angles and spray width respectively using image processing tech-niques. Spray angle is an important factor to be considered when inves-tigating spray shape in a pressure swirl atomizer. It was calculated using ‘Image J software’ and was further linked with design and operating var-iables (Rashid et al., 2012). However, none of the above-mentioned techniques have found the day of light in industrial application probably due to lack of versatility and huge financial aspect associated. The meth-od we propose, has more prospects for industrial implementation due to its limited cost and the technology required is simple.
An image processing based algorithm on MATLAB™ platform to quantify the discharge profile in terms of spray angle in a 2-inch Tega hydrocyclone running with water only was demonstrated by
⁎ Corresponding author.
E-mail address:akm@mining.iitkgp.ernet.in(A.K. Majumder).
Mazumdar et al. (2014). It was established that spray angle is stable and reproducible at a given operating condition to be used as an indicator for performance monitoring and control. It was further correlated and an empirical model was developed with variables affecting the formation of spray angle. It was concluded that the spray angle varies with the change in operating and design parameters with water only condition. In view of the above, a systematical analysis of underflow spray angle as a performance monitoring tool in case of hydrocyclone running with slurry is investigated. Hence, an attempt has been made in the the-oretical understanding of the hydrodynamics of spray formation and to confirm adaptability of the algorithm as described byMazumdar et al. (2014)in the case of hydrocyclone running with slurry. The image pro-cessing based technique was then adopted to measure the underflow discharge angle of a hydrocyclone treating various concentrations of fine silica slurries. For fixed operating conditions, the spray stability has been demonstrated to establish the steady nature of the spray angle inSection 3. The change in the spray angle at different operating conditions is correlated with the process and design variables of the hydrocyclone affecting the spray formation. An empirical correlation has also been derived based on multivariate regression analysis and rel-evant statistical analysis has been discussed in brief to verify the devel-oped model. In the end, the reliability of the empirical model develdevel-oped has also been verified with random experimental data inSection 5. The detailed description of these forms the subject matter of this article.
2. Hydrodynamics of spray formation
Before going into the details of the experimental methodology and analogous observations, it is necessary to discuss in brief the hydrody-namic aspects of spray formation.
Mechanism of spray formation through pressure nozzles is a very popular and developed research topic in the fluid mechanics domain. The first atomizer spray angle equation was developed by Taylor, 1948 (Van Deventer et al., 2003),
Cosθ ¼uU ¼x þ ffiffiffi 2 p yz2 1−z2 ð Þ3=2 1 2 1 z2−1 " # þ ln zð Þ $ % ð1Þ
All parameters of this relation are defined in the nomenclature sec-tion. It has been inherently identified that the separation characteristics in a hydrocyclone are basically governed by the centrifugal action. In a hydrocyclone, fluid rotates about an axis and forms a spiral vortex which moves in the downward direction and near the spigot the fluid changes its direction and forms an inner spiral which moves in the up-ward direction along the axis of the cyclone. The characteristics of the vortex formed inside the hydrocyclone are a compound vortex combi-nation of free and forced vortex also known as Rankine vortex. This con-sists of a rotational vortex core with constant angular velocity encompassed by an irrotational vortex.
The geometric features of the underflow discharge profile are essen-tially dependent on the patterns of exit velocity components. Two major features, the axial and azimuthal velocities are responsible in contribut-ing to the resultcontribut-ing spray formation. However, in the spray condition the azimuthal velocity is in a direction perpendicular to the outlet. Visual in-spection of hydrocyclone operation reveals that the pulp flow at the
underflow exit in a predominantly tangential orientation (Van
Deventer et al., 2003). At the spigot exit where spray forms the axial ve-locity is perpendicular to the tangential component.
The spray angle θ was mathematically described by an equation pro-posed byNeesse, Schneider, Dueck, et al. (2004a),
θ¼ arctanwu ¼arctan ρm Du& 2 μmu w2 " # ð2Þ
In simpler terms, hydrocyclone separation process is accomplished with the highly turbulent swirling flow generated by the inlet fluid at high Reynolds number. As the fluid comes out of the spigot in the form of underflow discharge, particles compete with the amount of cen-trifugal force generated at the exit (azimuthal velocity), the axial flow and gravitational force. The lighter/smaller particles tend to follow the path dictated by swirling water, whereas the heavier/coarser particles are dominated by the gravitational force. Therefore, particle size distri-bution reporting to the underflow also affects the spray formation phe-nomenon. Another factor is the amount of water and solid reporting, also called underflow slurry density. Lesser water/more solid fractions will increase the dominance of gravitational force and spray will tend to follow the rope like discharge profile, whereas, in case of more water/less solid, swirling intensity will dominate resulting in a spray like discharge (umbrella shape). For this transition from spray like dis-charge to roping both the slurry density and viscosity (mixture equiva-lent viscosity) are important. This has been observed both in experiments and numerical simulations in the dense regime (Davailles et al., 2012). Geometric parameters as the diameter of the vortex and spigot will control the amount of water/solid reporting to underflow in combination with other operating and geometric parameters. There-fore, the underflow discharge pattern of a hydrocyclone is inherently as-sociated with the intensity of fluid flow quantified in terms of inlets Reynolds number; feed solid concentration as well as the geometric configuration of the hydrocyclone. The detail dependency of each of Nomenclature
A level of significance
Ac Effective cross sectional area for underflow (m2)
Ai Feed inlet area (m2)
B/P Bypass flow
d Equivalent diameter of inlet (m)
da Air core diameter in the spigot region (m)
Do Vortex finder diameter (m)
Du Spigot diameter (m)
k No of independent variable
K,a,b,c,d Constants
n No. of observation for each k
Pg Pressure gauge
Qi Feed inlet volumetric flow rate (m3.s− 1)
Qu Underflow volumetric flow rate (m3.s− 1)
RS Fraction of feed solid to underflow
Rf Fraction of feed water to underflow
RV Volumetric recovery of slurry to underflow w.r.t. feed
Rei Inlet Reynolds number
U Overall head velocity (m.s− 1)
u Velocity component in axial direction (m.s− 1)
v Velocity component in radial direction (m.s− 1)
vi Feed inlet velocity (m.s− 1)
V1 Feed inlet pressure control valve
V2 Bypass valve
w Velocity component in tangential direction (m.s−1)
x Axial velocity/overall velocity at the outlet
y Angular velocity/(outlet radius X overall head velocity) z Air core radius/outlet radius at the outlet
Greek letters
θ Underflow discharge spray angle (degree)
λ Ratio of underflow pulp density to feed pulp density μ Viscosity of the inlet feed slurry(Pa.s) at 30 °C μ0 Viscosity of water(Pa.s) at 30 °C
μu Viscosity of underflow slurry (Pa.s) at 30 °C
ρ Density of the inlet feed (kg/m3)
the above controlling parameters on the spray formation is explained in subsequent sections.
However, before exploring the above-mentioned parameters, it is important to establish the competency of the experimental method adopted and whether the spray angle remains stable and is reproducible
under a fixed operating condition to be used as a performance monitor-ing tool.
3. Materials and methods 3.1. Experimental test rig
A closed circuit 2-inch Tega hydrocyclone having 7° cone angle test rig consisting of pump and sump assembly was used for generating the experimental data set. Before carrying out an experiment, pre-de-termined quantities of feed silica sand (mono-density, S.G. 2.56) and water were mixed in the slurry tank to maintain the desired feed slurry concentration. Slurry feed rate to the separator and the pressure at the inlet were adjusted using the bypass valve. The fixed parameters (for the present study) are shown inTable 1and the range of variables used in experiments have been illustrated inTable 2. The particle size distribution is given inTable 3.
The sketch of the experimental setup is illustrated inFig. 1(a) and the design dimension of the hydrocyclone is shown in theFig. 1(b). As we are concentrating on underflow discharge pattern, so, any type of vi-bration in test rig or/and due to the internal flow pattern affect the angle measurement precision. Vibrations are inherent to hydrocyclone inter-nal flow structure due to the presence of highly turbulent vortex dy-namics, particle impact, air core instabilities and discharge oscillations (Neesse and Dueck, 2007; Sripriya et al., 2007). Special care was taken to minimize vibrations of the test rig which is permanently mounted on the floor and rubber gaskets are used between the bolting system (pump and motor with test rig). The top and bottom sections of the hydrocyclone body were properly clamped.
3.2. Experimental procedure
A series of experiments were conducted in an attempt to character-ize the trends of spray angle with various operating and design variables and their mutual responses at different experimental conditions as mentioned inTables 1 and 2. One variable (other fixed) at a time exper-imentation technique is adopted for generating required data. Repeat experiments are also carried out at arbitrarily selected operating
Table 2
Design and operating variables (experimental study). Du(m) Do(m) FIP(N/m2
) Feed conc. (%w/w) 0.008 0.0032 68948–344740 1–7 0.008 0.0045 1–12.5 0.011 0.0045 1–12.5 0.011 0.0064 1–20 0.014 0.0045 1–5 0.014 0.0064 1–10 Table 1
Fixed parameters used in experiments.
Fixed parameter Value
Hydrocyclone diameter (mm) 50.8
Cone angle (degree) 7
Inlet area (mm2
) 9×6
Feed: Silica Sand (d50and d90in μm) 15 and 35.5
Table 3
Size distribution of the particles in the feed.
Diameter(μm) Particle percentage
N 45 3.45 35–45 6.64 30–35 4.65 25–30 10.85 20–25 11.23 15–20 10.34 10–15 16.88 5–10 16.93 b 5 19.03 Total 100.00
conditions. Timed samples of underflow and overflow were also taken. Thereafter, to remove the water from sampled slurry, filtration was car-ried out using pressure filter (FLSmidth, R 101833). Subsequently to completely remove the moisture from the filtered sample, hot air oven was used and samples were dried for 1–2 h at 110 °C. Finally, employing MALVERN Laser particle size analyzer, the size distribution of underflow, as well as overflow sample materials, were estimated. The temperature of feed slurry was maintained between 30 °C and 35 °C during the experimental tests. The above-mentioned procedure was repeated for each set of experiment.
The algorithm as developed byMazumdar et al. (2014)was initially tested on hydrocyclone running with water only. The accuracy and ro-bustness of the algorithm were established in the case of water. There-fore, an attempt was made to validate the usability of the mentioned algorithm in case of hydrocyclone running at various feed solid concen-trations. To do so, images of the underflow spray profile were captured using a digital camera (Sony-DSC HX-300, 50× zoom, 20.4 MP). The po-sition of the camera was kept perpendicular to the projection of spray at
the same level. The spray angle was measured from captured image based on edge detection technique using image processing algorithm developed on the MATLAB™ platform. The detail methodology of the image reconstruction and post-processing techniques has been report-ed elsewhere (Mazumdar et al., 2014), however, a brief overview is given in the next sub-section.
The camera was fixed to a stationary system, separate from the in-fluence of equipment vibrations. At the time of capturing the image of underflow discharge shape, the camera was placed at a fixed distance (~ 2 m) from the test rig to avoid damage to the lens of the camera. This has also a benefit for image processing because parallax error is re-duced. At larger distances, the images tend to blur and proper distinc-tion of the pixel could not be achieved, which is very important for processing the image. A contrast background was used while capturing the image of the profile. This contrast background helped in creating a marked pixel intensity difference and assisted in recognizing the boundaries of the spray. Using this contrast background one would en-sure that irrespective of the color of the slurry, processing of the image would be possible. Due to the vibrational effect (although minimized), any kind of displacement and/or rotation in underflow discharge pat-tern were handled through image registration during image processing. Ten images were taken at each operating condition at a rate of one frame per second to calculate the standard deviation in the developed measurement technique The algorithm was found to be working effi-ciently in the case of slurry, as well. The spray angle calculated was sta-tistically reproducible and evolved with changing operating conditions.
Fig. 2. Various steps involved to measure the UF discharge angle (a) RGB image (b) gray scale image (c) binary image (d) L.H.S coordinate (e) R.H.S coordinate (f) traced boundary.
Fig. 3. Variation of spray angle at different time intervals at a fixed operating condition (standard deviations are indicated by vertical error bars).
Table 4
Error estimation within measured spray angle with water and slurry using Do = 0.011 m and Du = 0.0064 m.
UF discharge angle
Time(min) Water only Slurry (5% by wt.)
5 65.987 62.267 10 64.998 60.343 15 63.893 60.371 20 62.359 60.784 25 65.898 61.811 Avg. 64.627 61.115 S.D. 1.523 0.876
3.2.1. Image reconstruction and post processing
A digital image, as captured by the camera (RGB image,Fig. 2(a)) was converted into a grayscale image (Fig. 2(b)) to reduce the amount of memory required and processing time. Subsequently, the converted grayscale image has pixel intensity between 0 and 255 (for an eight-bit image). The grayscale image is hence converted to a binary image (Fig. 2(c)) using a global threshold value. The global threshold value is automatically generated by MATLAB™ using the method described by
Otsu (1979). This thresholding helps in binarizing the image into pixel intensity values of either 0 or 1. The contrast background helps in segmenting the region of interest and essentially distinguishes the spray boundary from the background. Each side of the region of interest, X, Y coordinates (Fig. 2(d, e)) are selected and loop traversed towards the region of interest. As soon as the pixel intensity value is changed from 0 to 1, the boundary is detected. Next by tracing the boundary of the spray from both sides (using the ‘bwtraceboundary’ function), a vec-tor equation is developed from the coordinates of the traced pixel of the boundary (Fig. 2(f)). The dot product of the two vector equations gives the spray angle. The average of 10 measured angle was considered the specific spray angle at a particular design and operating condition. This above procedure was repeated for each set of experimental condi-tion to get the spray angle.
3.2.2. Spray stability
To use, spray angle as an indicator of performance in hydrocyclone, it is inarguably important to establish stability and reproducibility within
statistically allowable range at a given operating condition. To establish the validity of above-mentioned assumption, the test rig was allowed to run for a prolonged duration of time (25 min) keeping all the design and operating parameters fixed (at a fixed flow rate). At every interval of 5 min, 10 images were taken at one frame per second. The average of these 10 spray angles (for every 5-min intervals) was calculated and
Fig. 4. Effect of feed inlet pressure on spray angle using Do = 0.011 m and Du = 0.0045 m.
Fig. 5. Underflow enhanced viscosity comparison within 4 different viscosity model.
Fig. 6. Effect of feed inlet Re on spray angle using Do= 0.011 m and Du= 0.0045 m.
Fig. 7. Azimuthal velocity profile in hydrocyclone (a) at 3 different axial heights and (b) 4 different feed inlet pressures with Do = 0.011 m and Du = 0.0045 m (water only condition).
plotted against time along with standard deviation associated (shown inFig. 3).
It may be observed from theFig. 3that the standard deviation of the measured angle varied below ± 2° at 95% confidence interval in all cases. This establishes that spray angle remains constant at a given op-erating condition which is suggestive of using it as a reliable indicator.
Further, a comparable study has been done between measured spray angle error with water only condition and with slurry. FromTable 4, it is quantified that the S.D. within measured angle is higher with water only condition. The probable reason behind this can be explained in the fol-lowing manner.
The shape of the underflow discharge pattern is highly dependent on the air core morphological feature. It is a common knowledge that in-terfacial surface tension force has the ability to preserve an air body within a liquid medium. However, for single phase fluid pertains to a condition with high magnitude of velocities. As a consequence, the tur-bulent fluctuation is so prominent that the air core appears to be highly vibrant. Because of dancing nature of air core (Narasimha et al., 2006), the underflow discharge pattern exhibits a transient fluctuation in the spray angle. This is a well-established phenomenon of swirling flow hy-drodynamics (Som and Mukherjee, 1980).
The swirling flow characteristic inside a hydrocyclone can be ap-proximated to solid body rotation (Kundu and Cohen, 2009). The tan-gential velocity, which drives the separation inside the hydrocyclone, is strongly affected by the feed solid concentration (Davailles et al., 2012). This leads to the diminishing effect of centrifugal force with re-spect to the viscous effects. As a result, theflow induced oscillation of air core gradually diminishes with an increase in mixture viscosity (due to the presence of solid). Therefore, we observed that the temporal stability of the spray discharge is appearing to be more consistent and the relative standard deviation is comparatively small with respect to water only condition.
3.3. Numerical methodology
In this article, an effort has been made to understand the phenome-nological features of spray formation based on the physical occurrence of the prevailing swirling flow inside a hydrocyclone taking advantage of Large-eddy simulation (LES) results. Here, objective is not to address the intricate details of convoluted hydrodynamics of spray discharge. With the help of single phase simulation, information regarding the magnitude of the azimuthal velocity are extracted. However, the hydro-dynamic modeling of multiphase flow in swirl transport is a non-trivial computational challenge. Subgrid-scale modeling of interface deforma-tion due to turbulence is still an open issue and although both opdeforma-tions might be selected simultaneously in commercial CFD software there is no validation of such a use on benchmark two-phase flows.
The LES model is an intermediate approach between Reynolds-aver-age Navier–Stokes (RANS) and Direct numerical simulation (DNS) where a filtering operation is employed to resolve the large scale eddies of the turbulent flow directly and only small scale (sub-grid scale (SGS)) eddies are modeled by the eddy viscosity approach (White, 1991). The filtered variable by the operation of a filtering function is defined as
F xð Þ ¼ Z
Ω
F xð ÞG x; x0 ð 0Þdx0 ð3Þ
By applying the filtering function, the governing equation of motion for incompressible flow of a Newtonian fluid can be written as ∂vi ∂tþ vj ∂vi ∂xj¼ − 1 ρ ∂p ∂xi −α vivj−vivj * + ∂xj þ υ α2v i αx2 j ð4Þ Here the term ðvivj−vivjÞ is known as subgrid-scale (SGS) stress
Tijsgs. Subsequently T
ijsgsis calculated by Boussinesq hypothesis with
an introduction of subgrid scale turbulent viscosity. This subgrid-scale stress is related to strain-rate Sijas
Sij¼ 1 2 ∂vi ∂xjþ ∂vj ∂xi ! ð5Þ In the Smagorinsky–Lilly model (Smagorinsky, 1963), the subgrid scale turbulent viscosity is estimated by
μTsgs¼ ρ Cð sΔÞ2 h i S 0 0 0 0 ð6Þ where, S ¼ ð2SijSijÞ 1=2
, Δ is the filter width and Csis the Smagorinsky–
Lilly constant.
The LES models involve bounded central differing scheme inducing SIMPLE approach for pressure-velocity coupling in a finite volume solv-er platform of FLUENT©6.3 for solving the govsolv-erning transport equa-tion. The discretized versions of the governing equations are then solved using Gauss–Seidel policy along with algebraic multigrid (AMG) method. Additionally, in the present simulation, semi-implicit time discretization policy is employed for the temporal terms. One can find the details of simulation setup is same as in our previous publica-tion. Detail description of the setup can be obtained from the reference study (Banerjee et al., 2015) along with validations, resolution test and the strategies to take care of other numerical intricacies.
4. Results and discussion
As discussed inSection 3, an attempt has been made to visually in-vestigate and quantify the effect of the aforementioned parameters on the hydrocyclone discharge pattern. Thereafter, an attempt has also been made to build an empirical correlation of the governing parame-ters with spray angle using multivariate regression analysis along with
Fig. 8. Comparison of the theoretical model (Eq.(10)) with the data available from literature.
Table 5
Flow conditions at the spigot for water only (D0 = 0.011 m and Du = 0.0045 m). Inlet Reynolds number Froude number Calculated angle % error with measurements 65674 665 50.0 6.8 94406 886 59.1 4.2 109147 1108 61.7 3.0 126644 1361 65.8 2.4 140493 1645 66.4 1.0
ANOVA (analysis of variance) for the developed model. The model may vary according to the system under investigation. The model has only been developed for the current system under investigation but can be easily adapted to any system of similar nature. Authors only intend to demonstrate a development of a model to understand the dependency of spray angle on various parameters for their specific geometry. 4.1. Effect of swirl intensity on spray angle
Swirling intensity depends on the amount of feed pressure, inlet cross-sectional geometry and effective viscosity of the fluid. Feed pres-sure is an important parameter governing the centrifugal swirl intensity produced inside the hydrocyclone. An investigation of the dependency of the feed inlet pressure on spray angle is shown inFig. 4. The underflow discharge spray angle as shown inFig. 4illustrates that in-creasing the feed inlet pressure at a fixed concentration in a constant ge-ometry, spray angle increases.
However, all the factors affecting the intensity of the swirl produced inside a hydrocyclone can be clubbed together and quantified in terms of inlet Reynolds number. The Reynolds number is calculated using the following equation based on feeding slurry properties (ρ and μ).
Rei¼ρvi
d
μ ð7Þ
where, inlet velocity is calculated as
vi¼ Q=A ð8Þ
where Q is the inlet flowrate and A is the inlet cross-section area. This simple estimate of suspension viscosity has been compared to the correlation proposed by Eilers (Stickel and Powell, 2005),Krieger and Dougherty (1959)andNarasimha et al. (2014)inFig. 5. It can be ob-served from the plot that the model predicted values significantly differ only at solids concentration above ~35% by volume. Under the operating conditions of the present experiments (solid content below 10% by vol-ume) the deviation between the four correlations is minor. Hence, Thomas viscosity model (Eq.(9)) is used to calculate the feed inlet vis-cosity (Thomas, 1965) assuming a Newtonian response of the suspen-sion for moderate shear rates.
μ¼ μ0 1 þ 2:5∅ þ 10:05∅ 2
þ A exp B∅ð Þ
h i
ð9Þ where, μ and μ0are the viscosities of feed slurry and water respectively
at 30 °C and coefficients A and B having values 0.00273 and 16.6 respec-tively for the above expression.
The prediction of viscosity model is only an estimate since the re-sponse of suspensions to complex flows is still not well understood as reviewed in the paper byStickel and Powell (2005).
Further, plotting it against the spray angle at various feed solid concentration, it was found that the spray angle increases with in-crease in Reynolds number (Fig. 6). A similar observation was
re-ported by Mazumdar et al. (2014) in the case of hydrocyclone
running with water only. This may be because for a given operating and design variable, feed volumetric flow rate directly depends on feed inlet pressure and hence at a given cross-sectional feed area in-creases the feed inlet velocity with inlet pressure, ultimately increas-ing the Reynolds number. This increased Reynolds number intensifies the swirl intensity and ultimately increasing the tangen-tial component of the exit velocity and hence increases the spray angle. At the exit of the spigot, the comparison between the three competing mechanisms yielding spray angle can be characterized in a dimensionless form. The Froude number is a measure of the rel-ative importance of inertia (axial flow rate) to gravity acting on the liquid sheet at the exit of the nozzle.
However, the swirling motion generated by the tangentially in-troduced fluid creates an air core along the axis, normally connected to the atmosphere through the spigot opening. Reported literature (Hsieh and Rajamani, 1991; Concha et al., 1996; Narasimha et al., 2006; Neesse and Dueck, 2007; Krishna et al., 2010) addressed that the air core resides over the central region. Thus from the principle of Rankine vortex flow, it can be predicted that air core dynamics is predominantly governed by the forced vortex flow field. Here the theoretical concept adopted for estimation of air core diameter is based on boundary layer approximation theory by solving a set of non-homogeneous ODE. This approach has been adopted by various authors for estimating the air core for swirl atomizer (Som, 1983; Som and Biswas, 1984). The azimuthal velocity profile at three differ-ent heights and four differdiffer-ent feed inlet pressure in a cyclone are shown inFig. 7(a) and (b) respectively. Following this eventually leads to a scaling relationship for air core diameter with the inlet Reynolds number as follows;
da
Du∝Re 0:05
i ð10Þ
This theoretical relation provides a conservative estimation of air core diameter as if the core behaves as an elastic rod. The rationality of the theoretical model (Eq.(10)) has been established by verifying with experimental observations of the air core diameter reported in literature (Hsieh, 1988andKrishna et al., 2010).Fig. 8shows reason-able agreement with the observed trend of air core diameter with varying inlet flow rate and spigot diameter. From the comparison in the aboveFig. 8, it appears that the present theoretical model gives a qualitative picture of air core diameter at a given operating condition.
Average axial velocity at the spigot opening was estimated by the underflow volumetric flow rate divided by the effective cross-sectional
Fig. 9. Effects of increasing feed concentration on underflow discharge shape (a) Spray discharge (3% (w/w) solid concentration), (b) transition state (7% (w/w) solid concentration) and (c) rope discharge (12.5% (w/w) solid concentration) using Do= 0.011 m and Du= 0.0045 m and feed inlet pressure of 206,844 N/m2.
area. Therefore for calculation purpose average axial velocity (u) has been estimated as;
u ¼QAu c ¼ Qu πD2u 4 1− da Du " #2! ð11Þ
Based on the above explanation, we can estimate the axial velocity at the spigot. For water conditions only, the range of variation of the di-mensionless Froude number is reported inTable 5(Fr = u2/g e where
e stands for the liquid sheet thickness at the spigot).
Clearly, Fr≫1 which means that gravitational acceleration has little effect on the spray shape and discharge angle with water only. There-fore, a simple prediction of the spray angle can be tested against exper-iments assuming that the angle is dictated by the axial and azimuthal velocity intensities. The azimuthal velocity has been estimated from a study on hydrocyclone computational fluids dynamics. The detail hy-drodynamics using three-dimensional simulations has been adopted to quantify the phenomenological feature of swirl flow inside hydrocyclone.
The calculated angle inTable 5is given by θ = 2 arctan (w/u). Com-pared to experiments, the error is only a few percents and shows a mo-notonous decrease when Fr is increasing corresponding to less effect of gravity on the spray angle. Spray angle is therefore dictated by flow in-ertia effect at the spigot opening for water only.
4.2. Effect of pulp density on spray angle
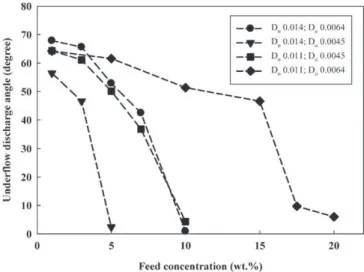
There are four forces acting on the slurry at the exit of the spigot that are typically important in spray formation. They are gravity force, iner-tia, surface tension, and viscosity. When the pulp density at the feed varies the interplay between these physical mechanisms may change leading to drastically different discharge regimes. Pulp density plays an important role in deciding the shape of the underflow discharge and it is directly governed through solid concentrations. A visual inves-tigation of the dependency of the feed inlet solid concentration on spray angle is shown inFig. 9. The significant change in flow pattern can easily be perceived with the corresponding change in the underflow discharge angle. It can easily be observed fromFig. 9that underflow discharge re-gime gradually shifts from spray to rope discharge with the subsequent increase in feed solid concentration. A drastic change of behavior is ob-served between 7% (spray discharge) and 12.5% (rope discharge) feed concentration. This is in agreement with the numerical study of
Davailles et al. (2012). It can also be observed fromFig. 10that at the
Fig. 10. Effect of feed concentration on spray angle using Do= 0.011 m and Du= 0.0064 m at FIP of 206,844 N/m2
.
Fig. 11. Effect of ratio of underflow pulp density to feed pulp density on spray angle using Do= 0.011 m and Du= 0.0045 m.
Fig. 12. Spray angle vs. enhanced mixture viscosity μu/μofrom Eq.(9)at the spigot opening.
lower feed concentration, slurry practically behaves like water and as the solid concentration increases, the underflow discharge spray angle becomes lower. The increase of mass loading increases the density but has also a strong impact of the slurry viscosity. The dimensionless Froude number characterizes the relative contributions of inertia (u2)
and gravity (g) at the spigot opening. Increasing solid content in the feed increases slurry viscosity, therefore inlet kinetic energy is strongly dissipated in the core of hydrocyclone. At spigot opening, under rope conditions, the very dense suspension has a low velocity (Fr is reduced compared to spray discharge conditions) which gives more important role to gravity. However, at higher feed solid concentration, particles' hindered settling condition prevails which does not conform to the Stokes' law and gravity force dominate the exit velocity profile. A large amount of momentum from the feed injection is dissipated within the hydrocyclone where the swirl velocity has been significantly damped leading to the lower azimuthal velocity at the spigot opening and there-fore small discharge angle. It may in some extent lead to the collapse of the air core and possible choking of the hydrocyclone.
However, any change in feed concentration will change exit pulp densities and will affect the spray profile through underflow. There-fore, an attempt was made to study the effect of λ (ratio of the underflow pulp density to feed pulp density) on the nature of underflow discharge shape.Fig. 11is plotted to highlight the effects of pulp densities on underflow discharge spray angle at different feed inlet pressures.
It can be observed fromFig. 11that with increasing λ, spray angle decreases. This may be because as increasing the solid concentration in the feed will increase the solid flow rate in the underflow and lessen the amount of water reporting, thereby increasing the underflow pulp density and viscosity. At high feed solid content, accumulation of solid particles exceeds in conical section than the discharge rate. The coarser particles will be predominantly affected by gravitational force and will overcome the spray generating swirling nature and thereby tending to reduce the spray angle. Relative finer particle, although following the path of swirling water will not dominate the discharge profile shape as they are fewer in quantity in discharge. Lower feed solid concentra-tion will result in increased water recovery in underflow with fewer solid reporting and thereby decreasing the underflow pulp density. This will result in swirl dominance in spray profile and will tend to in-crease the spray angle. Similar conclusions have been drawn from com-putational fluids simulations (Davailles et al., 2012). When the feed concentration is increased, mass loading and viscosity enhancement will dissipate the momentum of the slurry and centrifugal separation will decrease (lower azimuthal velocity). At spigot opening, under rope conditions, the very dense suspension has a low velocity (Fr is re-duced compared to spray discharge conditions) which gives the more important role of gravity. Therefore, particles are driven by gravity and the velocity at the spigot opening is almost vertical yielding to small dis-charge angle (roping). An estimate of the enhanced mixture viscosity
Fig. 14. Variation of solid and water recovery with spray angle using Do = 0.011 m and Du = 0.0064 m at fixed feed conc. of 15% (w/w).
Fig. 15. Variation of UF slurry recovery with spray angle using Do = 0.011 m and Du = 0.0064 m at different feed conc. level
Fig. 16. Variation of d50w.r.t. underflow discharge angle using Do= 0.011 m and Du= 0.0064 m.
Table 6
Significance test of model parameters (ANOVA). Regression statistics Multiple R 0.964 R square 0.929 Adjusted R square 0.926 Standard error 0.043 Observations 100 df SS MS F Significance F Regression 4 2.345 0.586 311.224 1.14936E-53 Residual 95 0.179 0.002 Total 99 2.524 Coefficients Standard
error t Stat P-value Lower 95% Upper 95% Intercept − 0.3390 0.2220 − 1.527 0.130 − 0.780 0.102 ln(Du/Dc) 0.0766 0.0268 2.855 0.005 0.023 0.130 ln(Do/Dc) − 0.1414 0.0297 − 4.760 6.9101E-06 −0.200 − 0.082 ln(λ) − 1.2726 0.0466 − 27.307 9.1055E-47 −1.365 − 1.180 ln(Re) 0.3752 0.0174 21.593 2.033E-38 0.341 0.410
μu/μoby the presence of particles can be drawn from Thomas relation
(Eq.(9)). The concentration of the slurry at the underflow has been de-termined based on the global mass balance in the hydrocyclone (parti-cle partitioning at under and overflow were measured along all experiments). Over the range of operating conditions, we tested, μu/μo
varies from 1 (pure water) to 6.93 for the concentrated slurry. There is a strong correlation between the increase of the slurry vis-cosity and the spray angle (see inFig. 12the monotonous decrease of spray angle with μu/μoand the sharp decrease of spray angle for an
en-hanced slurry viscosity above 4). The transition from spray to roping is observed for μu/μo~ 4 corresponding to the volumetric concentration
at the spigot slightly larger than 40% (65wt.%). Such behavior is expect-ed becauseYao et al. (2012)investigated the effect of fluid viscosity on stability and angle of spray generated by a swirl atomizer. The fluid vis-cosity has been varied by mixing water with increasing concentration of glycerol. In their experiments, a sharp decrease of the spray angle mea-sured by high-speed shadowgraphy has been observed for 50% of glyc-erol content in water corresponding to μu/μo ~ 5. The analogy is
straightforward with the effect of particle presence on the slurry dy-namics at the spigot. Enhanced viscosity dissipates the inlet momentum
and the azimuthal velocity (lower centrifugal force) at the spigot open-ing. The ratio of azimuthal to axial flow velocity is reduced and conse-quently yields drastic reduction of the spray angle (roping regime). 4.3. Effect of outlet diameters (design variables)
The outlet dimensions are another important physical parameters used to change the operational feature. As reported by many authors (Plitt et al., 1987; Concha et al., 1996), the separation performance of an industrial hydrocyclone is controlled by the cone ratio (ratio of the spigot to the vortex finder).Shah et al. (2006)suggested that the use of cone ratio as a design variable is insignificant and can sometimes be misleading. The diameter of the vortex finder (Do) and spigot (Du)
indi-vidually has an effect on the water split behavior in hydrocyclone. Therefore, in this study, the individual role of these two parameters on the spray angle has also been explored.
It may be observed fromFig. 13that for a given operating condition the change in vortex finder diameter has a significant effect on hydrocyclone performance. An increase in the diameter of the vortex finder will result in more water and some solids reporting to overflow.
Table 7
Model validation with water only condition.
Du Do Inlet pressure Vi Re Experimental θ Predicted θ (Mazumdar et al., 2014) Predicted θ (present Eq.(13)) % error
(m) (m) (N/m2) (m/s) (degree) (degree) (degree)
0.0064 0.014 68948 7.94 88235 58.31 57.03 53.81 7.72 137895 11.11 123455 65.96 65.24 61.13 7.32 206843 13.24 147115 71.18 69.97 65.34 8.2 275790 15.52 172548 75.8 74.58 69.42 8.41 344738 17.51 194656 76.66 78.27 72.68 5.19 68948 7.12 79156 52.87 54.22 53.4 1.01 137895 9.51 105726 57.79 60.87 59.61 3.16 0.0064 0.011 206843 11.83 131460 64.63 66.41 64.76 0.2 275790 13.35 148432 66.04 69.72 67.82 2.68 344738 15.02 166942 68.36 73.07 70.91 3.73 0.0045 0.011 68948 6.99 77709 53.62 53.44 51.56 3.85 137895 10.05 111706 61.67 61.79 59.18 4.03 206843 11.62 129148 63.54 65.48 62.54 1.59 275790 13.48 149851 65.3 69.49 66.17 1.34 344738 14.96 166238 68.75 72.44 68.83 0.13 0.0032 0.008 68948 5.86 65139 51.35 48.99 49.06 4.46 137895 7.88 87631 57.75 55.16 54.91 4.93 206843 9.66 107342 62.25 59.82 59.31 4.73 275790 10.81 120190 65.01 62.59 61.91 4.77 344738 11.89 132151 66.47 65.01 64.19 3.43 Table 8
Model validation with experimental spray angle.
Du Do Solid Conc. FIP UFds/Fds (λ) Re SA(θ) S.D. of measured SA Predicted SA (θ) % error (m) (m) (%w/w) (N/m2 ) (degree) (degree) 0.0045 0.011 1 68948 1.04 80356 52.4 1.14 49.56 5.42 0.0045 0.011 3 68948 1.13 75900 45.17 1.15 43.62 3.43 0.0045 0.011 3 137896 1.15 100149 50.05 1.03 47.54 5.01 0.0045 0.011 3 206844 1.17 122753 50.48 0.97 50.42 0.12 0.0045 0.011 3 275792 1.18 144252 54.32 1.03 52.97 2.49 0.0045 0.011 5 68948 1.24 75760 41.94 0.59 39.05 6.89 0.0045 0.011 5 206844 1.32 124463 46.09 0.88 43.33 5.99 0.0045 0.011 7 206844 1.34 124621 38.54 1.12 42.46 10.17 0.0045 0.011 7 275792 1.44 147112 39.14 1.08 41.23 5.34 0.0064 0.011 5 206844 1.11 125633 53.86 0.56 55.92 3.82 0.0064 0.011 7 68948 1.13 74739 47.33 0.89 44.89 5.16 0.0064 0.011 10 68948 1.18 76320 42.15 0.76 42.84 1.64 0.0064 0.011 10 137896 1.21 96244 44.21 1.03 45.05 1.90 0.0064 0.011 15 68948 1.27 73898 40.29 1.43 38.39 4.72 0.0045 0.014 1 68948 1.07 86166 46.34 1.04 47.66 2.85 0.0045 0.014 1 137896 1.07 118464 51.83 0.93 53.75 3.70 0.0045 0.014 3 68948 1.22 95518 39.98 1.37 41.79 4.53
However, this reduced amount of water reporting to underflow will in-crease underflow pulp density and the spray angle becomes lower. It may likewise be noted that at a fixed vortex finder diameter and inlet pressure, the spray angle increases with increase in spigot diameter be-cause an increase in spigot diameter results in more water reporting to underflow essentially reducing the resistance offered by the ejection area to the swirling motion of liquid inside it. The ratio w/u increases with increase in Du hence the θ (2 tan−1(w/u)) increases.
4.4. Variation of hydrocyclone performance indices w.r.t. spray angle In the present study, we are intended to show that spray angle is a good indicator of hydrocyclone performance, it is only possible when the change in response gets (performance indices) reflected through spray angle (respective change). During the study, it was noticed that the hydrocyclone performance is interrelated with underflow discharge angle. FromFig. 14–16it can be observed that performance indices, e.g., cut size (d50), RS, Rfand RValter with changing in spray angle. At the
same level of feed solid concentration, an increase in feed inlet pressure (increase in swirl intensity) leads to increase in spray angle while cut size reduces (Fig. 16). With the increase in spray angle, underflow solid recovery increases while underflow water and slurry recovery (RV) decreases at fixed concentration (Fig. 14 and 15respectively). At
higher feed inlet pressure, more solids move towards the wall side of the cyclone (high centrifugal force than drag force) and report to underflow whereas more water report to overflow. Therefore, underflow water recovery decreases w.r.t. feed water. So, based on the present study, it can be interpreted that the spray angle is an indicator of hydrocyclone performance.
5. Overall correlation and model validation
As reported byMazumdar et al. (2014)and as observed above in
Section 4, the parameters affecting the spray formation follows a power law mathematically. Therefore, in order to interrelate the indi-vidual variables with spray angle on the basis of above trend an attempt has been made to derive an empirical correlation to quantify the com-bined effect of different parameters on spray. The model would take an empirical form as shown below.
θ¼ K ' Dð Þuað ÞDobðReiÞcð Þλd ð12Þ
To find the value of the constant K and exponent a, b, c and d, respec-tively multivariate regression analysis of all the experimental data was performed. The dependency of the spray angle along with all the depen-dent variables was converted from power law to linear form by taking
logarithm on both sides. Consequently, a multivariate linear regression analysis was done using Minitab statistical software. After deriving the model, the equation generated was converted to its original form by taking antilogarithm on both sides. Mathematically the model can be expressed as mentioned below,
θ¼ 0:7' Du Dc " #0:08 D o Dc " #−0:14 Rei ð Þ0:38ð Þλ−1:27 ð13Þ
In the above-developed model, hydrocyclone diameter (Dc) is a
rel-evant scale but has not been varied in the present study. Only spray dis-charge conditions are considered to develop the correlation (Eq.(13)). Rope discharge conditions' data (higher feed concentration) are not part of this. In rope discharge condition, internal hydrodynamics are dif-ferent in comparison to spray condition. Once rope commences then further if we increase the feed solid concentration, underflow discharge angle does not alter (≈00).
The model described in the following correlation provided a reason-able description of the data (Adjusted R2= 0.92). Various hypothesis
testing is done to verify the acceptance of the developed model and are explained in brief in the following paragraph. It is however impor-tant to mention that all the statistical analysis is done at a confidence in-terval of 95% or at α level of 0.05.
A preliminary investigation of P value (significance F) shows that the value obtained from the model output (b0.01) is less than α level of 0.05. This gives an initial positive result for accepting the overall regres-sion relationship (Table 6). Further, F-test helps in establishing whether the proposed relationship in the form of the model is statistically reli-able or not. This is useful when the objective of developing the model is a prediction or explanation of generating the experimental data set. A significant F-test indicates that the R2is reliable. Calculating F (α; k;
n-k-1), we get an approximate value of 2.5, which is less than the F value of ANOVA output (F = 311.22). k denotes the number of indepen-dent variables and n denotes the number of observations for each inde-pendent variable. P-value of significance F test is very low which rejects the null hypothesis. Thus the regression model passes the F-test and the coefficient of correlation obtained is also found to be significant. Howev-er, the existence of a regression relation in itself does not justify that meaningful and accurate prediction can be made. Further tests have to be conducted to establish the significance of coefficient of each indepdent variable. Preliminary visual investigation of the P-values of the en-tire independent variable class signifies that coefficients are significant and are affecting the dependent variable. To further establish the fact, t-test can be performed. A two-tailed t-test and at a confidence level of 95%, i.e. at α level of 0.05 was performed and value tðα
2;n−k−1Þ
was compared with the t values of ANOVA output for all the variables. It was found that all the coefficients report as significant.
Various hypothesis testing is adopted further to strengthen the con-fidence in the above-mentioned model. The statistical analysis carried out henceforth has been done at 95% confidence interval. P-test, F-test, and two-tailed t-tests have been carried out to establish the statistical reliability of the empirical model towards prediction or explanation of the experimental observation. Hence, based on statistical analysis, the developed model is significant and all the independent variables seem to be affecting the dependent variable.
Initially, the spray angle from the developed model was compared with experimental spray angle for water only condition putting which was shown inTable 7. Predicted spray angle from the present model has good agreement (putting λ = 1) with experimental spray angle with water only condition and also compared with data obtained from
Mazumdar et al. (2014)model.
To evaluate the predictive capability of the developed model, 17 in-dividual experiments were carried out at random within the range of the variables selected with slurry. The random experimental data
generated are then compared with the predicted spray angle at identical operating conditions (Table 8).
The comparative plot is shown inFig. 17. It may be perceived that the developed model agrees well with the experimental data as the rel-ative error between the predicted and experimental data is below 6% (some outliers due to high turbulence nature). The respective standard deviation within the measured spray angle has also been shown by the error bars.
6. Conclusion
In the present study, it has been successfully demonstrated that the algorithm developed in case of water is equally capable of calculating the spray angle in the case of hydrocyclone operating with slurry. It has also been further established that the spray angle remains stable and is reproducible under a given operating condition. Spray angle seems to be an indicator of internal hydrodynamic flow patterns as the spray angle varies significantly with a number of different operating and geometric parameters of the hydrocyclone. It was further established that spigot and vortex finder diameter, inlet Reynolds num-ber and feed and underflow pulp density are the major parameters to determine the shape of underflow discharge in a hydrocyclone. Empir-ical correlation using multivariate regression analysis shows that de-pendency of the spray angle with the above-mentioned parameters takes a form which can be mathematically described as,
θ¼ 0:7' Du Dc " #0:08 D o Dc " #−0:14 Rei ð Þ0:38ð Þλ−1:27
This developed correlation only shows that spray angle is an indica-tor of hydrocyclone performance which depends on various parameters (mentioned inSection 4) and hydrocyclone performance can be moni-tored by monitoring the discharge pattern.
F-test, t-test and relevant significance test (p test) have been carried out to establish the statistical relevance of the developed model. How-ever, the present study has been performed entirely with mono density (silica sand) feed particles and identical feed size distribution, so the ef-fect of feed particle density and feed size distribution are not part of this study. Further study is hence required in this regard to re-affirm the use of spray discharge profile as an indicator of performance.
Appendix A. Supplementary data
Supplementary data to this article can be found online athttp://dx. doi.org/10.1016/j.minpro.2016.07.002.
References
Banerjee, C., Kaustav, C., Kumar, M.A., Suman, C., 2015.Swirling flow hydrodynamics in hydrocyclone. Ind. Eng. Chem. Res. 54, 522–528.
Barrientos, A., Concha, F., 1992.Phenomenological model of classification in conventional hydrocyclones. Communication 21, 287–305.
Castro, O., 1990.Pulp rheology Effects for Hydrocyclone Models (M.Sc.Thesis) University of Queensland (JKMRC), Brisbane, Australia.
Concha, F., Barrientos, A., Montero, J., Sampaio, R., 1996.Air core and roping in hydrocyclones. Int. J. Miner. Process. 44-45, 743–749.
Davailles, A., Climent, E., Bourgeois, F., Majumder, A.K., 2012.Analysis of swirling flow in hydrocyclones operating under dense regime. Miner. Eng. 31, 32–41.
Hsieh, K.T., 1988.A Phenomenological Model of the Hydrocyclone (PhD Thesis) Universi-ty of Utah.
Hsieh, K.T., Rajamani, K., 1991.Mathematical model of the hydrocyclone based on physics of fluid flow. AICHE J. 37, 735–746.
Krieger, I.M., Dougherty, T.J., 1959.A mechanism for non-Newtonian flow in suspensions of rigid spheres. Trans. Soc. Rheol. 3, 137–152.
Krishna, V., Sripriya, R., Kumar, V., Chakraborty, S., Meikap, B.C., 2010.Identification and prediction of air core diameter in a hydrocyclone by a novel online sensor based on digital signal processing technique. Chem. Eng. Process. 49, 165–176.
Kundu, P.K., Cohen, I.M., 2009.Fluid Mechanics. fourth ed. Academic Press, USA.
Lynch, A.J., Rao, T.C., 1975.Modelling and Scale-up of Hydrocyclone Classifiers. Proceed-ings of XIth International Mineral Processing Congress, Cagliari, pp. 245–269.
Marlow, D., 1973.A Mathematical Analysis of Hydrocyclone Data (M.Sc. Thesis) Universi-ty of Queensland (JKMRC), Brisbane, Australia.
Mazumdar, A., Dubey, R.K., Banerjee, C., Sengupta, K., Majumder, A.K., 2014.A study on the characteristics of spray angle formation in a 2 inch hydrocyclone using water only. Int. J. Miner. Process. 126, 141–145.
Monredon, T.C., Hsieh, K.T., Rajamani, R.K., 1992.Fluid flow model of the hydrocyclone: an investigation of device dimensions. Int. J. Miner. Process. 35 (1-2), 65–83.
Nageswararao, K., 1978.Further Developments in the Modelling and Scale-up of Industri-al Hydrocyclones (Ph.D. Thesis) University of Queensland (JKMRC), Brisbane, Australia.
Narasimha, M., Mathew, B., Holtham, P.N., 2006.Large eddy simulation of hydrocyclone-prediction of air-core diameter and shape. Int. J. Miner. Process. 80, 1–14.
Narasimha, M., Mainza, A.N., Holtham, P.N., Powell, M.S., Brennan, M.S., 2014.A semi-mechanistic model of hydrocyclones - developed from industrial data and inputs from CFD. Int. J. Miner. Process. 133, 1–12.
Neesse, T., Schneider, M., Dueck, J., Golyk, V., Buntenbach, S., Tiefel, H., 2004a.
Hydrocyclone operation at the transition point rope/spray discharge. Miner. Eng. 17, 733–737.
Neesse, T., Dueck, J., 2007.Air core formation in the hydrocyclone. Miner. Eng. 20, 349–354.
Neesse, T., Schneider, M., Golyk, V., Tiefel, H., 2004b.Measuring the operating state of the hydrocyclone. Miner. Eng. 17, 697–703.
Otsu, N., 1979.A threshold selection method from gray-level histograms. IEEE Trans. Syst. Man Cybern. 9 (1), 62–66.
Petersen, K.R.P., Aldrich, C., Van Deventer, J.S.J., McInnes, C., Stange, W.W., 1996.
Hydrocyclone underflow monitoring using image processing methods. Miner. Eng. 9 (3), 301–316.
Plitt, L.R., Flintoff, B.C., Stuffco, T.J., 1987.Roping in hydrocyclones. In: Wood, P. (Ed.), Pro-ceedings of the 3rd International Conference on Hydrocyclones, Oxford, BHRA. Elsevier, Amsterdam, A-3, pp. 21–34.
Plitt, L.R., 1976.Mathematical model of the hydrocyclone classifier. CIM Bull. 69 (776), 114–123.
Rashid, M.S.F.M., Hamid, A.H.A., Sheng, O.C., Ghaffar, Z.A., 2012.An experimental investi-gation on the effect of various swirl atomizer orifice geometries on the air core diam-eter. Appl. Mech. Mat. 225, 32–37.
Shah, H., Majumder, A.K., Barnwal, J.P., 2006.Development of water split model for a 76 mm hydrocyclone. Miner. Eng. 19, 102–104.
Smagorinsky, J., 1963.General circulation experiments with the primitive equations. Mon. Weather Rev. 91, 99–164.
Som, S.K., 1983.Theoretical and experimental studies on the formation of an air core in a swirl spray pressure nozzle using a power law non-Newtonian liquid. Appl. Sci. Res. 40, 71–91.
Som, S.K., Biswas, G., 1984.Initiation of air core in a swift nozzle using time-independent power-lawfluids. Acta Mech. 51, 179–197.
Som, S.K., Mukherjee, S.G., 1980.Theoretical and experimental investigations on the coeffizient of discharge and spray cone angle of a swirl spray atomizing nozzle. Acta Mech. 36, 79–102.
Sripriya, R., Kaulaskar, M.D., Chakraborty, S., Meikap, B.C., 2007.Studies on the perfor-mance of a hydrocyclone and modeling for flow characterization in presence and ab-sence of air core. Chem. Eng. Sci. 62 (22), 6391–6402.
Stickel, J.J., Powell, R.L., 2005.Fluid mechanics and rheology of dense suspensions. Annu. Rev. Fluid Mech. 37, 129–149.
Thomas, D.G., 1965.Transport characteristics of suspension: VIII. A note on the viscosity of Newtonian suspensions of uniform spherical particles. J. Colloid Sci. 20, 267–277.
Van Deventer, J.S.J., Feng, D., Petersen, K.R.P., Aldrich, C., 2003.Modelling of hydrocyclone performance based on spray profile analysis. Int. J. Miner. Process. 70, 183–203.
Van, V., Janse, M.J., Aldrich, C., Auret, L., 2011.Detecting changes in the operational states of hydrocyclones. Miner. Eng. 24, 1532–1544.
Viljoen, T., 1993.Recent Developments in Instrumentation. SAIMM School: Process Sim-ulation, Control and Optimization, Randburg, South Africa.
White, F.M., 1991.Viscous Fluid Flow. McGraw-Hill, Second.
Williams, R.A., Dickin, F.J., Gutierrez, J.A., Dyakowski, T., Beck, M.S., 1997.Using electrical impedance tomography for controlling hydrocyclone underflow discharge. Control. Eng. Pract. 5 (2), 253–256.
Yao, S., Zhang, J., Fang, T., 2012.Effect of viscosities on structure and instability of sprays from a swirl atomizer. Exp. Thermal Fluid Sci. 39, 158–166.