O
pen
A
rchive
T
oulouse
A
rchive
O
uverte
(OATAO)
OATAO is an open access repository that collects the work of some Toulouse
researchers and makes it freely available over the web where possible.
This is
an author'sversion published in: https://oatao.univ-toulouse.fr/23570
Official URL :
https://doi.org/10.1016/j.ifacol.2015.06.205
To cite this version :
Any correspondence concerning this service should be sent to the repository administrator:
Kamissoko, Daouda and Pérès, François and Zaraté, Pascale and Gourc, Didier Complex
system representation for vulnerability analysis. (2015) IFAC-PapersOnLine, 48 (3). 948-953.
ISSN 2405-8963
OATAO
10.1016/j.ifacol.2015.06.205
D. KAMISSOKO et al. / IFAC-PapersOnLine 48-3 (2015) 948–953
Complex system representation for vulnerability analysis
D. KAMISSOKO*, F. PÉRÈS**, P. ZARATÉ***, D. GOURC*
*University of Toulouse, École des mines d’Albi-Carmaux, Allée des sciences, 81000 Albi, France (Tel: 0033563493185; e-mail: [email protected])
**University of Toulouse, École Nationale d'Ingénieurs de Tarbes, 47 Avenue d'Azereix, 65000 Tarbes, France (e-mail:[email protected])
***University of Toulouse 1 Capitole, 21, allée de Brienne, 31042 Toulouse cedex 9 France (e-mail: [email protected])}
Abstract: Many socio-technical systems are endowed of dynamism, self-organization, emergency etc. These attributes make them as complex systems. Because of this complexity, the representation is a crucial step for vulnerability analysis. The objective of this paper is to provide a generic framework of complex systems representation for vulnerability analysis. We used infrastructure network such as power grid, gas and telecommunication system to illustrate our proposal. It is separated in five layers: Spatial framework, Stake, Flow, Environment, and Network structure. The static view consists of a network structure (Nodes and edges). The dynamic view is related to the flow circulation, components’ states variations, and interdependences among them. Characteristics of these factors are described. The environment refers to outside perturbations that could happen. With our proposal it is possible to model many classes of complex system as the basis of vulnerability analysis. For this purpose, some modelling rules are proposed. The result allows performing simulations. Results of the simulation can be used for instance to find out vulnerability model into complex systems, or to validate existing models.
Keywords: Complex Systems, Vulnerability, Risk, Graph Theory, Modelling, Infrastructure Network.
1. INTRODUCTION
By observing our societies we remark a large number of interacting socio-technical systems (economic, politic, infrastructure etc.). On one hand, some of them called natural, consists of social human been. On the other, there are artificial systems supporting natural ones functioning and wellbeing. For all of these systems, the behaviour is hard to predict. Their malfunctioning could lead to a crisis situation. The economic crisis in 2008, the Arab spring in 2010, the international air traffic perturbation by a volcano in Iceland in 2010, and recently the psychosis around the spread of the virus Ebola well illustrate this kind of situation. All of these systems can be called complex. The main problem in view of this complexity is the behaviour prediction for vulnerability assessment. In other term, how to make analysis for decision making perspective? To answer this question, the modelling, ie the passage from the real system to its representation is a crucial step. The objective of this paper is to provide a generic framework for complex system representation before simulating and vulnerability assessment. For this purpose, we categorized components of the system into five layers: Spatial framework, Stake, Flow, Environment, and Network structure. The notion of relationship is introduced to take into account interactions. Effect of the outside environment is also discussed. By using the graph theory, our approach is applicable to many classes of complex system. Our analysis is performed before the simulation and can lead to the vulnerability analysis for decision aiding. In fact, in the vulnerability literature review, there are two viewpoints:
System-based view: focuses on how the considered system will fail or change from one state to another. This view is shared by (Johansson et al., 2007), (Benoît and Luviano, 2009) and (Haimes, 2006); Event-based view: considers the amplitude and/or
the frequency of one or more events. This view is shared by (Thedéen, 2010) and (Leone, 2007). Whatever the view adopted, our approach could be used to represent the complex system for vulnerability assessment. Throughout the rest of this document, we begin by defining the term System. Then, we discuss how a system can be complex. The case study referring to infrastructure network is presented. Our proposal itself is introduce by the five layers descriptions. We end by a conclusion and some perspectives. The paper aiming complex system representation, we begin by defining the terms system and complex system in the next.
2. SYSTEM AND COMPLEX SYSTEM Regarding system definitions in the literature, there are two schools of thoughts. The first one represents systems regarding their constitutions (structure). The second one defines them according to the provided services (dynamic and function). With respect to the first standpoint, system is either a finite number of elements in relationship, forming a whole (Wihelmsson and Johanson, 2009), or a set of interactive and interconnected elements (International Electrotechnical Commission, 2006), (IEC, 2007). For the
Proceedigs of the 15th IFAC Symposium on Information Control Problems in Manufacturing May 11-13, 2015. Ottawa, Canada
Copyright © 2015 IFAC 998
Complex system representation for vulnerability analysis
D. KAMISSOKO*, F. PÉRÈS**, P. ZARATÉ***, D. GOURC*
*University of Toulouse, École des mines d’Albi-Carmaux, Allée des sciences, 81000 Albi, France (Tel: 0033563493185; e-mail: [email protected])
**University of Toulouse, École Nationale d'Ingénieurs de Tarbes, 47 Avenue d'Azereix, 65000 Tarbes, France (e-mail:[email protected])
***University of Toulouse 1 Capitole, 21, allée de Brienne, 31042 Toulouse cedex 9 France (e-mail: [email protected])}
Abstract: Many socio-technical systems are endowed of dynamism, self-organization, emergency etc. These attributes make them as complex systems. Because of this complexity, the representation is a crucial step for vulnerability analysis. The objective of this paper is to provide a generic framework of complex systems representation for vulnerability analysis. We used infrastructure network such as power grid, gas and telecommunication system to illustrate our proposal. It is separated in five layers: Spatial framework, Stake, Flow, Environment, and Network structure. The static view consists of a network structure (Nodes and edges). The dynamic view is related to the flow circulation, components’ states variations, and interdependences among them. Characteristics of these factors are described. The environment refers to outside perturbations that could happen. With our proposal it is possible to model many classes of complex system as the basis of vulnerability analysis. For this purpose, some modelling rules are proposed. The result allows performing simulations. Results of the simulation can be used for instance to find out vulnerability model into complex systems, or to validate existing models.
Keywords: Complex Systems, Vulnerability, Risk, Graph Theory, Modelling, Infrastructure Network.
1. INTRODUCTION
By observing our societies we remark a large number of interacting socio-technical systems (economic, politic, infrastructure etc.). On one hand, some of them called natural, consists of social human been. On the other, there are artificial systems supporting natural ones functioning and wellbeing. For all of these systems, the behaviour is hard to predict. Their malfunctioning could lead to a crisis situation. The economic crisis in 2008, the Arab spring in 2010, the international air traffic perturbation by a volcano in Iceland in 2010, and recently the psychosis around the spread of the virus Ebola well illustrate this kind of situation. All of these systems can be called complex. The main problem in view of this complexity is the behaviour prediction for vulnerability assessment. In other term, how to make analysis for decision making perspective? To answer this question, the modelling, ie the passage from the real system to its representation is a crucial step. The objective of this paper is to provide a generic framework for complex system representation before simulating and vulnerability assessment. For this purpose, we categorized components of the system into five layers: Spatial framework, Stake, Flow, Environment, and Network structure. The notion of relationship is introduced to take into account interactions. Effect of the outside environment is also discussed. By using the graph theory, our approach is applicable to many classes of complex system. Our analysis is performed before the simulation and can lead to the vulnerability analysis for decision aiding. In fact, in the vulnerability literature review, there are two viewpoints:
System-based view: focuses on how the considered system will fail or change from one state to another. This view is shared by (Johansson et al., 2007), (Benoît and Luviano, 2009) and (Haimes, 2006); Event-based view: considers the amplitude and/or
the frequency of one or more events. This view is shared by (Thedéen, 2010) and (Leone, 2007). Whatever the view adopted, our approach could be used to represent the complex system for vulnerability assessment. Throughout the rest of this document, we begin by defining the term System. Then, we discuss how a system can be complex. The case study referring to infrastructure network is presented. Our proposal itself is introduce by the five layers descriptions. We end by a conclusion and some perspectives. The paper aiming complex system representation, we begin by defining the terms system and complex system in the next.
2. SYSTEM AND COMPLEX SYSTEM Regarding system definitions in the literature, there are two schools of thoughts. The first one represents systems regarding their constitutions (structure). The second one defines them according to the provided services (dynamic and function). With respect to the first standpoint, system is either a finite number of elements in relationship, forming a whole (Wihelmsson and Johanson, 2009), or a set of interactive and interconnected elements (International Electrotechnical Commission, 2006), (IEC, 2007). For the
Proceedigs of the 15th IFAC Symposium on Information Control Problems in Manufacturing May 11-13, 2015. Ottawa, Canada
Copyright © 2015 IFAC 998
Complex system representation for vulnerability analysis
D. KAMISSOKO*, F. PÉRÈS**, P. ZARATÉ***, D. GOURC*
*University of Toulouse, École des mines d’Albi-Carmaux, Allée des sciences, 81000 Albi, France (Tel: 0033563493185; e-mail: [email protected])
**University of Toulouse, École Nationale d'Ingénieurs de Tarbes, 47 Avenue d'Azereix, 65000 Tarbes, France (e-mail:[email protected])
***University of Toulouse 1 Capitole, 21, allée de Brienne, 31042 Toulouse cedex 9 France (e-mail: [email protected])}
Abstract: Many socio-technical systems are endowed of dynamism, self-organization, emergency etc. These attributes make them as complex systems. Because of this complexity, the representation is a crucial step for vulnerability analysis. The objective of this paper is to provide a generic framework of complex systems representation for vulnerability analysis. We used infrastructure network such as power grid, gas and telecommunication system to illustrate our proposal. It is separated in five layers: Spatial framework, Stake, Flow, Environment, and Network structure. The static view consists of a network structure (Nodes and edges). The dynamic view is related to the flow circulation, components’ states variations, and interdependences among them. Characteristics of these factors are described. The environment refers to outside perturbations that could happen. With our proposal it is possible to model many classes of complex system as the basis of vulnerability analysis. For this purpose, some modelling rules are proposed. The result allows performing simulations. Results of the simulation can be used for instance to find out vulnerability model into complex systems, or to validate existing models.
Keywords: Complex Systems, Vulnerability, Risk, Graph Theory, Modelling, Infrastructure Network.
1. INTRODUCTION
By observing our societies we remark a large number of interacting socio-technical systems (economic, politic, infrastructure etc.). On one hand, some of them called natural, consists of social human been. On the other, there are artificial systems supporting natural ones functioning and wellbeing. For all of these systems, the behaviour is hard to predict. Their malfunctioning could lead to a crisis situation. The economic crisis in 2008, the Arab spring in 2010, the international air traffic perturbation by a volcano in Iceland in 2010, and recently the psychosis around the spread of the virus Ebola well illustrate this kind of situation. All of these systems can be called complex. The main problem in view of this complexity is the behaviour prediction for vulnerability assessment. In other term, how to make analysis for decision making perspective? To answer this question, the modelling, ie the passage from the real system to its representation is a crucial step. The objective of this paper is to provide a generic framework for complex system representation before simulating and vulnerability assessment. For this purpose, we categorized components of the system into five layers: Spatial framework, Stake, Flow, Environment, and Network structure. The notion of relationship is introduced to take into account interactions. Effect of the outside environment is also discussed. By using the graph theory, our approach is applicable to many classes of complex system. Our analysis is performed before the simulation and can lead to the vulnerability analysis for decision aiding. In fact, in the vulnerability literature review, there are two viewpoints:
System-based view: focuses on how the considered system will fail or change from one state to another. This view is shared by (Johansson et al., 2007), (Benoît and Luviano, 2009) and (Haimes, 2006); Event-based view: considers the amplitude and/or
the frequency of one or more events. This view is shared by (Thedéen, 2010) and (Leone, 2007). Whatever the view adopted, our approach could be used to represent the complex system for vulnerability assessment. Throughout the rest of this document, we begin by defining the term System. Then, we discuss how a system can be complex. The case study referring to infrastructure network is presented. Our proposal itself is introduce by the five layers descriptions. We end by a conclusion and some perspectives. The paper aiming complex system representation, we begin by defining the terms system and complex system in the next.
2. SYSTEM AND COMPLEX SYSTEM Regarding system definitions in the literature, there are two schools of thoughts. The first one represents systems regarding their constitutions (structure). The second one defines them according to the provided services (dynamic and function). With respect to the first standpoint, system is either a finite number of elements in relationship, forming a whole (Wihelmsson and Johanson, 2009), or a set of interactive and interconnected elements (International Electrotechnical Commission, 2006), (IEC, 2007). For the
Proceedigs of the 15th IFAC Symposium on Information Control Problems in Manufacturing May 11-13, 2015. Ottawa, Canada
Copyright © 2015 IFAC 998
second point of view, a system is defined as a coherent set of elements or processes sharing objectives, responsibilities or common missions (Benoît and Luviano, 2009). Each of these two groups disregards the aspects presented by the other. Under these circumstances, we decided to propose a more generic definition. We then define System as a set of interconnected entities facilitating flow circulation, in order to fulfil specified functions.
Complex system refers to several attributes (Emergence, Uncertainty, sudden transition, path dependency, Evolution dynamic, Interaction, Inter definition, self-Organization, etc.). For these reasons, we define complex system as large number of none hierarchized and disturbed element, which interact not only each other, but also with the external environment. From these definitions, infrastructure network, investigated in this paper - can be seen as a class of complex system. Infrastructure is also named critical infrastructures, lifeline systems (Zio, 2009), systems-of-systems (Zio, 2009), (Eusgeld et al., 2011), critical infrastructure systems (Wang et al., 2013), critical system, technical infrastructure, socio-technical system, vital infrastructure, large-scale system, super-system, technological networks (Council, Scientific And Technical, 2006) etc. Infrastructure network complexity is justified by the high number of integrated technologies, state variables and sensitivity to risk and uncertainty (F.G., 2008). Moreover, infrastructures consists of large numbers of elements and relationships, with nonlinear interactions, time delays and unintended feedback loops that can lead to unpredictable behaviour (Wihelmsson and Johanson, 2009). For these reasons, it is defined as a network of independent, mostly privately-owned, man-made systems and processes that function collaboratively and synergistically to produce and distribute a continuous flow of essential goods and services (“President’s Commission on Critical Infrastructure Protection, Critical Foundations: Protecting America’s Infrastructures (1997). [Online]. Available: http://www.ciao.gov,” n.d.). The term infrastructure network in this paper refers to networks such as power grid, gas and telecommunication systems. In this section we have shown that infrastructure networks are complex systems. The next section describes the case study of the city of Lourdes.
3. CASE STUDY
To validate our proposal we used infrastructure network of the city of Lourdes in the “Hautes-Pyrénées” (France). Indeed, the Hautes-Pyrénées lies in the highest seismic area in the French metropolitan country. Lourdes is a pilgrimage city since 1858. For instance, the city hosted during the 150th anniversary of the Virgin apparition nearby 70,000 pilgrims per day. We suggested an analysis of the sewage network for an earthquake of 8 on Richter scale. That corresponds to the maximum amplitude recorded since 1660. This earthquake occurred in Bigorre (Juncalas) the 03/24/1750 at 22h00. The objective is to analyse the vulnerability of the city’s infrastructure networks, and the population against earthquake. The following problems arise from this situation (Holmgren, 2007):
What can fail?
What are the consequences? How can this happen?
How to retrieve a nominal state?
To answer these questions, the representation has to be performed first. The next section presents our proposal for this representation.
4. PROPOSAL OF COMPLEX SYSTEM REPRESENTATION
Socio-technical systems are critical for societies well-functioning. But before the simulation, the analyst has to make a transposition from the real system to it representation into a model.
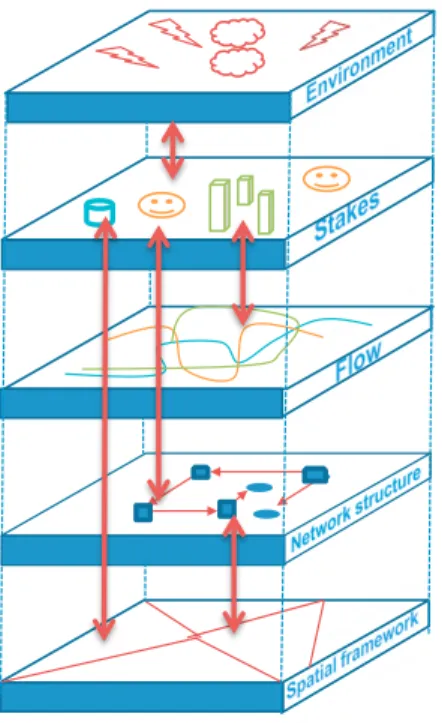
Fig. 1. Complex system representation
The model we propose for the complex system representation is composed of five layers as shown in Fig. 1: spatial framework, network structure, flow, stakes, and environment. Each layer interacts with the others. They are presented in the following.
4.1 Spatial framework
Most of complex system evolves inside a spatial framework such as land, sea, air or a combination of primary elements. For instance, planes fly in the air, road are built on the land. This framework structures space as the localization of decisions makers, actions; and activities (Le Boulch, 2001). Parameters of special framework have to be integrated in the system model. For infrastructure network, the special framework is the Territory.
INCOM 2015
May 11-13, 2015. Ottawa, Canada
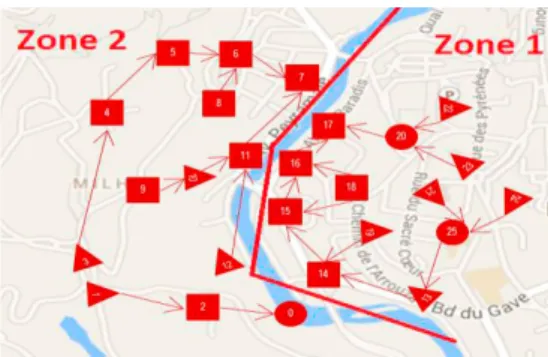
Fig. 2. Spatial framework of Lourdes
Spatial framework is characterized by its decision makers, set of actions, risks, limits and stretch. The stretch is the surface area, calculated by the software. It can be used as criteria in decision making (Kamissoko et al., 2013).
For the Lourdes’ case study, the spatial framework is the city itself. We divided the city into two zones delimited by the river (Fig. 2). One decision maker is assigned to each of them by the Departmental Direction of Equipment. For the two zones, we determined set of actions that can be took. For instance; construction of an evacuation centre, adding outlet pipes, pumping stations etc. Flood and earthquake are the identified risks. But the analysis was performing only for the earthquake which is the most feared risk for the city.
The spatial framework supports the network structure presented in the next.
4.2 Network structure
As defined, infrastructure consists in set of interlinked elements. We use graph theory for these elements modelling. Nowadays, this theory is applied to many disciplines like organic chemistry modelling (Baláž et al., 1992), mechanical system reliability analysis (Tang, 2001), representation of engineering systems (Shai and Preiss, 1999), infrastructure network, (Kamissoko, 2013) etc.
A finite graph is defined by a finite set of nodes G={V1, V2…VN} (|V|=N); and finite set of edge E = {E1, E2…EM}; (|E|=M). 4 5 1 2 3 6 7 8 5 1 0.6 3 2 4 2.8 1.9
Fig. 3. Network structure
Fig. 3 shows a representation by graph theory of a power grid. In this representation, the shape depends on the node’s function. For instance, nodes which consume flux (nodes 5, 4, and 8) are circle, treatment nodes (nodes 2, 3, and 7) are square, and source nodes (nodes 1 and 6) are triangle. The criterion for weight is the transportation cost. It cost 5 units to transport electricity from the node 5 to the node 2.
With this representation, we argue that:
Nodes have many types: A source component produces flow, treatment node changes the qualitative attributes flow, and target node provide stake in flow. In Fig 3. The node type is represented by its shape.
Edges are weighted: The weight of an edge reflect relevant criteria in the analyst point of view. It can be the geodesic distance, the time, the cost, or an aggregation of many parameters. For instance the weight between the nodes 1 and node 2 in Fig. 3. is 5.
Edges are directed: The direction denotes the sense of the relationship between two nodes.
With this representation it is possible to assess some structural parameter of the graph: Betweenness centrality, the average path length, the connectivity, etc. These parameters are used in some vulnerability and risk models (Holme et al., 2002), (Arianos et al., 2008).
Fig. 4 shows part of the sewage network of the city of Lourdes according to our proposal. It consists in outlet pipes, pumping stations (rectangle), water treatment plants (triangle), and manholes (circle).
Fig. 4. Case study infrastructure network
The infrastructure is separated from the flow. This circulating element is presented in the section.
4.3 Flow
Complex system dynamic is supported by the exchange of flow inside the structure. Flow represents matter, energy, data, information and knowledge circulating from source to target nodes. In this paper, flow is to be discrete. These dynamic parameters are at the origin of the global fluctuation of the system state. Generally, all of the elements described before could be dynamic due to the change in their parameters. However in terms of participation in emergence, flows are prominent.
Flow is characterized by a type, a nominal speed, a circulation law, reliability, a mean time to recover etc. The circulation law describes the path in the physical network. We argue that each flow in network might have at least one circulation law. In the absence of an explicit function, circulation law of one flow will be equitably shared among component at any time.
INCOM 2015
May 11-13, 2015. Ottawa, Canada
1000
For the network of Lourdes, the only flow is the wastewater. For this flow, the circulation direction is imposed by the network structure. The unit is the cubic metre. The city consumed approximately 3 millions of cubic metre of water every year. The capacity of pumping stations, water treatment plants is 7, 000 cubic metre (700 cubic metre per hour). The speed is supposed to be 3 meter per second.
The flow could be provided or consumed by stake described in the next.
4.4 Stake
Somme elements of the network structure or special framework could be important for the analyst point of view. These elements are called stake. We define it as a material or immaterial entities consuming flow and providing a function whose deterioration is damageable or prejudicial for the society. It is assimilated to Societal Critical Function in (Utne et al., 2011). Stake is part of the network structure or flow. It has necessary the characteristic of those.
After some interviews with the authorities of Lourdes city, we decided to focus on the human stake. This decision was taken because pilgrims represent a wide population. The city is full of 16,000 people. But it hosts every year nearly 6 million of pilgrims or tourists for which approximately 60,000 are sick or invalids. This reason justified the choice of population as the main stake in our model. This stake is drawn on the network structure as supplementary nodes. Network structure, flow and stake interact with the environment presented in the next.
4.5 Environment
The environment framework is the limit outside the complex system. It assumes the presence of anthropic or natural phenomena which is not under control. In the literature environment framework refers to events also called Incident, Hazard (Ezell et al., 2000), (Berdica, 2002), disturbance, threat (Wang et al., 2013), elementary event, initiating events, perturbation (Holmgren, 2007), strain, danger, accident. Environment is full of hazard defined as natural or anthropic phenomenon for which it’s not possible to predict together the occurrence and the intensity, and susceptible to affect one component state. Thus, a hazard may be natural, climatic, technical, human, an act of sabotage, terrorism or war (Holmgren, 2007).
Hazard is characterised by an occurrence point, a probability, a stench, a speed, a lasting time, and a propagation mode etc. For the city of Lourdes, we focused on earthquake. Its period for an amplitude of 8 is between 75 and 250 years according seismic data. We have chosen the minimal period of 75 years. For this reason, the simulation is performed for 100 years. We supposed that the worst case will correspond to a double
occurrence of the earthquake. When it occurs it will affect components within a circular perimeter of 12 kilometres across, with a speed of 6 meters per second.
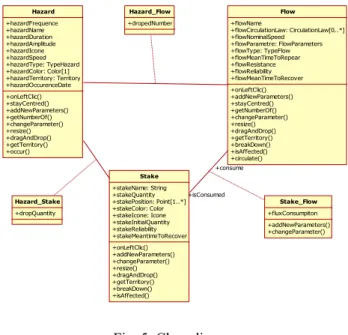
Our proposal in term of modelling is traduce by using the Unified Modelling Language (UML). The Fig. 5 shows an extract of relationship between hazard, stake and flow with their characteristics and behaviours.
In this chapter, we have described the five layers of our proposal. The next one addresses the dynamic behaviour that might exist between these layers.
Flow +flowName +flowCirculationLaw: CirculationLaw[0..*] +flowNominalSpeed +flowParametre: FlowParameters +flowType: TypeFlow +flowMeanTimeToRepear +flowResistance +flowReliability +flowMeanTimeToRecover +onLeftClic() +addNewParameters() +stayCentred() +getNumberOf() +changeParameter() +resize() +dragAndDrop() +getTerritory() +breakDown() +isAffected() +circulate() Stake +stakeName: String +stakeQuantity +stakePosition: Point[1..*] +stakeColor: Color +stakeIcone: Icone +stakeInitialQuantity +stakeReliability +stakeMeantimeToRecover +onLeftClic() +addNewParameters() +changeParameter() +resize() +dragAndDrop() +getTerritory() +breakDown() +isAffected() Hazard +hazardFrequence +hazardName +hazardDuration +hazardAmplitude +hazardIcone +hazardSpeed +hazardType: TypeHazard +hazardColor: Color[1] +hazardTerritory: Territory +hazardOccurenceDate +onLeftClic() +stayCentred() +addNewParameters() +getNumberOf() +changeParameter() +resize() +dragAndDrop() +getTerritory() +occur() +consume +isConsumed Stake_Flow +fluxConsumpiton +addNewParameters() +changeParameter() Hazard_Stake +dropQuantity Hazard_Flow +dropedNumber
Fig. 5. Class diagram 5. DYNAMIC BEHAVIOUR
Due to the flow circulation, complex systems have dynamic behaviour. This behaviour is enhanced by the relationship among network structure and the variation of the system state.
Relationship is also called interdependence, dependency, dependence, interdependency (Utne et al., 2011), interconnectedness (Utne et al., 2011). Those terms refer to relationship between two components of same or different network structure. We define relationship as a situation through which a component is provided in flow or affected by another component state variation. Interdependence could be functional or representative of a constraint. A component T depends on a component T’ whether there is a flow transiting between T and T’. The flow in this case could be or not existing flow. A component T’ is influenced by a component T if there is at least one state of T causing the changing of the state of T’ without flow circulating. Therefore the influence between components exists only for some states, named influence states. Components involved in influences are represented by a finite number of states. In order to model influences and dependences between components, virtual edges and virtual nodes are introduced.
INCOM 2015
May 11-13, 2015. Ottawa, Canada
1001