Any correspondence concerning this service should be sent
to the repository administrator:
tech-oatao@listes-diff.inp-toulouse.fr
This is an author’s version published in:
http://oatao.univ-toulouse.fr/26639
To cite this version: Ciszak, Clément and Abdallah, Iman and
Popa, Ioana and Brossard, Jean-Michel and Vande Put, Aurélie
and Monceau, Daniel and Chevalier, Sébastien Degradation
mechanism of Ti-6Al-2Sn-4Zr-2Mo-Si alloy exposed to solid
NaCl deposit at high temperature. (2020) Corrosion Science,
172. 108611. ISSN 0010938X
Official URL
DOI :
https://doi.org/10.1016/j.corsci.2020.108611
OATAO is an open access repository that collects the work of Toulouse
researchers and makes it freely available over the web where possible
Titanium Alloy SEM TEM
High temperature corrosion Internal oxidation
at 560 °C. The active oxidation mechanism at the origin of the corrosion phenomenon enhancement in presence of solid NaCl is thought to be connected to the formation of both external and internal thick oxidation areas. Thermodynamic calculations allowed showing the role played by the different alloying elements in the forma-tion of the external oxide and detailed TEM characterisaforma-tions brought new insights regarding the nature and origin of the internal oxidation area.
1. Introduction
Active oxidation is a severe degradation process. It is known to occur in different fields such as waste-to-energy conversion, materials recycling and aeronautics. Many works have been dedicated to the study of active oxidation of steels [1] and Ni-based alloys [2], in rela-tion to their use in waste-to-energy facilities. These studies especially identified the role of the different metallic elements (Fe, Ni, Cr, Mo, Mn …) on the overall active oxidation process. Much less studies have been performed on Ti alloys, which can also be subjected to active oxidation when used in high temperature aeronautical applications. Similarly to steels and Ni-based alloys, Ti has been alloyed with several elements (such as Al, Nb, Zr …) to improve the behaviour of its alloys at high temperature [3–5], including their oxidation resistance.
High temperature oxidation of Ti and Ti-based alloys in classic conditions (e.g. in air or oxygen without any deposit) has been widely studied. Titanium has a high affinity for oxygen and oxidizes by forming an external scale composed mainly of rutile TiO2, which grows
by anionic diffusion. In case of based alloys containing Al, such as Ti-6Al-4 V or Ti-6Al-2Sn-4Zr-2Mo-Si, the outer part of the oxide layer often contains Al2O3[6–12]. Furthermore, Ti and Ti-based alloys can
dissolve large quantities of oxygen, up to 33 at. % for pure α-Ti. Oxygen can diffuse deep inside the metallic substrate, forming an α-Ti(O) solid solution which leads to the hardening and embrittlement of the affected region [8,13,14]. A few number of studies have evaluated the thickness
of the oxygen affected zone (OAZ) in case of Ti-6Al-2Sn-4Zr-2Mo alloy. For instance, OAZ thicknesses of around 9 μm, 15 μm and 30 μm were reported for oxidations of 100 h at 650 °C [11] and 500 h at 538 °C [15] and 593 °C [15,16], respectively. These results, coupled with those obtained by Berthaud et al. [17], tend to indicate that OAZ thickness essentially depends on both time and temperature, which is confirmed by analyses of experimental data in a recent review [18].
Very few studies reported a degradation of the oxidation resistance of Ti-6Al-2Sn-4Zr-2Mo-Si alloy or close-composition alloys under solid NaCl deposits [19–23]. None of them proposed a clear mechanism. They only showed parabolic-like [21,22] or parabolic-then-linear [19] oxidation kinetics, whose weight gains appeared, in the first case, 6–10 times larger than those observed in dry air. In each case, damaged corrosion scales (porous, cracked and non-adherent) were observed. Corrosion scales also appeared layered, composed of a rather dense inner part and a rather porous outer part [19–21]. The external part of the corrosion scales was reported to be generally composed of rutile TiO2, surmounted by a mixed Na-,Ti-rich oxide (Na4Ti5O12[10,22–26],
Na2Ti6O13 [23], Na2TiO4 [27], Na2TiO3 [5,20,28,29], NaTiO2 [30]),
whereas its internal part also included oxides of certain alloying ele-ments (Al2O3, ZrO2and SnO2) [19,22]. Formation of these corrosion
products were often hypothesized to result from active corrosion me-chanisms involving volatile chlorides [5,10,20,22–26,28–31] and, more rarely, chloride ions [19,22]. These metallic chlorides are supposed to form at the alloy|oxide interface, then to diffuse outward, reacting with
⁎Corresponding author at: CIRIMAT-ENSIACET, UMR CNRS 5085, 31030 Toulouse, France.
1Present address: Department of Engineering physics, University of Wisconsin-Madison, Madison,WI 553706, USA.
O2to form oxides of the different elements present in the alloy and
release gaseous Cl2. This later gas release might justify the presence of
blisters and pores. Furthermore, the presence of salts on the material surface was found to strongly influence the formation of the OAZ, which is replaced in this case by an internal oxidation area [10,20,22–25,28].
Such internal oxidation area, unusual for Ti and Ti-based alloys, seems to first develop along grain boundaries of the metallic matrix, before expanding inside the grains [19,20,23,25,28–30]. In some cases, this expansion inside the metallic grains appears inhomogeneous and directional, looking like spaced oxide fingers growing in parallel di-rections [19,22,23]. Fan et al. [19,22] reported this internal oxidation area to be composed of TiO2and Ti2O.
In our previous study dedicated to Ti-6Al-4 V alloy [10], a chanism for the active oxidation of Ti alone was proposed. This me-chanism involved the formation of a reaction intermediate in the form of gaseous TiCl4, achieving transport of Ti from the metallic matrix to
the oxide scale and its subsequent oxidation as soon as a critical oxygen partial pressure is reached. However, contrary to what has been done for steels [1] and Ni-alloys [2], the behaviour of alloying elements were not considered.
The aim of the present study is therefore to better understand the influence of NaCl deposit on the high-temperature oxidation behaviour of the Ti-6Al-2Sn-4Zr-2Mo-Si alloy, with a particular focus on the role played by the alloying elements and the formation of the internal oxi-dation area. Samples were analysed by means of X-ray diffraction (XRD) and scanning electron microscopy (SEM) coupled to energy dispersive X-ray spectroscopy (EDS). Oxygen dissolution areas were investigated through hardness and EDS measurements. A specific transmission electron microscopy (TEM) characterisation campaign involving TEM-EDS, electron energy loss spectroscopy (EELS), selected area electron diffraction (SAED) and high magnification imaging, was finally dedicated to the study of the internal oxidation area.
2. Material and methods
Ti-6Al-2Sn-4Zr-2Mo-Si alloy used in this study is a Ti-based alloy, containing 6 wt. % Al, 2 wt. % Sn, 4 wt. % Zr, 2 wt. % Mo and 0.1 wt. % Si (Table 1). It has an equiaxed microstructure composed of α (HCP) phase and β (BCC) phase. Square samples measure approximately 7 mm x 7 mm and are 4 mm thick. All the specimens were mechanically ground using SiC papers up to P600 grit [21,30–32] and were then cleaned in ethanol.
NaCl deposits were performed by spraying a saturated NaCl solution at the surface of the samples. The detailed spraying procedure was exposed previously in reference [10]. This method allows to obtain fully covering deposits of approximately 3–4 mg.cm−2of NaCl [10].
Samples exposed to laboratory air without and with NaCl deposit, named A and NA respectively, were oxidised in Carbolite CWF 1300 muffle furnaces at 560 °C during 600 h. Both samples were analysed through two successive steps. Surfaces were first characterized, fol-lowed by analyses of polished cross-sections. Cross-section preparation was previously described in reference [10].
Surface and cross-section analyses were performed by scanning electron microscopy (SEM) using JEOL JSM-7600 F set-up in back-scattered electron (BSE) and secondary electron (SE) contrasts. The elementary composition of corrosion products was analysed with
energy dispersive X-ray spectroscopy (EDS). The crystalline structure of the corrosion products was determined by X-ray diffraction (XRD) using an Inel CPS 120 diffractometer and the Cu Kα (λ =0.154 nm) radiation with fixed incidence angles ranging from 1° to 12° (depending on cor-rosion scale thickness). Vickers micro-hardness measurements were performed using a BUEHLER 1600-6100 apparatus. 10 g loads were applied, leading to indents with a diagonal lying between 5 and 10 μm. Indentations were performed over the whole thickness of the metallic material, every 10 μm near the surface (for the first 100 μm), then every 100 μm up to 500 μm and then every 500 μm until reaching the middle of the sample.
For further understanding of the internal corrosion area, a fine characterisation was performed. A cross-sectional 10 × 10 μm2
trans-mission electron microscopy (TEM) lamellae of the internal oxidation area region was prepared using focused-ion beam (FIB) FEI HELIOS 600i apparatus. A systematic analysis was sequenced as follows: firstly, a general description of the observed region was done with EDS semi-quantitative analysis of selected areas, secondly electron energy loss spectroscopy (EELS) line scan probe was acquired near EDS areas for quantitative analysis of light elements such as oxygen in particular. Finally, selected area electron diffraction (SAED) patterns were re-corded to identify the crystalline structure of the different compounds. Elemental and chemical characterisations (EDS and EELS respectively) were performed using JEOL cold-FEG JEM ARM 200 F apparatus op-erated at 200 kV equipped with Cs corrector probe of 0.078 nm spatial resolution. EELS spectra were recorded using GIF Quantum ER imaging filter with collection and convergence semi angles equal to 19.4 and 14.8 mrad, respectively. The collected spectra were acquired each 4 nm with an energy resolution of 0.5 eV determined by the full width half maximum (FWHM) of the recorded zero-loss peak. An energy disper-sion of 0.1 eV/channel was chosen to acquire Ti-L2,3and O-K energy
loss near edges spectra (ELNES). Low magnification, electron diffrac-tion (ED) and high magnificadiffrac-tion TEM images were acquired using field emission gun FEG-TEM JEOL JEM 2100 F operated at 200 kV.
Factsage 6.4™ was used to perform thermodynamic calculations, in order to identify the role of different alloying elements on the active oxidation mechanism proposed in a previous study [10].
3. Results
3.1. Weight gains per unit area
The sample oxidised for 600 h at 560 °C in laboratory air (sample A) presents a small mass gain per unit area, of 0.28 ± 0.10 mg.cm−2. This
result is consistent with results obtained by McReynolds and Tamirisakandala in similar conditions of exposure [15].
The NaCl-coated sample (NA) exposed to laboratory air for 600 h at 560 °C shows a mass gain per unit area 12 times higher (3.41 ± 0.12 mg.cm−2) than that of the sample without any deposit
exposed to laboratory air under the same conditions.
3.2. Oxidation test in laboratory air without NaCl deposit (sample A) Surface observations of the sample exposed to laboratory air at 560 °C for 600 h show a homogeneous aspect (Fig. 1a). InFig. 1a, light regions (enriched in Mo and locally in Zr) and dark regions (enriched in Al), can be associated with the underlying β- and α-phases of the Ti-6Al-2Sn-4Zr-2Mo-Si alloy respectively. The observation of the initial alloy microstructure suggests the presence of a very thin oxide layer at the surface of the sample.
The global EDS surface analysis is presented inTable 2. It indicates the presence of Ti and O predominantly and of low quantities of Al, Zr, Sn and Mo. These results, coupled with XRD analysis (Fig. 2), indicate that in the present conditions, the material oxidation leads to the for-mation of TiO2rutile and anatase mainly (ICDD n° 00-021-1276 and
ICDD n° 03-065-5714 respectively). The presence of strong signals
Table 1
Average chemical composition of the as received Ti-6Al-2Sn-4Zr-2Mo-Si alloy, obtained by EDS analysis.
Elements Ti Al Sn Zr Mo Si
Chemical composition wt. % Bal. 5.8 2.4 4.8 2.5 0.1 at. % Bal. 10.3 1.0 2.5 1.3 0.2
corresponding to α-Ti (ICDD n 00-044-1294) is another evidence of the very low thickness of the oxide layer.
Cross-section observation (Fig. 1b) confirms the previous results by revealing the presence of a very thin ( 200 nm), dense and adherent oxide layer.
Fig. 3presents the micro-hardness profile versus the distance from the alloy|oxide interface. Oxygen EDS profile is also depicted. Indeed, it is well known that in Ti-based alloys oxygen dissolution leads to surface hardening. Comparing micro-hardness with oxygen profile near the alloy surface is therefore a common method to determine OAZ thick-ness [33], although micro-hardness is more sensitive to low O contents (below 1 at. %) than EDS and EPMA [18].
A high hardness value of 530 HV0.01was measured in the external
part of the substrate close to the alloy|oxide interface. Then the hard-ness value quickly decreases with the distance from the alloy|oxide interface. At around 25 μm, it reaches the average value measured for the Ti-6Al-2Sn-4Zr-2Mo-Si bulk alloy (325 HV0.01). In parallel, the O
content also decreases from 32 at. % at the interface, to 2 at. % at 10 μm from the interface. It should be noted here that because of O surface pollution (native oxide), the O contents measured by EDS are over-es-timated by a few at. %. Therefore, the values mentioned above should not be considered quantitatively accurate.
3.3. Oxidation under NaCl deposit in laboratory air (sample NA) 3.3.1. Surface and cross-section analyses
Surface observations of the sample with a NaCl deposit exposed to laboratory air (NA) for 600 h at 560 °C (Fig. 4) reveal a heterogeneous
Fig. 1.Surface micrograph in SE contrast (a) and cross-section micrograph in BSE contrast (b) of sample A oxidised 600 h at 560 °C in laboratory air.
Table 2
Surface EDS analyses performed on sample A.
Sample Content (at. %)
Ti O Al Zr Sn Mo Si
A 33.4 60.5 4.2 1.0 0.4 0.4 0.1
Fig. 2.Diffraction pattern of the XRD analysis performed on sample A after 600 h at 560 °C in laboratory air.
Fig. 3.Micro-hardness (◆) and relative oxygen content (○) (obtained by EDS)
profiles versus distance from the alloy|oxide interface of sample A after 600 h at 560 °C in laboratory air.
aspect with blisters and cracked corrosion products.
Results of EDS surface analyses are presented inTable 3. They in-dicate the presence of Ti and O predominantly and a small amount of Na.
Fig. 5presents XRD analysis performed on the corrosion scale of the sample NA. For this purpose, the scale present on one side of the sample was completely removed and crushed into powder. Combining EDS non-quantitative surface chemical composition with XRD results (Fig. 5), allow to stipulate that corrosion products are mainly composed of rutile TiO2(ICDD n° 01-070-7347), with small amounts of Na4Ti5O12
sodium-titanium mixed oxide (ICDD n° 00-052-1814). XRD pattern also indicates the presence of a zirconia-type phase (ZrO2(ICDD n°
01-070-2491)), doped by metallic elements of the alloy, like Al and Ti. A small amount of γ-Al2O3(ICDD n° 00-047-1292) was also found.
Cross-section examination (Fig. 6a) indicates the presence of a thick (about 50 μm), cracked, porous and non-adherent oxide scale on the material surface.
EDS elementary X-ray maps (Fig. 6b–j) show that the oxide scale is composed of four different layers. The outermost part is a thin mixed
sodium-titanium oxide which, according to XRD and EDS surface ana-lyses, should correspond to hexagonal Na4Ti5O12. Just below this layer,
there is a very thick layer of rutile TiO2according to XRD results. Then,
elementary X-ray maps and XRD indicate the presence of monoclinic ZrO2-type oxide, followed by a layer of cubic γ-Al2O3.
Micrograph in BSE contrast (Fig. 6a) also reveals the presence of two internal corrosion areas confirmed by EDS elementary X-ray maps (Fig. 6b–j). The thickness of these internal corrosion areas reaches up to 45 μm from the alloy|oxide interface. The upper half part corresponds to a highly cracked and fully oxidised area. A small amount of Cl can be noticed at this specific location. This first zone is then followed by a partially oxidised area, depleted in Ti (as shown inFig. 6c), which ends with large cracks and grain ravelling deep inside the metallic matrix.
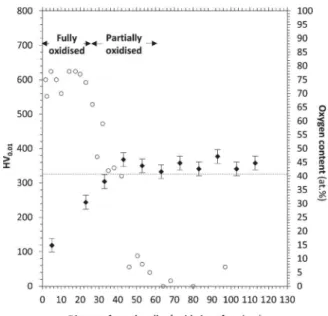
Fig. 7presents the micro-hardness profile and the relative O content versus the distance from the alloy|oxide interface. The oxygen profile appears to be constant – at an average of around 75 at. % –, along the first 25 μm, confirming the internal oxidation. Oxygen content then quickly decreases and stabilizes to around 5 at. % at approximately 50 μm from the alloy|oxide interface. Again, due to O surface pollution, the O contents measured by EDS are certainly over-estimated by a few at. %.
Unlike the previous cases of sample A, values of micro-hardness strongly decrease here when approaching the alloy|oxide interface. Micro-hardness progressively decreases from the average value of 325 HV0.01(for the bulk material) at 35 μm, down to 120 HV0.01at the
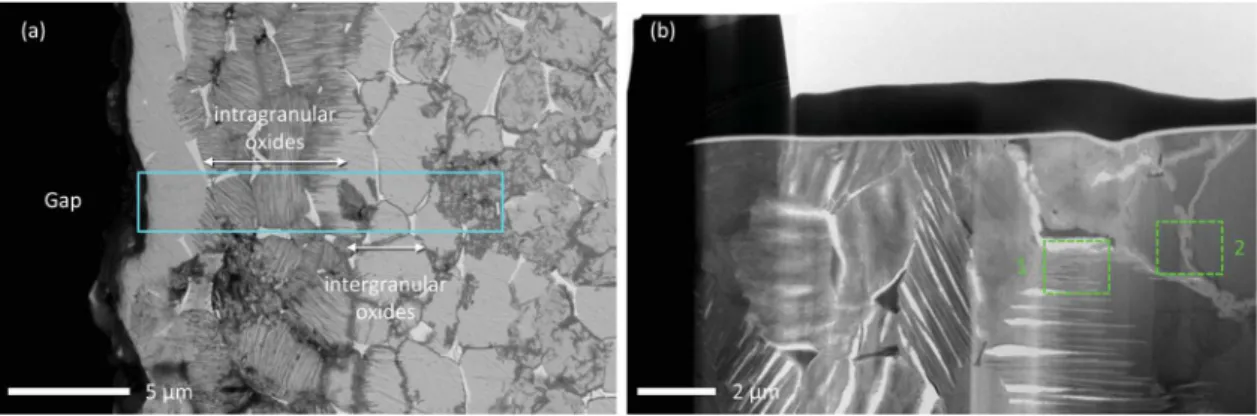
al-loy|oxide interface. These very low values of micro-hardness are ob-viously related to the cracking and grain ravelling present in this area. Fig. 8presents detailed micrographs in BSE and SE contrasts of the internal oxidation area in sample NA.
In agreement with O contents shown inFig. 7, this internal oxida-tion area appears to be composed of a fully oxidised outer area, fol-lowed by a partially oxidised inner area. In the fully oxidised area, the equiaxed microstructure of the initial metallic matrix seems to be pre-served after oxidation into TiO2, according toFig. 6a. This fully
oxi-dised area also appears highly damaged: it presents many cracks and grain ravelling. Furthermore, oxidation of α grains appears to be di-rectional, leading to a lathlike structure, as already observed by Fan et al. [19] in Ti60 alloys after exposure to NaCl solid deposit in moist air for 20 h at 600 °C.Fig. 8b andFig. 8c, present respectively the BSE and SE images of a same grain. The absence of strong topological variations in the SE micrograph (Fig. 8c) shows that BSE contrast of the lath-like structure (observed inFig. 8b) does not correspond to voids created by the previously mentioned loss of Ti, but rather to intra-granular che-mical heterogeneity.
In the partially oxidised area, this lath-like structure appears to be more or less present in the α-grains, depending on the oxidation
Fig. 4.Surface micrograph in SE contrast of sample NA oxidised 600 h at 560 °C
in laboratory air with NaCl deposit.
Table 3
Results of surface EDS analyses performed on sample NA.
Sample Content (at. %)
Ti O Na
NA 21.2 69.9 8.9
progress. Only a part of each grain has this lath-like structure, while the rest exhibits the metallic aspect that can be seen in the lower part of Fig. 8a. This microstructure suggests that the grains located in the partially oxidised area are composed of both fully oxidised parts and metallic parts. The relative evolution of the oxygen profile acquired in the partially oxidised area (Fig. 7), can also be discussed. Indeed, since the grains composing it are partially oxidised, the high O contents found – which would normally indicate the presence of an oxygen dissolution area – might also result from an average between the O content of both oxidised and un-oxidised regions. Thus, it is rather difficult to exclude or confirm the presence of oxygen dissolution areas.
3.3.2. TEM detailed characterisation of the internal oxidation area In order to get more information concerning the specific and unu-sual microstructure of the internal oxidation area, a detailed TEM analysis was performed.
Fig. 9a shows a SEM micrograph in BSE contrast of the internal oxidation area. Two different oxide morphologies can be noticed on this micrograph: intragranular oxides (represented by equiaxed partially oxidised grains) followed by a region of intergranular oxidation (with oxidised grain boundaries). The selected area for FIB TEM lamellae sample preparation is denoted by the light blue rectangle that contains
the different regions of interest (ROI). Two ROI were investigated de-noted as region 1 and region 2.Fig. 9b presents a low magnification image of the TEM lamellae observed in Scanning TEM (STEM) bright field (BF) mode with the two ROI that were investigated.
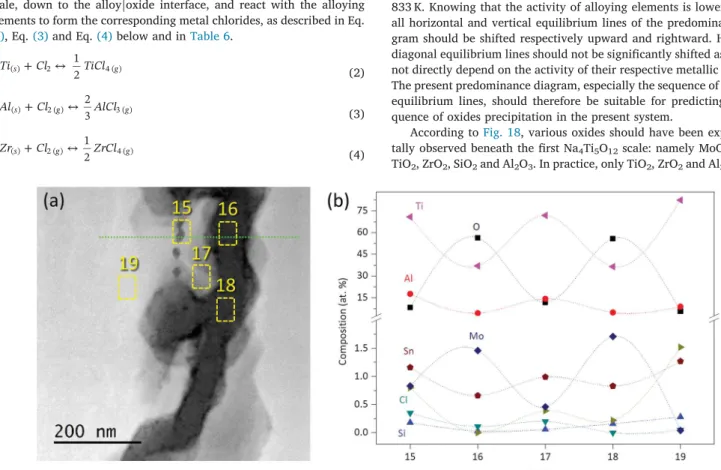
3.3.2.1. Region 1: intragranular oxidation area. A high magnification TEM bright field (TEM-BF) image of region 1 is shown inFig. 10. This region of the sample consists of laths (grey areas) formed in the metal matrix (black areas) with some voids (white areas). Regions where EDS (yellow), EELS (green) and ED (orange) analyses were performed are also reported inFig. 10.
Fig. 11a was obtained using high-angle annular dark field STEM-HAADF imaging mode. Using this mode, the image contrast depends on the atomic number (Z) where the brighter and darker regions corre-spond to higher and lower Z, respectively.
Fig. 11b presents the results of EDS analyses. It can be noticed an alternating elemental composition between Ti and O as the analysis passes from the bright to dark regions. The atomic concentration of O and Ti is around 62.2 at. % and 27.5 at. % respectively in the dark regions that would indicate the presence of TiO2. Thus, bright regions
would correspond to the remaining metallic matrix, more or less en-riched in O (from 20 to 30 at. %). Al has a mean value concentration of
Fig. 6.Cross-section micrograph of sample NA oxidised 600 h at 560 °C in laboratory air with NaCl deposit, (a) in BSE contrast and corresponding X-ray maps of O
13 at. % and 7 at. % along the metallic and oxidised regions, respec-tively. The other elemental concentrations such as Mo, Sn, Si and Zr are present in very low percentages (below 2.5 at. %). However, neither Na nor Cl were detected by EDS.
These results are confirmed by EELS analyses, whose ELNES spectra are presented inFig. 11c. In 3d transition metals, such as Ti, ELNES spectra are identified by L3and L2white lines that represent the
spin-orbit splitting of 2p core hole and transition to 3d states (L3from 2p3/2
→ 3d and L2from 2p1/2→ 3d) [34,35]. Metallic Ti-L3and L2white lines
are usually detected at 457 and 462.5 eV [36,37]. Ti bonding with O to form oxides, leads to a split in the L2and L3white lines and four peaks
are detected instead of two. This is because of the octahedral co-ordination of Ti with O, splitting the degenerated unoccupied 3d states to lower t2gand higher egbands [38–41]. As the line profile passes from
bright to dark regions inFig. 11a, the intensity and ELNES position of Ti-L3and L2edges change along with a decrease in intensity and profile
change of O-K edge. This change corresponds to an alternation between metallic and oxidised Ti. For example, ELNES spectrum 9 reflects the metallic characteristic of Ti-L2,3white lines with no detection of O-K
edge. However, in ELNES spectrum 8, the Ti-L2,3edges is shifted to
higher energy loss values where L2and L3white lines split to lower t2g
and higher eg bands denoted by ‘a’ and ‘b’. This change in ELNES
spectrum of Ti is accompanied by an increase in O-K edge intensity. Similarly to EDS results, neither Na nor Cl were detected by EELS.
To get more information on the formation of the oxidised laths, SA EDS analyses have been done at the end tale of one lath denoted by small circles inFig. 10and summarized inTable 4. If position 10 EDS spectrum confirms the presence of Ti oxide, spectra acquired along the lath growth direction and on each side of this direction do not put in evidence any noticeable composition difference between both zones.
EELS technique can also give access to the oxidation state of the analysed elements, through the fingerprint approach based on the fine structure. The positions of Ti-L2,3edges were then compared with
va-lues obtained in previous studies [40,42,43]. On EELS spectrum 8 (Fig. 11c), Ti-L2,3edges are compared with a previous study on
Ti-6Al-2Sn-4Zr-2Mo-Si oxidised in synthetic air, where a rutile TiO2scale grew
on the alloy and was identified by EELS and SAED techniques [37]. The comparison of Ti-L2,3ELNES fine structure of spectrum 8 with the work
of Abdallah et al. [37] revealed that the oxide has an anatase structure due to a difference in shape and to a change in position to slightly lower energy loss value of ‘b’ peak [40].
Presence of metallic Ti and anatase TiO2 is confirmed by SAED
whose patterns are presented inFig. 12a and b respectively. ED1 and ED2 patterns were observed using nano-diffraction method. ED1 cor-responds to HCP-Ti structure along [1, 2, 1, 0] zone axis (ZA) with measured interplanar distances. ED2 obtained inside a lath shows a polycrystalline structure of anatase TiO2(JCPDS n° 00-021-1272).
The interface between metallic Ti (dark) and a TiO2lath (light grey)
is presented in a high magnification TEM image (Fig. 13). The α-Ti matrix appears, at this scale of a grain, to be monocrystalline. However, the TiO2lath seems to be composed of several small crystallites of 7 nm
diameter in average, according to the small coherence domains denoted by the colored circles. Moreover, the TiO2 lath obviously appears to
follow a specific growth direction within the α-Ti matrix, parallel to (001) planes, according to the measured interplanar distance of 4.7 Å. However, any orientation relationship between the α-Ti matrix and the TiO2lath crystallites cannot be clearly evidenced.
3.3.2.2. Region 2: intergranular oxidation area. This second region was located deeper in the metallic matrix, just beneath region 1.Fig. 14 presents a low magnification STEM-HAADF image that highlights the regions of ED, EDS and EELS line profile analyses.
A zoom on the EDS region is shown inFig. 15a, where five areas
Fig. 7.Micro-hardness (◆) and relative oxygen content (○) (obtained by EDS)
profiles versus distance from the alloy|oxide interface of sample NA, oxidised 600 h at 560 °C in laboratory air with NaCl deposit.
Fig. 8.Global SEM micrograph in BSE contrast of the first stages of internal oxidation in sample NA (a), and zoom on an α-phase grain partially oxidised in BSE (b)
were selected for the analysis. According to EDS results (Fig. 15b), the small precipitate analysed in EDS spectrum 15 reflects a composition close to Ti3Al, known to be a brittle phase. EDS spectra 16 and 18 give
the elementary composition inside the grain boundary, where high concentration of O is detected (around 60 at. %) reflecting TiO2
composition, whereas EDS spectra 17 and 19 give the elementary compositions of the α-Ti matrix.
Fig. 16presents the ELNES spectra at Ti-L2,3and O-K edges acquired
from the alloy towards the grain boundary. In the alloy (ELNES spectra 10 and 17), metallic Ti-L2,3edges are present with no detection of O-K
edge. Inside the grain boundary (ELNES spectra 13 and 14), along with an O-K edge, Ti-L2,3white lines split to have in total four peaks, the
same signature as TiO2presented in region 1. At the interface between
the alloy and grain boundary (ELNES spectra 12, 15 and 16), a change in shape and position of Ti-L2,3edges can be also noticed, showing the
transition between metallic Ti and TiO2. ELNES spectrum 11
corre-sponding to the precipitate that was identified as Ti3Al has a signature
similar to metallic Ti.
Additionally, ED was performed in the alloy (ED3 region inFig. 14) and the grain boundary (ED4 region inFig. 14), of which diffraction patterns are shown inFig. 17. The α-Ti structure is shown inFig. 17a along [0,1, 1, 2] ZA. Again, polycrystalline structure of anatase TiO2is
identified inFig. 17b overlayered with HCP matrix spots.
Fig. 9.SEM micrograph of the sample surface showing in light blue the selected area for a cross sectional TEM lift out lamellae prepared by FIB (a), and low
magnification STEM-BF micrograph showing the two regions to be analysed (b). (For interpretation of the references to colour in this figure legend, the reader is referred to the web version of this article).
Fig. 10.Low magnification of region 1 where the different zones of EDS (yellow
rectangle and circles), EELS (green line), ED (orange circles) and HR (white rectangle) analyses are denoted. (For interpretation of the references to colour in this figure legend, the reader is referred to the web version of this article).
Fig. 11.STEM-HAADF micrograph of the ROI inFig. 10with the yellow rectangular boxes indicating the EDS regions and the green dashed line the EELS line profile
location. (a) Corresponding elementary EDS compositions and (b) ELNES spectra of Ti-L3,2and O-K edges. (For interpretation of the references to colour in this figure
legend, the reader is referred to the web version of this article).
Table 4
Atomic composition of the SA EDS points inFig. 10.
Position Content (at. %)
O Al Si Ti Zr Mo Sn 10 44.4 9.5 0.6 43.7 0.2 1.0 0.6 11 7.0 11.2 0.4 78.5 1.5 0.7 0.8 12 7.5 11.0 0.5 77.9 1.6 0.7 0.8 13 8.2 10.8 0.6 77.7 1.2 0.7 0.8 14 6.4 10.6 0.6 79.0 1.9 0.7 0.7
All results obtained on both samples A and NA are summarized in Table. 5.
4. Discussion
4.1. Oxidation in absence of NaCl deposit
In laboratory air (sample A), oxidation of Ti-6Al-2Sn-4Zr-2Mo-Si alloy for 600 h at 560 °C led to a weight gain per unit area of 0.28 ± 0.10 mg.cm−2. This slight mass increase is consistent with the
parabolic rate kinetics reported by Dupressoire et al. [11]. Corrosion products were mainly rutile and anatase TiO2, in agreement with
pre-vious observations [11]. However, Dupressoire et al. [11] also reported the presence of Al2O3after 100 h oxidation at 650 °C using fluorescence
spectroscopy, although, it was not detectable by XRD, like in the pre-sent study. This is certainly due to its relatively low content as
compared to that of TiO2phase. Similarly, Berthaud et al. [17] also
reported by XPS analysis the presence of Al2O3at the top of the oxide
scale formed on a sample oxidised 100 h at 560 °C. Finally, our results regarding oxide scale thickness (approximately 0.2 μm) and oxygen dissolution area (OAZ) thickness (approximately 10 μm by EDS and approximately 25 μm by micro-hardness) are consistent with previous results obtained by McReynolds and Tamirisakandala [15]. Their EDS results, obtained on a sample oxidised 500 h at 649 °C, suggest that the oxide scale would be mainly composed of Ti-oxide with small amounts of Al- and Zr-oxides.
4.2. Corrosion in presence of NaCl deposit: formation of an external corrosion scale
The presence of a NaCl deposit was shown to be extremely harmful for the material in laboratory air (NA) at 560 °C; the weight gain per unit area (3.41 ± 0.12 mg.cm−2) being 12 times higher than for
NaCl-free sample (A). This detrimental effect of NaCl deposit on the oxidation resistance of pure Ti and Ti-alloys has already been reported in several studies [10,19–21,24,25]. The loss in corrosion resistance in presence of NaCl deposit is thought to be related to an active corrosion me-chanism. This mechanism would rely on the initial reaction of native TiO2with NaCl to form a mixed sodium-titanium oxide and volatile
chlorine, which would then diffuse trough the scale and react with the metallic substrate to form volatile Ti chlorides that will be thereafter oxidised to form Ti oxides [10,20,24,25,30]. The huge depletion of Ti in the internal oxidation area would attest to such an active oxidation process. Thermodynamic calculations performed in a previous study [10] showed that this mechanism can be activated because of the high vapour pressure of the NaCl(g) ↔ NaCl(s) equilibrium at high
tem-perature, which can reach 3 × 10⁻⁷bar at 560 °C [10,44,45].
The as-described active corrosion mechanism allows explaining the formation of thick TiO2 layers during high temperature exposure in
presence of NaCl. Nevertheless, in the case of Ti-6Al-2Sn4Zr-2Mo-Si alloy, the corrosion scale equally contains Zr and Al-based oxides. It is obvious that the mechanism needs to be adapted in order to take into account Zr and Al contributions. Since Sn, Mo and Si oxides are not present in the external oxide layer (as shown inFig. 6for Sn and Mo), the reactions involving Sn, Mo and Si are not taken into account in the mechanism. Thus, based on the present experimental results and on the mechanisms previously proposed for other Ti-based alloys, the corro-sion of Ti-6Al-2Sn-4Zr-2Mo-Si alloy in laboratory air with NaCl deposit (NA) would be based on the following series of reactions, supported by
Fig. 12.Electron diffraction (ED1) of α-Ti along [1, 2, 1, 0] ZA (a) and ED2 of anatase TiO2.
Fig. 13.High magnification TEM image of a TiO2lath apex surrounded the α-Ti
thermodynamics calculations presented inTable 6.
The first step would be initiated by the reaction of the NaCl(g)
va-pour with the native TiO2in presence of O2 (g)(Eq.(1)).
+ + +
NaCl O TiO Na Ti O Cl
4 ( )g 2 ( )g 5 2 ( )s 4 5 12 ( )s 2 2 ( )g (1) The Cl2 (g)formed would then migrate through the damaged oxide
scale, down to the alloy|oxide interface, and react with the alloying elements to form the corresponding metal chlorides, as described in Eq. (2), Eq.(3)and Eq.(4)below and inTable 6.
+ Ti Cl TiCl 1 2 1 2 s g ( ) 2 4 ( ) (2) + Al Cl AlCl 2 3 2 3 s g g ( ) 2 ( ) 3 ( ) (3) + Zr Cl ZrCl 1 2 1 2 s g g ( ) 2 ( ) 4 ( ) (4)
state, it is important to mention that because of the heterogeneous nucleation principle, these reactions of chloride oxidation will pre-ferentially take place on any defect (i.e. material surface, pore surface or crack surface) that would favour them energetically, similarly to what occurs in chemical vapour deposition (CVD) processes. They should therefore lead to the formation of massive products such as oxide layers instead of powders.
Furthermore, depending on local oxygen partial pressure P(O2) and
chlorine partial pressure P(Cl2), each metal chloride will be oxidised
when specific critical values of P(O2) will be reached. These specific
critical values of P(O2) depend on the equilibrium P(O2) of each
chloride oxidation reaction (for a given P(Cl2)). Thus, respective oxides
will form at different locations of the oxide scale, leading to its strati-fication as a function of respective equilibrium P(O2) values of each
chloride oxidation reaction. Based on this mechanism, the initial layer of Na4Ti5O12that composes the surface of the oxide scale would be
followed by a TiO2scale representing the main part of the oxide scale,
then followed by an intermediate layer of ZrO2 and a final layer of
Al2O3 in the innermost part of the oxide scale.Fig. 18 presents an
overlay of the theoretical predominance diagrams of all the alloying elements (Ti, Al, Sn, Zr, Mo and Si) calculated for pure constituents at 833 K. Knowing that the activity of alloying elements is lower than 1, all horizontal and vertical equilibrium lines of the predominance dia-gram should be shifted respectively upward and rightward. However, diagonal equilibrium lines should not be significantly shifted as they do not directly depend on the activity of their respective metallic element. The present predominance diagram, especially the sequence of diagonal equilibrium lines, should therefore be suitable for predicting the se-quence of oxides precipitation in the present system.
According toFig. 18, various oxides should have been experimen-tally observed beneath the first Na4Ti5O12scale: namely MoO3, SnO2,
TiO2, ZrO2, SiO2and Al2O3. In practice, only TiO2, ZrO2and Al2O3were
Fig. 14.Low magnification STEM-HAADF micrograph of region 2, where EDS/
EELS and ED analyses were performed.
Fig. 15.STEM-HAADF micrograph of the ROI inFig. 14with the yellow rectangular boxes indicating the EDS regions in (a) and the elementary compositions in (b).
observed beneath Na4Ti5O12 top layer. A diagram of the reaction
scheme proposed for the formation of such a stratified oxide scale is presented inFig. 19. Despite the fact that formation of some Sn, Mo and Si oxides is thermodynamically allowed, the absence of Sn and Mo oxide layers in the external corrosion scale might be explained by the very low stability of their respective chlorides as compared to Ti, Al and Zr chlorides. The high volatility of MoO3might also explain its absence
at the top of the external oxide layer. The very low content of Si initially present in the Ti-6Al-2Sn-4Zr-2Mo-Si alloy might explain the absence of a continuous Si oxide layer, or the failure to detect it if, nonetheless, it exists.
4.3. Corrosion in presence of NaCl deposit: formation of an internal corrosion area
Despite the fact that internal oxidation of Ti is usually unexpected, the similarity between the microstructure shown inFig. 10a and the initial metallic matrix suggests that metallic grains are converted into oxide grains through a direct oxidation process and do not result from the oxidation of metal-chlorides, as explained above to occur for the external oxide scale formation. Additionally, it can be supposed that
α-grains oxidize preferentially as compared to β-α-grains, due to the higher solubility of O in the α-phase.
In agreement with Fan et al. [19,22], the internal oxidation area was found to be composed of TiO2and α-Ti matrix more or less
en-riched in O. However, SAED analyses performed in the present work revealed that Ti oxide was actually nanocrystalline anatase TiO2rather
than rutile TiO2. As a rutile to anatase transition can occur if the grain
size drops down below 17 nm [46], the TiO2crystallites size, which was
found to be lower than 10 nm, might explain the stability of anatase instead of rutile.
Based on the relative stability of each alloying elements oxide (Fig. 18), the TiO2composing the internal oxidation area (that forms
beneath ZrO2and Al2O3layers of the external oxidation scale) should
not be the most stable at this location. The anatase structure of TiO2
might be an explanation for its unexpected stability at this location. Furthermore, EDS and EELS analyses revealed that, if O dissolves in the metallic parts remaining between the TiO2laths, no sign of O
dis-solution was found downstream of the laths growing-front. This result would attest on the preponderance of the active oxidation kinetics over that of oxygen dissolution and inward diffusion. However, O content obviously appears to be important enough to allow the oxidation of the
Fig. 16.STEM-HAADF micrograph of the EELS line profile (a) and its corresponding ELNES spectra (b).
Fig. 17.Electron diffraction in an α-Ti grain (ED3) for HCP Ti along [0,1, 1, 2] ZA (a) and ED4 in the neighboring grain boundary showing anatase TiO2
grain boundaries and of the matrix depleted in metallic elements. Indeed, because of the active oxidation loop, Ti, Al and Zr would be consumed in the grain boundaries first, followed by the α-grains, leading to a significant decrease in their activity inside the depleted regions. However, if these alloying elements are assumed to be trans-ported outward under a gaseous form (metal chloride), the present EDS and EELS results do not allow to identify whether Cl is carried inward through gaseous diffusion (Cl2 (g)) or solid-state diffusion (Cl−). Due to
the inward O flow (arriving through the numerous cracks and short circuit diffusion paths present in both external and internal oxide
analyses downstream and on each side of a TiO2lath apex did not allow
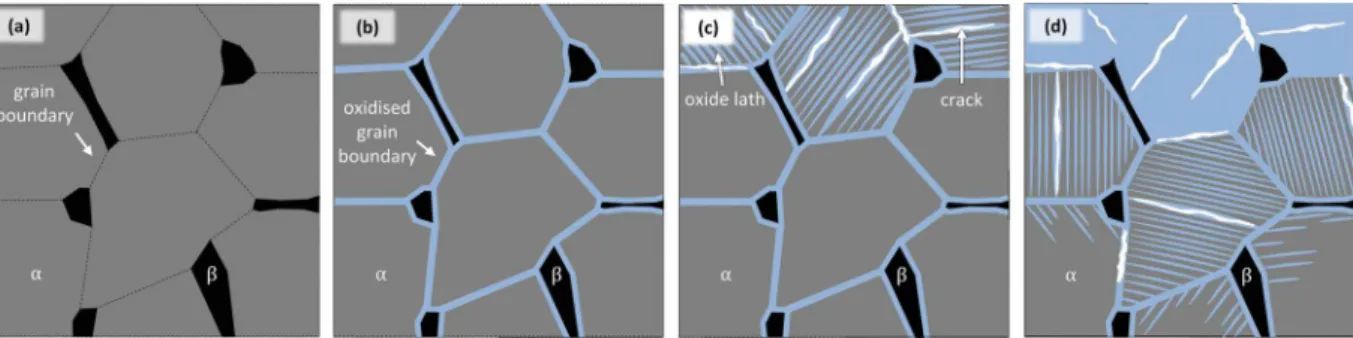
to evidence any chemical heterogeneity within a same α-grain that might explain such a reactivity difference between the oxidised and un-oxidised regions. Moreover, this inhomogeneous and directional in-ternal oxidation appears to be not systematic. Indeed, it did not seem to be observed on pure Ti [24], or some other Ti alloys [10,25]. However, it is surprisingly similar to formation and growth of α-phase grain boundaries and Widmanstätten laths encountered in a β-Ti matrix [47]. The present inhomogeneous internal oxidation phenomenon might therefore be due to some structural heterogeneities, inherited from the thermo-mechanical history of the sample, and fortuitously revealed by the active oxidation process.
5. Conclusion
A large increase in high-temperature corrosion rate was observed for Ti-6Al-2Sn-4Zr-2Mo-Si alloy in presence of solid NaCl deposit. This enhancement is attributed to the presence of Cl2 (g)coming from NaCl
decomposition, which creates an active oxidation loop. In these con-ditions, corrosion of the material leads to the formation of both external and internal oxidation areas, which is unusual for Ti and Ti alloys.
In the case of Ti-6Al-2Sn-4Zr-2Mo-Si alloy, containing several al-loying elements, the active oxidation loop leads to a stratification of the oxide scale. Overlaying the predominance diagrams of each pure al-loying element allows, in a first approximation, to predict the stratifi-cation of the oxide scale. However, the highly restrained evaluation of the partial pressure of each gaseous species, due to oxide scale cracking, may strongly limit the accuracy of these predictions. Such predictions might be improved by correcting each predominance diagram with the actual activity of each alloying element. Despite the simple and rough nature of the present thermodynamic approximations, quite an accurate prediction was obtained regarding the stratification of the external oxide scale.
Detailed SEM and TEM analyses reveal a two steps formation pro-cess for the internal oxidation area. Firstly, grain boundaries of the metallic matrix would be attacked by Cl2 (g) involved in the active
oxidation loop, leading to the oxidation of these grain boundaries. Secondly, Cl2 (g)attack would extend to α-grains, leading to the
for-mation of Widmanstätten-like TiO2laths within the α-grains. EELS and
SAED reveal that these Widmanstätten-like TiO2laths are composed of
nanocrystalline anatase TiO2 surrounded by O-enriched α-Ti matrix.
However, the present results do not allow to identify if the origins of such a heterogeneous internal oxidation phenomenon is of chemical and/or structural nature.
6. Data availability
The raw data required to reproduce these findings cannot be shared at this time as the data also forms part of an ongoing study. The pro-cessed data required to reproduce these findings cannot be shared at this time as the data also forms part of an ongoing study.
Ti-doped ZrO2
Al2O3
Morphology dense porous blistered cracked Internal oxide Fully
oxidised area
Thickness (μm) / 25
Composition / TiO2(anatase)
Morphology / cracked with grain ravelling Partially oxidised area Thickness (μm) / 35
Composition / TiO2(anatase)
Morphology / cracked OAZ Thickness (μm) 10 (EDS)
25 (HV0.01)
/
Table 6
Reactions proposed for the active corrosion mechanisms and their corre-sponding calculated values of standard free enthalpy (calculated with FactSage 6.4 using reaction module and FactPS / FT Oxid and FTSalt databases).
No. Equilibrium equation ΔG0 833K (kJ. mol−1) (1) 4NaCl( )g +O2 ( )g +5TiO2 ( )s Na Ti O4 5 12 ( )s +2Cl2 ( )g / (2) Tis +Cl g TiCl g 1 2 ( ) 2 ( ) 1 2 4 ( ) −331.26 (3) 23Al( )s+Cl2 ( )g AlCl g 2 3 3 ( ) −362.05 (4) Zrs+Cl g ZrCl g 1 2 ( ) 2 ( ) 1 2 4 ( ) −387.03 (5) Sn( )s +Cl2 ( )g SnCl2 ( )g −219.81 (6) Sns +Cl g SnCl g 1 2 ( ) 2 ( ) 1 2 4 ( ) −190.68 (7) Mos +Cl g MoCl g 1 2 ( ) 2 ( ) 1 2 4 ( ) −150.68 (8) 12Si( )s +Cl2 ( )g 1SiCl g 2 4 ( ) −276.25 (9) TiCl4 ( )g +O2 ( )g TiO2 ( )s+2Cl2 ( )g −129.86 (10) 4AlCl g +O g Al O s +2Cl g 3 3 ( ) 2 ( ) 2 3 2 3 ( ) 2 ( ) −219.01 (11) ZrCl4 ( )g +O2 ( )g ZrO2 ( )s +2Cl2 ( )g −164.59 (12) SnCl2 ( )g +O2 ( )g SnO2 ( )s +Cl2 ( )g −187.19 (13) SnCl4 ( )g +O2 ( )g SnO2 ( )s +2Cl2 ( )g −25.63 (14) MoCl g +O g MoO s + Cl g 2 3 4 ( ) 2 ( ) 2 3 3 ( ) 4 3 2 ( ) −155.21 (15) SiCl4 ( )g +O2 ( )g SiO2 ( )s+2Cl2 ( )g −201.30
Author statement
Clément Ciszak: Conceptualization, Methodology, Validation, Investigation, Data Curation, Writing – Original Draft, Writing – Review and Editing, Visualization Iman Abdallah: Validation, Investigation, Data Curation, Writing – Original Draft, Visualization Ioana Popa: Conceptualization, Methodology, Validation, Resources, Writing – Review and Editing, Supervision, Project administration, Funding ac-quisition Jean-Michel Brossard: Conceptualization, Methodology, Validation, Formal analysis, Writing – Review and Editing Aurélie Vande Put: Resources, Writing – Review and Editing, Supervision, Funding acquisition Daniel Monceau: Resources, Writing – Review and Editing, Supervision, Project administration Sébastien Chevalier: Resources, Writing – Review and Editing, Supervision, Project admin-istration, Funding acquisition
Declaration of Competing Interest
The authors declare that they have no known competing financial interests or personal relationships that could have appeared to influ-ence the work reported in this paper.
Fig. 18.Overlay of the theoretical
pre-dominance diagrams of the Ti, Al, Sn, Zr, Mo and Si elements established for pure con-stituents at 833 K for 1 atm pressure using FactSage 6.4 from thermodynamic database FactPS / Elem / FT Oxid. Intermediate tita-nium oxides between Ti3O5and TiO2are
de-liberately not shown for clarity purposes.
Fig. 19.Diagram of the reaction scheme proposed for the stratification of the
external oxide scale formed on sample NA.
Fig. 20.Schematic representation of formation of the internal oxidation area. (a) Initial state of the metallic matrix. (b) Preferential oxidation of grain boundaries. (c) Growth of oxide laths in the α-grains and formation of crack leading to partially oxidised grains. (d) Growth of the oxide laths leading to the conversion of partially oxidised α-grains into fully oxidised ones and extension to un-oxidised α-grains.
Appendix A. Supplementary data
Supplementary material related to this article can be found, in the online version, at doi:https://doi.org/10.1016/j.corsci.2020.108611.
References
[1] H.J. Grabke, E. Reese, M. Spiegel, The effects of chlorides, hydrogen chloride, and sulfur dioxide in the oxidation of steels below deposits, Corros. Sci. 37 (1995) 1023–1043,https://doi.org/10.1016/0010-938X(95)00011-8.
[2] Y. Kawahara, High temperature corrosion mechanisms and effect of alloying ele-ments for materials used in waste incineration environment, Corros. Sci. 44 (2002) 223–245,https://doi.org/10.1016/S0010-938X(01)00058-0.
[3] Titanium | Gerd Lütjering | Springer, n.d. //www.springer.com/la/book/ 9783540713982 (accessed January 24, 2018).
[4] B. Champin, L. Graff, M. Armand, G. Béranger, C. Coddet, Oxydation des alliages de titane au voisinage des températures d’utilisation dans les turbomoteurs, J. Common Met. 69 (1980) 163–183,https://doi.org/10.1016/0022-5088(80) 90052-1.
[5] I. Gurrappa, Mechanism of degradation of titanium alloy IMI 834 and its protection under hot corrosion conditions, Oxid. Met. 59 (2003) 321–322,https://doi.org/10. 1023/A:1023044111767.
[6] R. Siab, G. Bonnet, J.M. Brossard, J. Balmain, J.-F. Dinhut, Effect of an electro-deposited yttrium containing thin film on the high-temperature oxidation beha-viour of TA6V alloy, Appl. Surf. Sci. 253 (2007) 3425–3431,https://doi.org/10. 1016/j.apsusc.2006.07.057.
[7] H.L. Du, P.K. Datta, D.B. Lewis, J.S. Burnell-Gray, High-temperature corrosion of Ti and Ti-6Al-4V alloy, Oxid. Met. 45 (1996) 507–527,https://doi.org/10.1007/ BF01046849.
[8] H. Guleryuz, H. Cimenoglu, Oxidation of Ti–6Al–4V alloy, J. Alloys. Compd. 472 (2009) 241–246,https://doi.org/10.1016/j.jallcom.2008.04.024.
[9] H.L. Du, P.K. Datta, D.B. Lewis, J.S. Burnell-Gray, Air oxidation behaviour of Ti-6Al-4V alloy between 650 and 850 °C, Corros. Sci. 36 (1994) 631–642,https://doi.org/ 10.1016/0010-938X(94)90069-8.
[10] C. Ciszak, I. Popa, J.-M. Brossard, D. Monceau, S. Chevalier, NaCl induced corrosion of Ti-6Al-4V alloy at high temperature, Corros. Sci. 110 (2016) 91–104,https://doi. org/10.1016/j.corsci.2016.04.016.
[11] C. Dupressoire, A. Rouaix- Vande Put, P. Emile, C. Archambeau-Mirguet, R. Peraldi, D. Monceau, Effect of nitrogen on the kinetics of oxide scale growth and of oxygen dissolution in the Ti6242S titanium-based alloy, Oxid. Met. 87 (2017) 343–353, https://doi.org/10.1007/s11085-017-9729-1.
[12] A. Casadebaigt, J. Hugues, D. Monceau, Influence of microstructure and surface roughness on oxidation kinetics at 500–600 °C of Ti–6Al–4V alloy fabricated by additive manufacturing, Oxid. Met. 90 (2018) 633–648,https://doi.org/10.1007/ s11085-018-9859-0.
[13] H. Guleryuz, H. Cimenoglu, Surface modification of a Ti–6Al–4V alloy by thermal oxidation, Surf. Coat. Technol. 192 (2005) 164–170,https://doi.org/10.1016/j. surfcoat.2004.05.018.
[14] D. Poquillon, C. Armand, J. Huez, Oxidation and Oxygen Diffusion in Ti–6al–4V Alloy: Improving Measurements During Sims Analysis by Rotating the Sample, Oxid. Met. 79 (2013) 249–259,https://doi.org/10.1007/s11085-013-9360-8. [15] K.S. McReynolds, S. Tamirisakandala, A study on alpha-case depth in
Ti-6Al-2Sn-4Zr-2Mo, Metall. Mater. Trans. A. 42 (2011) 1732–1736,https://doi.org/10.1007/ s11661-011-0710-3.
[16] R. Gaddam, B. Sefer, R. Pederson, M.-L. Antti, Oxidation and alpha-case formation in Ti–6Al–2Sn–4Zr–2Mo alloy, Mater. Charact. 99 (2015) 166–174,https://doi.org/ 10.1016/j.matchar.2014.11.023.
[17] M. Berthaud, I. Popa, R. Chassagnon, O. Heintz, J. Lavková, S. Chevalier, Study of titanium alloy Ti6242S oxidation behaviour in air at 560 °C: effect of oxygen dis-solution on lattice parameters, Corros. Sci. (2019),https://doi.org/10.1016/j. corsci.2019.06.004108049.
[18] N. Vaché, D. Monceau, Oxygen diffusion modeling in titanium alloys: new elements on the analysis of microhardness profiles, Oxid. Met. (2020),https://doi.org/10. 1007/s11085-020-09956-9.
[19] L. Fan, L. Liu, Z. Yu, M. Cao, Y. Li, F. Wang, Corrosion behavior of Ti60 alloy under
under a solid NaCl deposit in a wet oxygen flow at 600 °C, Metals. 6 (2016) 72, https://doi.org/10.3390/met6040072.
[25] C. Ciszak, I. Popa, J.-M. Brossard, D. Monceau, S. Chevalier, NaCl-induced high-temperature corrosion of β21S Ti alloy, Oxid. Met. 87 (2017) 729–740,https://doi. org/10.1007/s11085-017-9775-8.
[26] M. Zhang, L. Xin, X. Ding, S. Zhu, F. Wang, Effects Ti/TiAlN composite multilayer coatings on corrosion resistance of titanium alloy in solid NaCl-H2O-O2at 600 °C, J.
Alloys. Compd. 734 (2018) 307–317,https://doi.org/10.1016/j.jallcom.2017.11. 035.
[27] Z. Yao, M. Marek, NaCl-induced hot corrosion of a titanium aluminide alloy, Mater. Sci. Eng. A. 192–193 (1995) 994–1000,https://doi.org/10.1016/0921-5093(95) 03345-9.
[28] S. Joseph, T.C. Lindley, D. Dye, E.A. Saunders, The mechanisms of hot salt stress corrosion cracking in titanium alloy Ti-6Al-2Sn-4Zr-6Mo, Corros. Sci. 134 (2018) 169–178,https://doi.org/10.1016/j.corsci.2018.02.025.
[29] D. Zheng, S. Zhu, F. Wang, The influence of TiAlN and enamel coatings on the corrosion behavior of Ti6Al4V alloy in the presence of solid NaCl deposit and water vapor at 450 °C, Surf. Coat. Technol. 201 (2007) 5859–5864,https://doi.org/10. 1016/j.surfcoat.2006.10.038.
[30] Y. Xiong, S. Zhu, F. Wang, Synergistic corrosion behavior of coated Ti60 alloys with NaCl deposit in moist air at elevated temperature, Corros. Sci. 50 (2008) 15–22, https://doi.org/10.1016/j.corsci.2007.06.007.
[31] M. Anuwar, R. Jayaganthan, V.K. Tewari, N. Arivazhagan, A study on the hot corrosion behavior of Ti–6Al–4V alloy, Mater. Lett. 61 (2007) 1483–1488,https:// doi.org/10.1016/j.matlet.2006.07.058.
[32] J.-D. Béguin, D. Adrian, J.-A. Petit, J.-P. Rivière, C. Vahlas, S. Vaillant, Improvement of Salt Corrosion Resistance of Titanium Alloys by PVD and CVD Coatings, in: Vienna, Austria, (2007), pp. 59–63 (accessed March 3, 2015),http:// www.asminternational.org/content/ASM/StoreFiles/05216G_frontmatter.pdf. [33] J. Baillieux, D. Poquillon, B. Malard, Relationship between the volume of the unit
cell of hexagonal-close-packed Ti, hardness and oxygen content after α-case for-mation in Ti–6Al–2Sn–4Zr–2Mo–0.1Si alloy, J. Appl. Crystallogr. 49 (2016) 175–181,https://doi.org/10.1107/S1600576715022906.
[34] R.F. Egerton, Electron Energy-Loss Spectroscopy in the Electron Microscope, Springer US, Boston, MA, 2011,https://doi.org/10.1007/978-1-4419-9583-4. [35] R.D. Leapman, L.A. Grunes, P.L. Fejes, Study of the L2,3edges in the 3d transition
metals and their oxides by electron-energy-loss spectroscopy with comparisons to theory, Phys. Rev. B 26 (1982) 614–635,https://doi.org/10.1103/PhysRevB.26. 614.
[36] S. Terada, K. Asayama, M. Tsujimoto, H. Kurata, S. Isoda, Chemical shift of Electron energy-Loss near-edge structure on the nitrogen K-Edge and titanium L3-Edge at
TiN/Ti interface, Microsc. Microanal. 15 (2009) 106–113,https://doi.org/10. 1017/S1431927609090175.
[37] I. Abdallah, C. Dupressoire, L. Laffont, D. Monceau, A. Vande Put, STEM-EELS identification of TiOXNY, TiN, Ti2N and O, N dissolution in the Ti2642S alloy
oxi-dized in synthetic air at 650 °C, Corros. Sci. 153 (2019) 191–199,https://doi.org/ 10.1016/j.corsci.2019.03.037.
[38] R. Brydson, B.G. Williams, W. Engel, H. Sauer, E. Zeitler, J.M. Thomas, Electron energy-loss spectroscopy (EELS) and the electronic structure of titanium dioxide, Solid State Commun. 64 (1987) 609–612,https://doi.org/10.1016/0038-1098(87) 90792-7.
[39] F. Hofer, P. Warbichler, A. Scott, R. Brydson, I. Galesic, B. Kolbesen, Electron en-ergy loss near edge structure on the nitrogen K-edge in vanadium nitrides, J. Microsc. 204 (2002) 166–171,https://doi.org/10.1046/j.1365-2818.2001. 00946.x.
[40] P.L. Potapov, D. Schryvers, Measuring the absolute position of EELS ionisation edges in a TEM, Ultramicroscopy. 99 (2004) 73–85,https://doi.org/10.1016/ S0304-3991(03)00185-2.
[41] A. Gloter, C. Ewels, P. Umek, D. Arcon, C. Colliex, Electronic structure of titania-based nanotubes investigated by EELS spectroscopy, Phys. Rev. B 80 (2009) 035413, ,https://doi.org/10.1103/PhysRevB.80.035413.
[42] E. Stoyanov, F. Langenhorst, G. Steinle-Neumann, The effect of valence state and site geometry on Ti L3,2and O-K electron energy-loss spectra of TixOyphases, Am.
Mineral. 92 (2007) 577–586,https://doi.org/10.2138/am.2007.2344.
[43] P.E.T. Ngnekou, M.-C. Lafont, F. Senocq, L. Laffont, B. Viguier, J. Lacaze, Structural characterization of the scale formed on a Ti–46Al–8Nb alloy oxidised in air at 700 °C, Intermetallics. 18 (2010) 226–232,https://doi.org/10.1016/j.intermet.2009.
07.013.
[44] B.H. Zimm, J.E. Mayer, Vapor Pressures, Heats of Vaporization, and Entropies of Some Alkali Halides, J. Chem. Phys. 12 (1944) 362–369,https://doi.org/10.1063/ 1.1723958.
[45] C.T. Ewing, K.H. Stern, Equilibrium vaporization rates and vapor pressures of solid and liquid sodium chloride, potassium chloride, potassium bromide, cesium iodide, and lithium fluoride, J. Phys. Chem. 78 (1974) 1998–2005,https://doi.org/10.
1021/j100613a005.
[46] A.L. da Silva, D. Hotza, R.H.R. Castro, Surface energy effects on the stability of anatase and rutile nanocrystals: a predictive diagram for Nb2O5-doped-TiO2, Appl.
Surf. Sci. 393 (2017) 103–109,https://doi.org/10.1016/j.apsusc.2016.09.126. [47] T. Furuhara, S. Takagi, H. Watanabe, T. Maki, Crystallography of grain boundary α
precipitates in a β titanium alloy, Metall. Mater. Trans. A. 27 (1996) 1635–1646, https://doi.org/10.1007/BF02649821.