an author's
https://oatao.univ-toulouse.fr/26732
https://doi.org/10.1016/j.compscitech.2020.108194
Trellu, Antoine and Pichon, guillaume and Bouvet, Christophe and Rivallant, Samuel and Castanié, Bruno and Serra,
Joël and Ratsifandrihana, Léon Combined loadings after medium velocity impact on large CFRP laminate plates:
Tests and enhanced computation/testing dialogue. (2020) Composites Science and Technology. ISSN 0266-3538
Combined loadings after medium velocity impact on large CFRP laminate
plates: Tests and enhanced computation/testing dialogue
A. Trellu
a,b, G. Pichon
b, C. Bouvet
a,*, S. Rivallant
a, B. Castani�e
a, J. Serra
a, L. Ratsifandrihana
baUniversit�e de Toulouse, Institut Cl�ement Ader, ISAE-SUPAERO – UPS – IMT Mines Albi – INSA. 10 av. E. Belin, 31055, Toulouse, France bSEGULA Aerospace and Defence, 24 bd. D�eodat de Severac, 31770, Colomiers, France
Keywords: A-laminates B- impact behavior C-Damage tolerance
A B S T R A C T
The development and certification of aeronautical composite structures is still largely based on the pyramid of tests. This approach is extremely costly in terms of number of tests, especially at the level of coupons. Moreover, these tests are highly conservative, under uniaxial loading, and do not represent the actual behavior at structure scale. To overcome these drawbacks, a new methodology has been developed at the Institut Cl�ement Ader, which uses a complex loading test rig for technological specimens. This research focuses on the combined loading after impact of CFRP plates and highlights a specific behavior quite different from the usual CAI (Compression After Impact) response at the scale of coupons. In particular, compression, shear and combined shear/compression loadings were applied to large Carbon Fiber Reinforced Plastics (CFRP) laminated plates and the interaction of the impact damage with the post-buckling behavior has been investigated.
1. Introduction
Because of their high strength-to-weight ratio, composite materials are now widely used in aeronautical structures. In fact, their mass per-centages for the recent Boeing 787 and Airbus A350 XWB exceed 50%. Since the first composite primary structure certified on a civil aircraft - the ATR 72 wing box [1] - sizing and damage tolerance methods have been developed and improved. As for metal aeronautical structures, all these design methods must be validated by the pyramid of tests [2]. At the base of the pyramid are conventional tests on coupon specimens then, at upper levels, come structural tests that are more representative of technological details and designs. CFRP composite structures are vulnerable to low velocity/low energy impacts. This leads to a damage tolerance policy of sizing which, in turn, leads to overweight. These low velocity/low energy impacts, e.g. due to unexpected dropping of tools [3], can appear during aircraft ground operations or manufacturing. Even if the damage is not visible, the residual strength of the structure can fall by 40%–50% [1–4]. The most critical consequence of the different loads acting on an actual aeronautic structure is compression after impact, and tests on small specimens (100 � 150 mm2) are used for
the certification and sizing of aeronautic composite structures. From past experience, it appears that the allowables provided by this method are very conservative [5–12]. Thus, in order to significantly decrease the
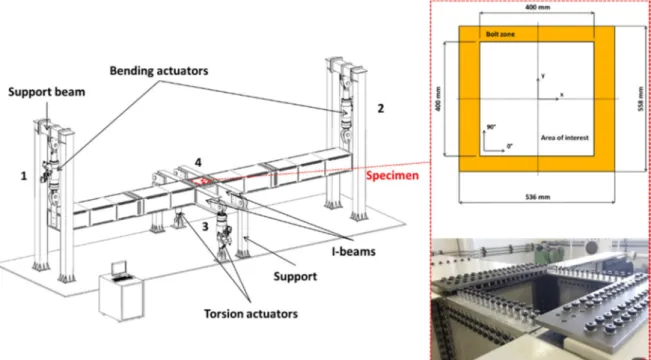
huge number of tests and to gain a better understanding of the behavior of actual composite structures, industrials and academic researchers are looking to a virtual testing approach [13,14], which implies reducing the number of tests at coupon scale and developing more representative testing methods. For this purpose, the French National Research Agency funded the “VERTEX” program [15–18]. VERTEX is the French acronym for “Experimental modeling and validation of composite structures under complex loading”. Only a few test rigs in the world allow struc-tural specimens to be tested under multiaxial loading. Some authors have reviewed the state of the art concerning this kind of multiaxial test rigs [16,18], which is recalled here. Two families of machines are described. The first one deals with experimental tests where actuators directly reproduce the compression/shear loads on a specimen with an area of one square meter (Fig. 1) [19–22]. These test rigs look techni-cally complex, with the use of many actuators to produce com-pression/shear loading. The second one uses rectangular boxes and actuators to cause complex loading on the specimen, which is part of the rig. In 1984, Peters [23] obtained an experimental curve of com-pression/shear buckling with a square section box subjected to torsion and bending. Klein [24] used a box structure embedded at one end and loaded by two actuators at the other end. Very recently, Zucco et al. [25] designed and manufactured a testing fixture capable to introduce pre-scribed shear force and bending moment at one end of a variable
* Corresponding author.
thermoplastic composite wingbox and react the load at the other end (Fig. 1, Type 5). This test rig is self-equilibrated and, in this way, it does not need any joints with the ground (foundations).
The experimental test rig used in this work is called “VERTEX test rig”. It was developed by Castani�e and first used by Serra and his co- authors [15–18] at the Institut Clement Ader (Fig. 2). The VERTEX test rig is based on the experience of a first, similar test rig developed by Castani�e et al. [26,27] and used to test asymmetric sandwich structures implemented in helicopter fuselages. The test rig is made with one longitudinal box and four actuators to load the specimen, which is bolted onto the upper face of the central part of the box, under mem-brane (shear and compression/tension) loading or internal pressure. Specimen dimensions (558 � 536 mm2) for the VERTEX machine are larger than those (248 � 306 mm2) used initially by Castani�e et al. [26,
27] as the co-authors underlined that it was very difficult to estimate the stress flows directly entering the specimen because of structural re-dundancies. Moreover, the use of small specimens induced Saint-Venant effects and perturbed the strain field. More recently, despite the use of advanced measurement techniques (Digital Image Correlation) [17,18,
28,29], Serra et al. have encountered several problems of test-computation dialogue during their work and this point has to be solved before the advanced damage modeling strategies developed by the authors [30–33] can be employed.
This work thus has a dual aim. First, VERTEX specimens are impacted at medium velocity and analyzed with C-Scan. Then they are tested under compression, shear or combined loading. The tests are followed by DIC and a fast thermal camera. Because of the complexity and the structural redundancies of the test rig, the second part of this paper covers the validation of an enhanced method to transfer boundary conditions from DIC to an implicit nonlinear elastic FE model. The final part draws conclusions from this work and puts forward some perspectives.
2. Experimental study
the laminate plate was [45�2/-45�2/0�2/90�2]s, giving a total thickness
of 3.5 mm. This composite laminate was quasi-isotropic and was similar to panels used in aeronautical composite structures. As introduced in Section 1, the VERTEX specimen was a large plate of dimensions 558 � 536 � 3.5 mm3. Eight specimens were manufactured, seven of them
were impacted (specimens A to G) and one was kept non-impacted (specimen H). After impact, all these specimens underwent a different loading in the VERTEX test rig.
2.1. Impact tests 2.1.1. Test set up
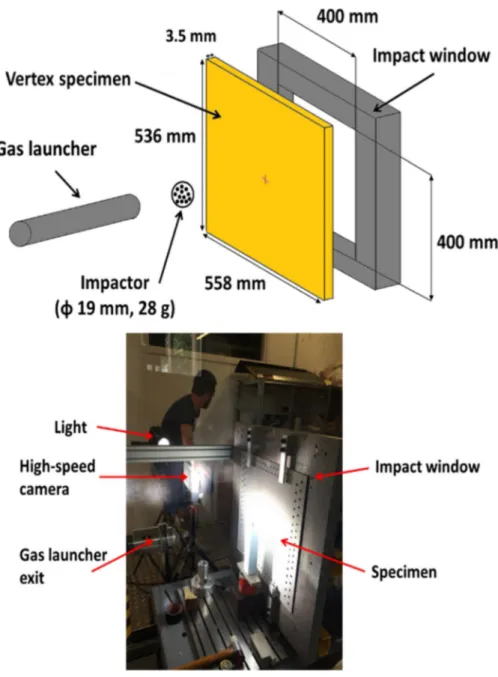
Each specimen (A to G) was impacted at a different medium velocity from 54 m/s to 110 m/s. This velocity range was chosen to create different sizes of damage. It could represent a small debris impact during aircraft take-off or landing. These impact damages must be important enough to interact with the loading after impact. Impact tests were performed with the LG40 gas launcher of the impact platform STIM-PACT [34] located at Institut Clement Ader. The specimen was simply supported by a 400 � 400 mm2 impact window and impacted with a 19
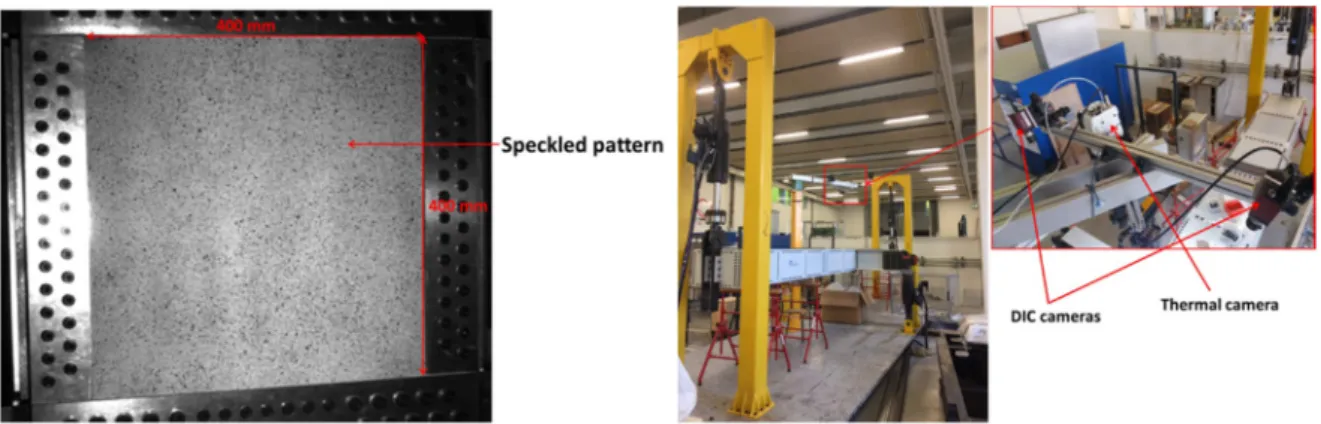
mm-diameter spherical steel impactor of 28 g (Fig. 3). A high-speed camera was positioned perpendicularly to the impactor’s trajectory and a speckled pattern was made on the impactor. Thanks to this set up and the program developed by J. C. Passieux et al. [35], the contact force during the impact was measured. The program tracked the projectile from the gun exit to the specimen. The image sequence recorded with the high speed camera was analyzed by evaluating the displacement of speckled pattern points in a circular zone of interest between two consecutive images. The displacement field was processed to give the impactor velocity, acceleration and then forces.
2.1.2. Results
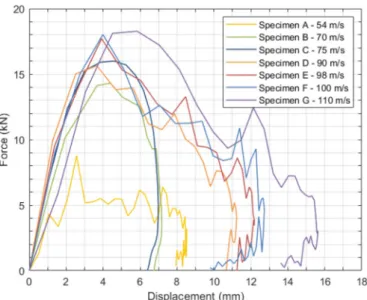
Curves of impact force versus impactor displacement are plotted in
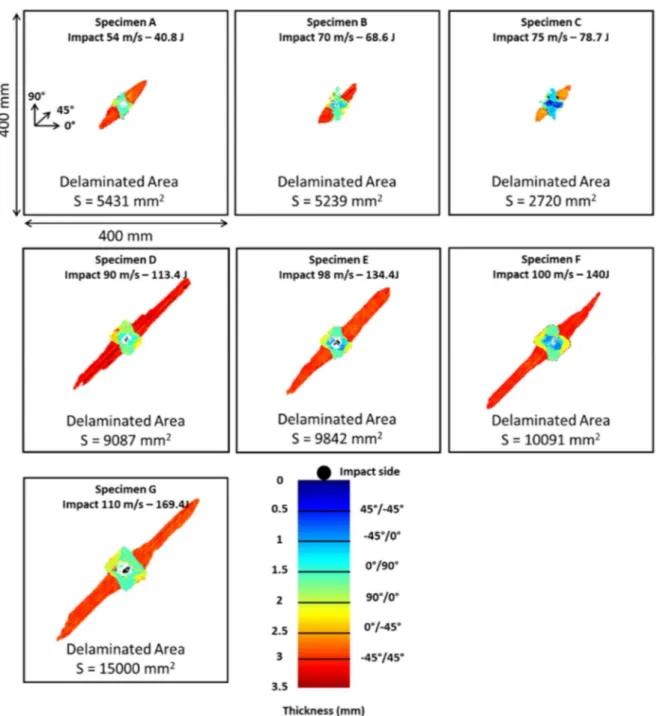
impact mark. For specimen A, the impact damage was barely visible and then, when the impact speed increases, fiber failures were more present in the laminate thickness. The impactor maximum displacement for specimen A should be smaller than for specimens B and C but, for this impact case, the speckled pattern of the impactor was damaged at the gas-gun exit. The poor quality speckled pattern allowed the impact ve-locity and force to be evaluated but, after the contact with the specimen, the impactor was not well tracked with the camera. Then, an ultrasonic investigation was carried out on impacted specimens to evaluate the delaminated area. The C-scan of each specimen is reported in Fig. 5. The main delamination propagation appears on the 45�/45�interface on
the non-impacted side and this propagation increases with the impact velocity. It can be noted that a threshold effect occurs between the impact at 75 m/s and the impact at 90 m/s with an important difference on the delaminated area. It is also noticeable that the pattern is quite different than on a normalized test with the same stacking sequence [33], with a great extension of the delamination area at 45�at the lower
interface. This was probably due to the size of the specimen, which was submitted to more overall bending that may have promoted the opening in modes I and II of this interface. A summary of impact results is given in Table 1 with impact velocities, impact energies and delaminated area for each specimen.
2.2. VERTEX tests 2.2.1. Test set up
The VERTEX specimen was bolted to the upper surface of the center box structure with 128 fasteners (Fig. 2). Once bolted to the test rig, the specimen area of interest was 400*400 mm2 (Fig. 8). The test rig was
monitored with 4 actuators driven in displacement (Fig. 2). When ac-tuators 1 and 2 applied a vertical load, the structure was subjected to bending and the specimen forming the upper surface of the center box was loaded in pure compression or pure tension. When only actuators 3 and 4 were activated, the structure was theoretically subjected to tor-sion. However, due to the size of the box and a solid displacement, a reacting force appeared in bending actuators 1 and 2 and the specimen was loaded in shear/tension. In order to load the specimen in pure shear, undesired forces occurring in bending actuators 1 and 2 were balanced
by activating their displacements slightly. When actuators 1, 2, 3 and 4 were activated simultaneously, a compression/shear loading was introduced into the specimen. It should be noted that the position of actuators 3 and 4 led to negative shear loading. As underlined by Serra et al. [16–18], a difficulty of this testing method is to be sure of the value of the stresses entering the specimen during the test. Because of numerous structural redundancies of the test rig, there is no transfer function to link actuator forces and stress flows directly entering in the specimen. Thus, to measure specimen strains, an in-situ method had to be used. Digital Image Correlation (DIC) is the most suitable method and has already been used on previous VERTEX tests [17,18]. To achieve this DIC, a speckled pattern was made on the whole specimen (Fig. 6) and two 5 Mpx cameras recorded images from the whole specimen. The acquisition frequency was set to one image per second. Then, when users heard first acoustic emissions associated to different failures, it was changed to ten images per second to increase the precision of the mea-sures around the final failure. Then the VIC3D software was used to compute the displacement fields. In this study, a thermal camera (M3K – Telops) was added on to the VERTEX test rig in an attempt to observe the location of the final failure initiation. The thermal camera acquisition frequency ranged from 10 Hz to 4000 Hz and was set to 2769 Hz on a trigger mode to try to capture the failure origin. The thermal camera and the pair of 5 Mpx cameras were mounted on a jib above the specimen (Fig. 6).
Two of the most damaged specimen (based on the delaminated area), specimen E and G were loaded in pure compression because it is the most critical loading. Specimen C, F and H were loaded in shear/tension with the same loading path in order to evaluate the influence of the impact energy. Finally specimen A and D were loaded in compression/ shear and specimen B in pure shear. A summary of different loading paths according to the delaminated area is given in Table 1.
2.2.2. DIC measurement and enhanced computation of the experimental loading
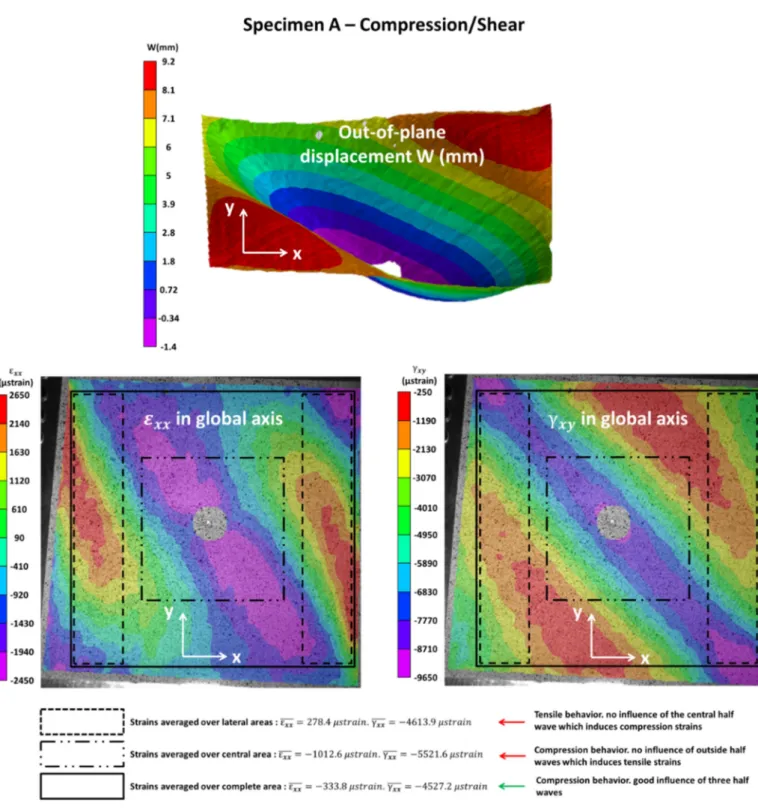
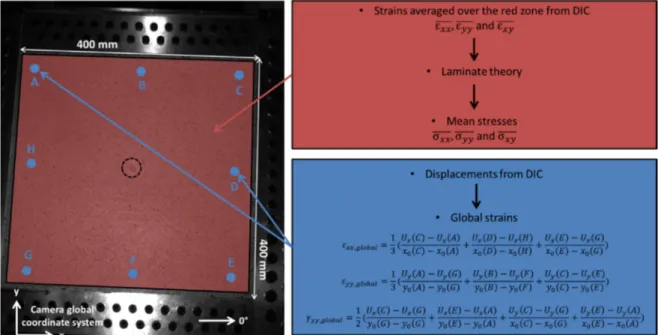
Displacement fields obtained with image correlation were used to determine stress/strain curves for each specimen. The first idea was to recover curvatures from DIC to remove the effect of bending and get membrane strains and stresses. It was not possible in this study because of the poor quality of curvature fields calculated with the software VIC- 3D. To overcome this issue and in order to observe the global behavior of the specimen and not to take postbuckling local effects into account, mean stresses and global strains were used. Mean stresses were calcu-lated with the Classical Laminate Theory (CLT, from the Kirchhoff plate theory) from strains obtained with VIC-3D and averaged over the specimen (red area in Fig. 8). It was important to select an efficient area to average strains. Fig. 7 represents the study performed on specimen A (loaded in compression/shear) to compare the different areas used for strain averaging: the lateral areas (black dashed lines), used before by Serra [16,17], the whole area (black lines) and the center area (black dash-dot-dot lines), see Fig. 7. When the out-of-plane deformation is in the direction of the positive z-axis, tensile strains occur in the surface of the specimen, when half waves are oriented along the negative z-axis, compression strains occur in the surface of the specimen. This was verified with strain fields εxx and γxy measured with DIC. Compression strains were mostly located in the central negative half wave while tensile strains were mostly located in the bottom left corner and the top right corner. The use of the two lateral areas (black dashed lines) to average strains showed a tensile behavior because the central half waves were not taken into consideration, while the use of the central area (black dash-dot-dot lines) seemed to overestimate the compression
behavior because the two external half waves were not considered. When the average was taken over the complete area (black lines) a compression behavior was observed even though the influence of each half wave was taken into account. Nevertheless, the shear behavior was not really impacted by the selected area. Finally, the choice was made to use the complete area minus the impact zone where the speckled pattern is damaged in order to evaluate the mean strain and then to obtain the mean stress. Afterwards, global strains were calculated by dividing displacements measured at extreme points (in blue, Fig. 8) by the dis-tance separating them. Fig. 8 summarizes the method used to obtain mean stresses and global strains. In order to validate this method, mean stress/global strain curves are plotted in compression and shear behavior in Fig. 14 for the three different averaged areas and are compared to the theoretical stiffness of the specimen calculated with laminate theory. Stress/strain curves and, in particular, the stiffness obtained using CLT, allowed the method to be validated by using the complete area to evaluate the average strains (see Fig. 9).
Fig. 5. Delamination areas obtained by C-Scan after impact. Table 1
Overview of impact results and different loading paths.
Specimen Velocity
(m/s) Impact Energy (J) Delaminated Area (mm2) Loading after Impact
A 54 40.8 5431 Compression/ shear B 70 68.6 5239 Shear C 75 78.7 2720 Shear/tension D 90 113.4 9087 Compression/ shear E 98 134.4 9842 Compression F 100 140 10091 Shear/tension G 110 169.4 15000 Compression H 0 0 0 Shear/tension
2.2.3. Results
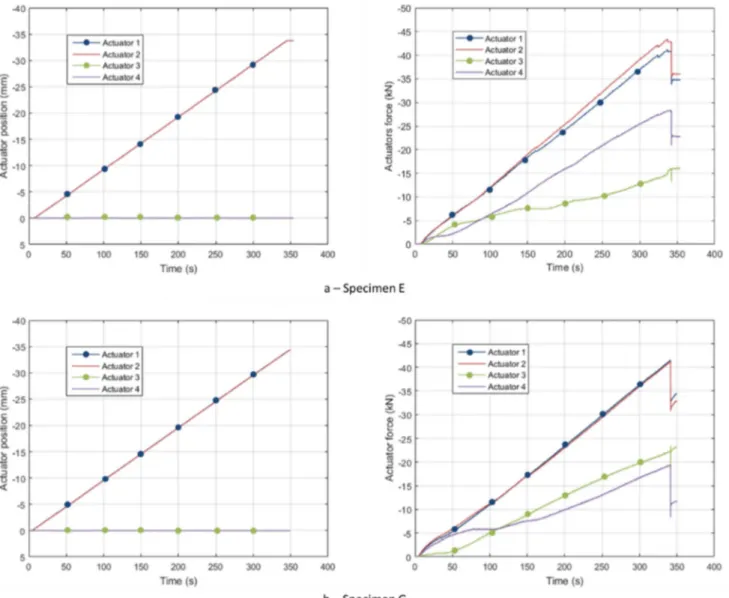
�Compression tests (E and G)
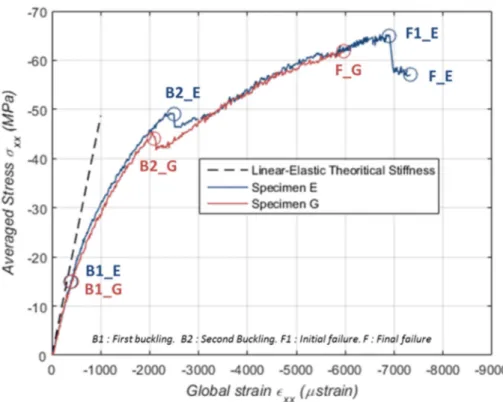
Specimens E and G, respectively impacted at 98 m/s and 110 m/s, were subjected to compression loading by activating bending actuators 1 and 2 and imposing a zero displacement in torsion actuators 3 and 4 as shown in Fig. 10 for example. A dissymmetry was observed between torsion actuators and has not yet been explained.
Stress/strain curves obtained in compression loading using the method presented in the previous section are shown in Fig. 11. Before the loss of linearity occurring around 15 MPa, curves follow the theo-retical compression stiffness of 43 GPa, validating the strain/stress evaluation method. Fig. 12 shows the out-of-plane W-displacement for various phenomena on specimen G. The first nonlinearity is due to the buckling with only one buckle across the plate (see Fig. 11, point B1).
The second buckling mode appears for 45–50 MPa and moves the half wave (Fig. 12 – a) into two half waves (Fig. 12 – b). It involves a small stress decrease but does not dissipate enough energy to cause the final failure. The final failure is reached at 61 MPa for specimen G and the first significant failure of specimen E takes place at 65 MPa. The loading paths of the two specimens (Fig. 11) are quite similar even though different phenomena (mode jump and final failure) occur earlier for specimen G. These gaps are explained by the difference of damage induced by impact: the delaminated area of specimen G (15000 mm2) is greater than that of specimen E (9842 mm2). The final failure is located
on the right corners of the specimen (Fig. 12 – c). The impact damage appears to have an effect on the residual compression stress and phe-nomena occurrence but does not influence the final failure location. Failures seem to come from the bolted zone because buckling modes are stabilized by the test rig. These observations are in opposite with classic compression after impact tests, where specimen size and boundary conditions force the final failure occurrence at the impact damage. It could be interesting in further tests to use local reinforcements in the bolted area to get a higher loading and change the failure scenario. Indeed in this study the failure strain obtained is lower than the CAI strength of the structure.
�Shear test (B)
Specimen B impacted at 70 m/s was loaded in shear by activating
actuators 1, 2, 3 and 4 Normally, as explained in Section 2.2.1, in a pure shear test, only torsion actuators 3 and 4 should be activated but, due to probable overall solid displacement of the box, bending actuators 1 and 2 need to be controlled. The displacement imposed in bending actuators 1 and 2 was twice the displacement imposed in torsion actuators 3 and 4. The forces involved were close to zero in bending actuators and almost equal in torsion actuators. The small difference observed for the pure compression loading between actuators 3 and 4 was still present for this test. The stress/strain curve corresponding to this test is plotted in
Fig. 13. Before buckling, the stiffness was similar to the theoretical shear stiffness of 19 GPa, thus validating the strain/stress evaluation method. The buckling mode induced three half waves (Fig. 14) oriented at 45�, which proves that the loading applied by the Vertex machine is
consistent. Unlike for compression tests, there was no mode jump here; the first buckling mode evolved until final failure. The stress/strain curve showed two initial failures (F1_B and F2_B in Fig. 13) before the final failure. The first failure occurred at 81 MPa and was initiated at the impact point (Fig. 14 – b). The second failure occurred at 87 MPa and was also initiated at the impact point (Fig. 14 – b).These fiber failures were perpendicular to the direction of the compression stress since a panel loaded in pure shear works in tension and compression on its principal directions (Fig. 14 – b). The first one was oriented from the top left corner to the bottom right corner of the specimen and the second from the bottom left corner to the top right corner. The final failure brutally propagated the first failure in the bottom right corner at 80 MPa (Fig. 14 – c). The thermal camera allowed the two first failures initiated at the impact point to be observed (Fig. 14 – d). In this case, it is possible to conclude on the interaction between postbuckling and impact damage in the failure initiation and propagation. It is important to note that the poor quality of the speckled pattern for this specimen did not allow good image correlation. The white paint layer was too thick and involved areas that were very reflective and where displacements were not calculable (Fig. 14). This issue could add some uncertainty on the stress/ strain curve even though the good correlation of the stiffness before buckling is comforting.
� Compression/Shear tests (A and D)
Specimens A and D were loaded in compression/shear by activating actuators 1, 2, 3 and 4. The displacement imposed in bending actuators 1 and 2 was the same displacement as imposed for specimen A and twice
Fig. 7. Influence of buckling waves to select the area of averaged strains for specimen A loaded in compression/shear*
Strain fields are represented on the real (distorted) picture from one of the two DIC cameras, but calculations are done in the coordinate axes of the straightened pictures. To simplify the drawing, the rectangular areas of averaging are also represented in the straightened coordinate axes.
the displacement imposed in torsion actuators 3 and 4 for specimen D. The difference observed for the last cases between actuators 3 and 4 was still present for this test. Stress/strain curves for these specimens, rep-resented in Fig. 15, describe their behavior in compression and shear. The shear behavior of the both specimens looks quite similar. Until buckling occurred, the stiffness was consistent with the theoretical shear stiffness of 19 GPa. After buckling, the final failure of specimen A occurred for higher shear stress than in specimen D. In compression, the theoretical compression stiffness of 44 GPa was followed closely by both specimens. Then the compression stress of specimen D continued to increase until final failure, while the compression stress of specimen D decreased. These observations seem logical. In fact, specimen A was more loaded in shear than specimen D. As discussed for the pure shear
buckling, the compression stress of specimen A changes to reach a ten-sile behavior. For these compression/shear tests, the shape of the buckling is similar to that observed in a shear test with three half waves (Fig. 16 - a). The failure pattern is also the same, with fiber failure on the top 45�ply. Images given by the thermic camera seem to show that the
damage was initiated in the bottom right corner (Fig. 16 – c). However, in contrast to the compression test, the failure propagated through the impact point to reach the opposite corner (Fig. 16 – b and d).
� Tension/Shear tests (C, F and H)
The non-impacted specimen H, specimen C (impacted at 75 m/s) and specimen F (impacted at 100 m/s) were subjected to tensile/shear
Fig. 8. Method to determine average stresses and global strains.
and the specimen should be in pure shear loading. However, as pre-sented for the pure shear test, a test rig coupling led to a combined tensile/shear test with a significant percentage of tension. It is notice-able that this part of tension could be removed by manual, step by step piloting of the bending actuators in displacement (as done in Ref. [26] and for the pure shear test), or ideally by a force driven law set to zero. This last option was not chosen because of concerns about an unstable response of the test rig. In fact, the authors did not correct the tension because the tensile/shear test was very interesting; it was the only loading case where a non-impacted specimen was tested. This made it possible to compare residual stresses between the non-impacted and impacted specimens.
The stress/strain curves (Fig. 17) allowed the tensile behavior and the shear behavior to be analyzed. In tension and shear, the stiffnesses of specimens were similar to theoretical values until the buckling point was reached. The buckling point occurred later for the non-impacted spec-imen than for impacted specspec-imens. This shows the influence of the impact damage in postbuckling. The lower the impact damage, the higher the stress reached before final failure. In shear, the behavior was quite similar after buckling and before failure. In tension, the impact damage seemed to interfere considerably, with a significant stress decrease after buckling. The buckling shape was similar in shear and compression/shear tests, with three half waves (Fig. 18). The final failure was also due to fiber failures in the 45�ply, propagating along the
diagonal direction of the specimen. It is still difficult to conclude on the failure initiation but images recorded with the thermal camera suggest that the failure was initiated in the right corner (Fig. 18 – c). In the second image (Fig. 18 – d), the lower right corner looks less hot than the upper left corner.
�Synthesis
Analyzing each loading case individually was essential to determine
different impact energy levels [18]. As expected, the compression and compression/shear loading paths were the most critical for the structure and the tension and tension/shear loading paths tended to stabilize the damage propagation. For specimens impacted at different energy levels but loaded with the same loading path (specimens E and G, in pure compression, and specimen C, in tension/shear), the impact damage seemed to have almost no effect on the buckling occurrence but a sig-nificant effect on the final failure. For the non-impacted specimen H, loaded with the same loading path as specimens C and F, the buckling and the final failure appeared later.
3. Numerical work
Experimental tests led to a description of the specimen behavior from a structural point of view. Large impacted specimens under combined loading introduced a new approach to structure tests. Because it is not simple to obtain the stress flows directly entering in the specimen during the test, it is difficult to impose simple boundary conditions in a nu-merical model in order to simulate the VERTEX tests. This section shows how to transfer loading paths from DIC to a numerical model. Then a validation of the boundary conditions transfer process is presented with a simplified implicit model, which, at this stage, does not model the damage occurring in the specimens [18,30–33].
3.1. Process for transferring boundary conditions
For complex tests leading to out-of-plane displacements, like those carried out in this work, it is necessary to use data from DIC to apply a loading path in the numerical model. Ideally, to describe correctly the rotations undergone by the plate, displacement fields of the top and bottom surface of the specimen must be known.
The DIC system only allows images of the specimen to be obtained
case, they used shell elements.
In this study, displacement fields were measured by DIC during the test in zone 1 and boundary conditions were imposed on zone 2 edges (U, V and W - on the red line), only out-of-plane displacements (W on yellow lines) being imposed on the three following rows of nodes (Fig. 20). Previous trials showed that adding more than three rows did not change much the displacement simulated in the center of the plate [17]. Zone 2 was smaller than the observed zone 1 in order to reduce edge effects due to stereo-correlation measurement. The choice made in this study was to apply constant displacements in the specimen thickness and will be discussed later. To implement this method successfully, the mesh used in the model had to be the same as the one used to extract displacement fields with VIC-3D. Displacements corresponding to the nodes considered on the upper skin and the lower skin were added to the Abaqus input file by using amplitudes to represent their evolution dur-ing the test.
3.2. Implicit model
To test and validate this method, an elastic model with geometrical non-linearity to simulate the buckling was implemented in Abaqus Im-plicit. The aim was to validate the boundary conditions process before using it on a much more complex model capable of simulating the damage propagation: the “Discrete Ply Model” [18] (DPM). The spec-imen of 400 � 400 � 3.5 mm3 was meshed with thick continuum shell
elements (SC8R) of 5 � 5 � 3.5 mm3. Thick shell elements follow the
shell formulation but with a volume element topology (degrees of
freedom are the three displacements in each node of the mesh). Fig. 20
describes the mesh and model dimensions. The stacking sequence used for this study [452/-452/02/902/02/-452/452] was set in the shell
element. The elastic properties of the T700/M21 material are: El
(Young’s modulus in fiber direction) ¼ 110 GPa; Et (Transverse Young’s
modulus) ¼ 7.7 GPa, Glt (Shear Modulus) ¼ 5 GPa, νlt (poisson’s ratio) ¼
0.3. Boundary conditions were applied with displacement amplitudes
taken from DIC using the method explained in subsection 3.1 (Fig. 20) to implement the loading path. Displacements applied to the model nodes at each computation time are time-interpolated from the DIC-calculated displacements. The different tests carried out on the VERTEX test rig were simulated with this simplified model. In this non-damaged model, the impact phase is not represented but the loading path extracted from DIC indirectly takes the impact damage role into account in the spec-imen buckling during the loading test. Numerical results observed were compared to experimental results. The loading path plotted in a ðσxx; τxyÞgraph and the field of in-plane and out-of-plane displacements were used to compare buckle patterns. ðσxx;τxyÞcurves were obtained with the same method as for the experimental curves. Surface strains on the upper skin of the specimen were averaged over the whole plate. Then averaged stresses were obtained with the lamina theory (Fig. 8). Nu-merical results are shown in Fig. 21. The black lines represent experi-mental results and the colored lines show the finite element results. The correlation between numerical and experimental loading paths is very good. Behaviors are very similar until buckling occurs and the differ-ences that appear after buckling are probably due to the simplicity of the model, which does not consider composite damage such as fiber failure,
Fig. 15. Stress/strain curves for specimen A and D in compression/shear loading.
Fig. 16. Out-of-plane displacement for specimen A: a – first buckling mode, b – final failure, c – first failure and d – failure propagation (0.05 s after the first failure) observed with thermal camera.
Fig. 17. Stress/strain curves for specimen C, F and non-impacted specimen H in tension/shear loading.
Fig. 18. Out-of-plane displacement for specimen F: a – first buckling mode, b – final failure, c – first failure and d – failure propagation observed with ther-mal camera.
delamination or matrix cracking. Concerning buckling points, as for the experiments, start of buckling is determined from the first non-linearity on the out-of-plane versus in-plane displacement curve (not represented here). The comparison between experimental and numerical buckling points is also convincing. To complete this analysis, in-plane and out-of-plane displacements for each loading case (compression, com-pression/shear, shear and tensile/shear) are presented in Figures, 22, 23, 24 and 25. These figures show the good correlation between experimental and numerical displacement fields. Buckling modes are also well captured by the simplified model even for the mode jump from one half wave to two half waves in the compression case. It should be
noted that the decision to apply constant boundary conditions in the thickness of the composite leads to better results than boundary condi-tions only applied on the upper surface. This could be explained by the fact that, in specimen edges near the bolted zone, the specimen appears “stiffer”. This Saint-Venant effect seems to be well represented by a constant displacement field in the element thickness. Another justifica-tion can also be the necessity to fix properly the displacements (upper and lower) to properly set the shape of the plate. In other words, the shear stiffness being much lower in the through thickness direction then in the in-plane directions, applying displacement on the upper surface only is not enough to set the lower surface correctly. In order to confirm
this assumption, a Finite Element Stereo Digital Images Correlation (FE-SDIC) method, such as the one developed by Pierr�e et al. [28] at ICA, could be used.
4. Conclusion
In this paper, a study of interactions between impact damage and postbuckling in composite structures under complex loadings has been proposed. Unlike the conservative boundary conditions recommended by aeronautical standards for testing low velocity impact and compression after impact on composite coupons, this structural detail method offers the possibility of a closer approach to the behavior of real structures.
Composite specimens first impacted at medium velocity with a gas launcher are loaded in the VERTEX test rig in order to test different loading paths: compression, compression/shear, shear, and tension/ shear. Results show that the impact energy level has little influence before buckling.However, for the non-impacted specimen (H), the buckling occurs later than in specimens subjected to the same loading path. After buckling, a delay in the occurrence of various phenomena (mode jump in pure compression loading, initial and final failure) is observed on the most damaged plates. However, it seems that the final failure occurs from the impact point only in the pure shear test. In compression, the impact damage appears to have no effect on the final failure path occurring from the bolted zone on the bottom left corner of the specimen. In compression/shear and tensile/shear loading, thermal camera images seem to indicate that the final failure comes from the bottom left corner but is guided by the impact point to propagate along the diagonal of the specimen. In this study the VERTEX test rig was used for the first time to study impact damage effect. The choice was made to manufacture simple specimens. But this test rig was built to load tech-nological specimens with local reinforcements, stiffened panels of junctions. With this kind of technological specimens the impact damage should be more determinant in the final failure.
It would be very interesting to test more specimens in compression loading, in particular some non-impacted specimens in order to make a
real comparison of the effect of scale on compression after impact. Nevertheless, these preliminary results show that the response at the scale of the structure of an impacted plate is more complex than with coupon specimens. It also depends on the impact location and the al-lowables used to size aerospace composite structures may be too con-servative. As explained in this paper, the challenge in using such a test rig is to identify boundary conditions affecting the specimen. A simpli-fied model has validated a process for the transfer of boundary condi-tions from DIC to Abaqus. This step is very important for the “Virtual Testing” approach. In future research, these results will be used to use a damage model such as the DPM to simulate other loading paths for other impact energies and to obtain envelope curves. The DPM should be able to answer certain questions, such as the location of the failure occur-rence, and to explain the interaction between damage propagation and postbuckling more precisely.
Declaration of competing interest
The authors declare that they have no known competing financial interests or personal relationships that could have appeared to influence the work reported in this paper.
CRediT authorship contribution statement
A. Trellu: Conceptualization, Methodology, Validation, Formal analysis, Investigation, Data curation, Writing - original draft. G. Pichon: Conceptualization, Methodology, Software, Validation, Formal analysis, Investigation, Resources, Data curation, Writing - original draft, Writing - review & editing. C. Bouvet: Conceptualization, Meth-odology, Software, Validation, Formal analysis, Investigation, Re-sources, Data curation, Writing - original draft, Writing - review & editing, Supervision, Project administration, Funding acquisition. S. Rivallant: Conceptualization, Methodology, Software, Validation, Formal analysis, Investigation, Resources, Data curation, Writing - original draft, Writing - review & editing, Supervision. B. Castani�e: Conceptualization, Methodology, Software, Validation, Formal analysis,
References
[1] A. Tropis, M. Thomas, J.L. Bounie, P. Lafon, Certification of the composite outer wing of the ATR72, J. Aero. Eng, Proc. Inst. Mech. Eng. Part G 209 (1994) 327–339, https://doi.org/10.1243/PIME_PROC_1995_209_307_02.
[2] J. Rouchon. Certification of Large Aircraft Composite Structures, Recent Progress and New Trends in Compliance Philosophy, 17th ICAS, Stockholm, Sweden, 1990. [3] E. Morteau, C. Fualdes, Composites @ Airbus, Damage Tolerance Methodology.
FAA Workshop for Composite Damage Tolerance and Maintenance, 2006. Chicago IL.
[4] J.B. Chang, V.K. Goyal, J.C. Klug, J.I. Rome, Composite Structures Damage Tolerance Analysis Methodologies, 2012, p. 217347. NASA/CR. [5] ASTM D7136/D7136M, Standard Test Method for Measuring the Damage
Resistance of a Fiber-Reinforced Polymer Matrix Composite to a Drop-Weight Impact Event, 2015.
[6] ASTM D7137/D7137M, Standard Test Method for Compressive Residual Strength Properties of Damaged Polymer Matrix Composite Plates, 2012.
[7] G. Caprino, V. Lopresto, The significance of indentation in the inspection of carbon fibre-reinforced plastic panels damaged by low-velocity impact, Compos. Sci. Technol. 60 (2000) 1003–1012, https://doi.org/10.1016/S0266-3538(99)00196- 7.
[8] S. Abrate, B. Castani�e, Y.D.S. Rajapakse, Dynamic Failure of Composite and Sandwich Structures, Springer, Dordrecht, 2013.
[9] P. Perugini, A. Riccio, F. Scaramuzzino, Influence of delamination growth and contact phenomena on the compressive behavior of composite panels, J. Compos. Mater. 33 (1999) 1433–1456, https://doi.org/10.1177/002199839903301504. [10] S. Rivallant, C. Bouvet, E.A. Abdallah, B. Broll, J.J. Barrau, Experimental analysis
of CFRP laminates subjected to compression after impact: the role of impact- induced cracks in failure, Compos. Struct. 111 (2014) 147–157, https://doi.org/ 10.1016/j.compstruct.2013.12.012.
[11] T.D. McQuigg, Compression after Impact Experiments and Analysis on Honeycomb Core Sandwich Panels with Thin Facesheets, NASA/CR, 2011, p. 217157. [12] A.R. Kristnama, X. Xu, D. Nowell, M.R. Wisnom, S.R. Hallett, Experimental
investigation of high velocity oblique impact and residualtensile strength of carbon/epoxy laminates, Compos. Sci. Technol. 182 (2019) 107772, https://doi. org/10.1016/j.compscitech.2019.107772.
[13] Q.D. Yang, B.N. Cox, X.J. Fang, Z.Q. Zhou, Virtual testing for advanced aerospace composites: advances and future needs, J. Eng. Mater. Technol. 133 (2011), 011002, https://doi.org/10.1115/1.4002637.
[14] O. Vallmaj�o, I.R. C�ozar, C. Furtado, R. Tavares, A. Arteiro, A. Turon, P.P. Camanho, Virtual calculation of the B-value allowables of notched composite laminates, Compos. Struct. 212 (2019) 11–21, https://doi.org/10.1016/j.
compstruct.2018.12.049.
[15] ANR VERTEX PROJECT, Accessed, http://www.institut-clement-ader.org/vertex/. (Accessed 30 March 2020).
[16] J. Serra, Etude exp�erimentale et num�erique de la propagation de coupure dans des stratifi�es composites soumis �a des chargements complexes, PhD Thesis, University of Toulouse, France, 2016.
[17] J. Serra, J.E. Pierri�e, J.C. Passieux, J.N. P�eri�e, C. Bouvet, B. Castani�e, Validation of aeronautical composite structures under multiaxial loading: the VERTEX Project. Part 1: experimental setup, instrumentation with FE-SDIC and procedures, Compos. Struct. 179 (2017) 224–244, https://doi.org/10.1016/j. compstruct.2017.07.080.
[18] J. Serra, J.E. Pierri�e, J.C. Passieux, J.N. P�eri�e, C. Bouvet, B. Castani�e, C. Petiot, Validation of aeronautical composite structures under multiaxial loading: the VERTEX Project. Part 2: load envelopes for the assessment of panels with large notches, Compos. Struct. 180 (2017) 550–567, https://doi.org/10.1016/j. compstruct.2017.08.055.
[19] K. Wolf, H. Kossira, An Efficient Test Method for the Experimental Investigation of the Post-buckling Behavior of Curved Shear Panels, ECCM Composite Testing and Standardization, Amsterdam, 1992.
[20] G. Romeo, G. Frulla, Buckling and Post-buckling Behavior of Anisotropic Plates under Combined Biaxial Compression and Shear Loads, ECCM Composite Testing and Standardization, Amsterdam, 1992.
[21] M. Rouse, R.D. Young, R.E. Gehrki, Structural Stability of a Stiffened Aluminum Fuselage Panel Subjected to Combined Mechanical and Internal Pressure Loads, 2003, p. 1423. AIAA Paper.
[22] A. Bergan, J.G. Bakuckas, A. Lovejoy, D. Jegley, K. Linton, G. Korkosz, J. Awerbuch, T.M. Tan, Full-scale test and analysis of a PRSEUS fuselage panel to assess damage-containment features, in: Aircraft Airworthiness & Sustainment Conference, 2011. San Diego, California, April 18-21, 2011.
[23] R.W. Peters. Buckling tests of flat rectangular plates under combined shear and longitudinal compression. NACA Tech. Note 1750, 1948.
[24] H. Klein, General about buckling tests with thin-walled shells, Rap. DLR- Mitt 89–13 (1989).
[25] G. Zucco, V. Oliveri, D. Peeters, R. Telford, G.J. Clancy, C. McHale, M. Rouhi, R. O’Higgins, M.R. Young, P.M. Weaver, Static test of a thermoplastic composite wingbox under shear and bending moment, in: 2018 AIAA/ASCE/AHS/ASC Structures, Structural Dynamics, and Materials Conference 8–12 January 2018 Kissimmee, 2018, https://doi.org/10.2514/6.2018-0482. Florida.
[26] B. Castani�e, J.J. Barrau, J.P. Jaouen, S. Rivallant, Combined shear/compression structural testing of asymmetric sandwich structures, Exp. Mech. 44 (2004) 461–472, https://doi.org/10.1007/BF02427957.
[27] B. Castani�e, J.J. Barrau, J.P. Jaouen, Theoretical and experimental analysis of asymmetric sandwich structures, Compos. Struct. 55 (2002) 295–306, https://doi. org/10.1016/S0263-8223(01)00156-8.
[28] J.-E. Pierr�e, J.-C. Passieux, J.-N. P�eri�e, Finite element stereo digital image correlation: framework and mechanical regularization, Exp. Mech. 57 (2017) 443–456, https://doi.org/10.1007/s11340-016-0246-y.
[29] J.C. Passieux, F. Bugarin, C. David, J.N. P�eri�e, L. Robert, Multiscale displacement field measurement using digital image correlation: application to the identification of elastic properties, Exp. Mech. 55 (2015) 121–137, https://doi.org/10.1007/ s11340-014-9872-4.
[30] C. Bouvet, B. Castani�e, M. Bizeul, J.J. Barrau, Low velocity impact modeling in laminate composite panels with discrete interface elements, Int. J. Solid Struct. 46 (2009) 2809–2821, https://doi.org/10.1016/j.ijsolstr.2009.03.010.
[31] V. Achard, C. Bouvet, B. Castani�e, C. Chirol, Discrete Ply modelling of open hole tensile tests, Compos. Struct. 113 (2014) 369–381, https://doi.org/10.1016/j. compstruct.2014.03.031.
[32] J. Serra, C. Bouvet, B. Castani�e, C. Petiot, Scaling effect in notched composites: the Discrete Ply Model approach, Compos. Struct. 148 (2016) 127–143, https://doi. org/10.1016/j.compstruct.2016.03.062.
[33] N. Hongkarnjanakul, C. Bouvet, S. Rivallant, Validation of low velocity impact modelling on different stacking sequences of CFRP laminates and influence of fibre failure, Compos. Struct. 106 (2013) 549–555, https://doi.org/10.1016/j. compstruct.2013.07.008.
[34] ST-SIMPACT platform. http://www.institut-clement-ader.org/plateformes/stimpa ct/. (Accessed 30 March 2020).
[35] J.C. Passieux, P. Navarro, J.-N. P�eri�e, S. Marguet, J.-F. Ferrero, A digital image correlation method for tracking planar motions of rigid spheres : application to medium velocity impacts, Exp. Mech. 54 (2014) 1453–1466, https://doi.org/ 10.1007/s11340-014-9930-y.
[36] H. Wagner, Flat Sheet Metal Girders with Very Thin Web: Part III - Sheet Metal Girders with Spars Resistant to Bending. The Stress in Uprights - Diagonal Tension Fields, 1931. Technical report NACA TM-606.
[37] P. Sztefek, R. Olsson, Tensile stiffness distribution in impacted composite laminates determined by an inverse method, Compos. Part A 39 (2008) 1282–1293, https:// doi.org/10.1016/j.compositesa.2007.10.005.
[38] P. Sztefek, R. Olsson, Non linear compressive stiffness distribution in impacted composite laminates determined by an inverse method, Compos. Part A 40 (2009) 260–272, https://doi.org/10.1016/j.compositesa.2007.10.005.
![Fig. 1. Complex loading test machines (extracted from: Type 1 [ 19 ]; Type 2 [ 20 ]; Type 3 [ 21 ]; Type 4 [ 22 ], Type 5 [ 25 ])](https://thumb-eu.123doks.com/thumbv2/123doknet/2941082.79157/3.892.117.798.126.1026/complex-loading-machines-extracted-type-type-type-type.webp)