Industrial Validation of a Predictive Model of the Nutritional Quality of
Tomato-Based Products during Processes
M. Gil1,2, C. Dufour1,2, X. Meyer3,4, C. Brandam3,4, M. Roland3, M. Wagner5 and S. Georgé5
1 INRA, UMR408, Sécurité et Qualité des Produits d’Origine Végétale, France
2 Université d’Avignon, UMR408, Sécurité et Qualité des Produits d’Origine Végétale,
France
3 Université de Toulouse, INPT, UPS, Laboratoire de Génie Chimique, France 4 CNRS, UMR 5503, Laboratoire de Génie Chimique, France
5 CTCPA, France
Keywords: tomato, food processing, modelling, prediction, tool Abstract
Opti’Tom aims to develop and confirm, at pilot and industrial scale, stoichio-kinetic models describing changes in micronutrients contents in tomato-based products during processing. Two kinds of processes were studied such as production of tomato paste from fresh tomatoes and sauces from tomato paste. Several pilot trials were conducted and the data (amounts of microconstituents, schedules of the processes) were exploited to develop a software in order to optimize the current manufacturing processes.
INTRODUCTION
Food companies want to improve the quality of their products ensuring complex organoleptic properties and high nutritional value. The development of such foods and the reassessment of existing products and processes require controlling the interaction between structure and chemical reactivity of the food in relation with applied treatments. The study and at last the control of these reactions are an important challenge of progress for food industry.
During a previous project (Chanforan, C. – PhD thesis 2010, Université d’Avignon), a partial model of tomato sauce process, using kinetic laws, was obtained in model systems. The aim of this project is to develop and validate at pilot and industrial scale stoichio-kinetic models describing the evolution of tomato compounds of interest during transformation. A tool will enable to improve existing processes and predict the final nutritional quality avoiding many uncertain and expensive preindustrial trials. It was built for companies in the sector of tomato-based products.
MATERIALS AND METHODS Compounds Targeted
(E)-lycopene, (E)-β-carotene, chlorogenic acid, rutin, naringenin, naringenin chalcone, ascorbic acid and α-tocopherol were chosen as nutritional markers of tomato and analyzed at each step of processes.
Pilot Plan Trials
Two types of products were targeted such as tomato paste (directly processed from tomato) and tomato sauce (processed from tomato paste). These trials were conducted on 35 L-instrumented pilot equipment to collect technological data during processes such as temperatures or flow rates. Experiments have been designed to collect data providing a maximum of information in order:
- to develop and validate the stoichio-kinetic models - to reduce model parameters uncertainty.
With this approach, the resulting experiments presented atypical temperature profiles compared to classical industrial practices.
1. Fresh Tomato to Tomato Paste. In the industry, two types of processes are usually
used like Hot Break (HB) or Cold Break (CB). This study focused on the CB process. The different steps of the CB process are: receiving fresh product, washing, crushing, sieving, preheating, concentration, pasteurization in retort. The study of the evolution of compounds was conducted at different conditions and different steps:
1. Before sieving at 25, 30 and 35°C during 3 h.
2. Cold break at 50, 60, 70 and 80°C during 2 h and at 60 and 80°C during 2 h but packed in pouches without oxygen.
3. Scheduled process at 95°C during 25 and 60 min, at 105°C during 15, 25 and 60 min and at 125°C during 25 and 60 min.
2. Tomato Paste to Tomato Sauce. The different steps were the recipe (water 69%,
tomato paste 25%, sugar 1.5%, salt 1.5%, starch 1.5% and sunflower oil 1.5%), the re-heat and the scheduled process. The study of the compound evolution was conducted at different conditions at different steps:
1. Re-heat at 50, 60, 70, 80 and 95°C during 2 h and at 50, 70 and 95°C during 2 h but packed in pouches without oxygen.
2. Scheduled process at 125°C during 30, 60 and 90 min.
Model, Identification of Kinetic Parameters and Software
The dynamic model basis was elaborated with a first qualitative analysis more than 2000 independent data resulting from the various experiments. Reactions to be taken into account were established and a kinetic law for each reaction was proposed. Kinetic parameters like reaction rate constants and activation energies were identified with Matlab toolbox. The model was able to calculate the concentration of the considered compounds for a temperature profile applied.
This stoichio-kinetic model was implemented in Matlab with a friendly-user interface. This computer tool named SiMiNuT’ is directly usable by industrials and able to simulate effects of temperature profile and oxygen transfer on considered compounds. It can predict the final nutritional quality from a given raw material.
RESULTS AND DISCUSSION
Fresh Tomato to Tomato Paste Processing Model
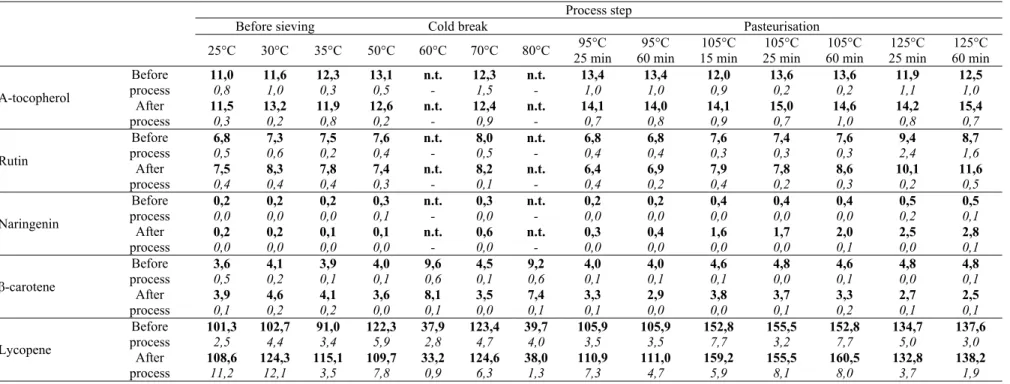
The degradation rates of the compounds were significantly different even inside the same compound family (carotenoids or phenolic compounds).
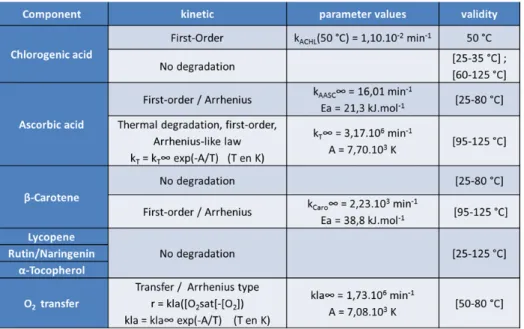
No degradation was observed for lycopene, rutin, naringenin and α-tocopherol, whatever the temperature was between 25 and 125°C (Table 1). Conversion of E-β-carotene into Z-β-E-β-carotene occurred only when the temperature was higher than 50°C. Beyond this temperature, the kinetic of the degradation showed a good adequacy with a first order Arrhenius type kinetic law.
For ascorbic acid, experimental results (Table 2) highlighted two degradation pathways: oxidation until 80°C and thermal degradation at higher temperatures. For both pathways, first order Arrhenius type kinetic laws fitted with good agreement to experimental measurements. The oxygen transfer between 50 and 95°C was modelled through a temperature dependent mass transfer (kla) coefficient. Above 95°C it was assumed that the liquid phase was free from oxygen.
Chlorogenic acid degradation was shown to be significant only at 50°C, when dissolved oxygen was not a limiting factor. At 25 and 35°C as well as between 60 and 125°C when oxygen was consumed by acid ascorbic oxidation, no degradation was observed (Table 2). A first order kinetic law regarding each reactant was assumed for the degradation of this component depending on chlorogenic acid and dissolved oxygen contents.
Table 3 summarizes the kinetic parameters values for fresh tomato to tomato paste processing.
Tomato Paste to Tomato Sauce Processing Model
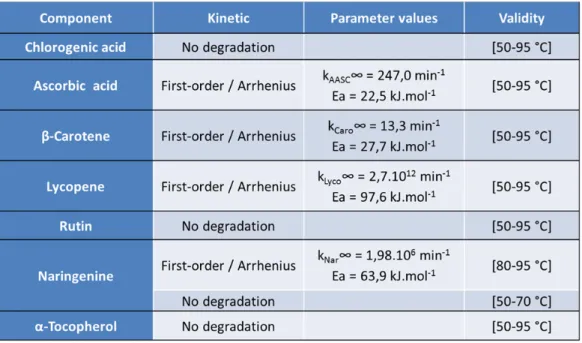
The behavior was quite different for processing tomato paste into tomato sauce. Ascorbic acid was the main affected compound. Under a reheating step, its concentration decreased by 90% after half an hour, and totally disappeared after one hour at any temperature tested (Table 4). Under a reheating under nitrogen, the decreased is lower at any temperature.
No degradation was observed for rutin, chlorogenic acid and naringenin, whatever the temperature was (50-95°C). But for beta-carotene and lycopene, we observe a low decrease linked to the temperature (50 < 60 < 70 < 80 < 95°C) (Table 5).
Table 6 summarizes the kinetic parameters values for tomato paste to tomato sauce processing.
Simulation Tool
The model described formerly and identified from experimental data was implemented into Matlab and a user-friendly interface was developed to make it directly usable by industrials (Fig. 1). The interface includes the initial concentrations of the compounds of interest and the process thermal profile. This profile can be provided manually or charged from an Excel file when available.
Figure 2 gives an example of the outcome of the tool. Each calculated component content profile is plotted versus time (continuous line). The temperature profile is reminded on all graphs (dotted lines). A pasteurization value is proposed. Finally, the results can be exported into an Excel file upon request.
Industrial Validation
An industrial validation will be performed by sampling tomato products directly on the process line. These samples will be analysed to quantify the compound targeted and the process data will be recovered.
This phase will ultimately characterize the model from a statistical standpoint (robustness, reliability...) and ensure its reliability regarding industrial requirements.
CONCLUSION
Opti’Tom has permitted to develop a prediction software. This operational tool will allow companies to optimize their processes to offer consumers products with better nutritional quality and thus enhance the value of their commercial products, save time testing during the development of new products or new recipes and to be more responsive in the development of new products, particularly in response to tenders of supermarkets.
ACKNOWLEDGEMENT
This project was funded by the French “Ministère de l’agriculture, de l’alimentation, de la pêche, de la ruralité et de l’aménagement du territoire” with the contract n° CP13 PACA 05 12-1.
Literature Cited
Abushita, A.A., Daood, H.G. and Biacs, P.A. 2000. Change in carotenoids and antioxidant vitamins in tomato as a function of varietal technological factors. J. Agric. Food Chem. 48:2075-2081.
Bosch, V., Cilla, A., García-Llatas, G., Gilabert, V., Boix, R. and Alegría, A. 2013. Kinetics of ascorbic acid degradation in fruit-based infant foods during storage. Journal of Food Engineering 116:298-303.
Capanoglu, E., Beekwilder, J., Boyacioglu, D., Hall, R. and De Vos, R. 2008. Changes in antioxydant and metabolite profiles during production of tomato paste. J. Agric. Food Chem. 56:964-973
Chanforan, C. 2010. Stabilité de microconstituants de la tomate (composés phénoliques, caroténoïdes, vitamines C et E) au cours des procédés de transformation: études en systèmes modèles, mise au point d’un modèle stoechio-cinétique et validation pour
l’étape unitaire de préparation de sauce tomate. Thèse de Docteur en Sciences, Université d’Avignon et des Pays de Vaucluse
Chanforan, C., Loonis, M., Mora, N., Caris-Veyrat, C. and Dufour, C. 2012. The impact of industrial processing on health-beneficial tomato microconstituents. Food Chem. 134:1786-1795.
Dhuique-Mayer, C. 2007. Thermal degradation of antioxydant micrunutrients in citrus Juice: kinetics and newly formed compounds. J. Agric. Food Chem. 55:4209-4216. Penicaud, C., Achir, N., Dhuique-Mayer, C., Dornier, M. and Bohuon, P. 2011.
Degradation of ß-carotene during fruit and vegetable processing or storage: reaction mechanisms and kinetic aspects: a review. Fruits 66(6):417-440.
Re, R., Bramley, P.M. and Rice-Evans, C. 2002. Effects of food processing on flavonoids and lycopene status in a Mediterranean tomato variety. Free Radical Res. 36(7):803-810.
Tables
Table 1. Concentration expressed in mg/100 g of dry matter.
Process step
Before sieving Cold break Pasteurisation
25°C 30°C 35°C 50°C 60°C 70°C 80°C 25 min 95°C 60 min 95°C 15 min 105°C 25 min 105°C 60 min 105°C 25 min 125°C 60 min 125°C Α-tocopherol Before process 11,0 11,6 12,3 13,1 n.t. 12,3 n.t. 13,4 13,4 12,0 13,6 13,6 11,9 12,5 0,8 1,0 0,3 0,5 - 1,5 - 1,0 1,0 0,9 0,2 0,2 1,1 1,0 After process 11,5 13,2 11,9 12,6 n.t.0,3 0,2 0,8 0,2 - 12,40,9 n.t.- 14,1 14,0 14,1 15,0 14,6 14,2 15,4 0,7 0,8 0,9 0,7 1,0 0,8 0,7 Rutin Before process 6,8 7,3 7,5 7,6 n.t. 8,0 n.t. 6,8 6,8 7,6 7,4 7,6 9,4 8,7 0,5 0,6 0,2 0,4 - 0,5 - 0,4 0,4 0,3 0,3 0,3 2,4 1,6 After process 7,5 8,3 7,8 7,4 n.t.0,4 0,4 0,4 0,3 - 8,20,1 n.t.- 6,4 6,9 7,9 7,8 8,6 10,1 11,6 0,4 0,2 0,4 0,2 0,3 0,2 0,5 Naringenin Before process 0,2 0,2 0,2 0,3 n.t. 0,3 n.t. 0,2 0,2 0,4 0,4 0,4 0,5 0,5 0,0 0,0 0,0 0,1 - 0,0 - 0,0 0,0 0,0 0,0 0,0 0,2 0,1 After process 0,2 0,2 0,1 0,1 n.t. 0,6 n.t. 0,3 0,4 1,6 1,7 2,0 2,5 2,8 0,0 0,0 0,0 0,0 - 0,0 - 0,0 0,0 0,0 0,0 0,1 0,0 0,1 β-carotene Before process 3,6 4,1 3,9 4,0 9,6 4,5 9,2 4,0 4,0 4,6 4,8 4,6 4,8 4,8 0,5 0,2 0,1 0,1 0,6 0,1 0,6 0,1 0,1 0,1 0,0 0,1 0,0 0,1 After process 3,9 4,6 4,1 3,6 8,1 3,5 7,4 3,3 2,9 3,8 3,7 3,3 2,7 2,5 0,1 0,2 0,2 0,0 0,1 0,0 0,1 0,1 0,0 0,0 0,1 0,2 0,1 0,1 Lycopene Before process 101,3 102,7 91,0 122,3 37,9 123,4 39,7 105,9 105,9 152,8 155,5 152,8 134,7 137,6 2,5 4,4 3,4 5,9 2,8 4,7 4,0 3,5 3,5 7,7 3,2 7,7 5,0 3,0 After process 108,6 124,3 115,1 109,7 33,2 124,6 38,0 110,9 111,0 159,2 155,5 160,5 132,8 138,2 11,2 12,1 3,5 7,8 0,9 6,3 1,3 7,3 4,7 5,9 8,1 8,0 3,7 1,9
Table 2. Concentration expressed in mg/100 g of dry matter.
Process step Temperature (°C) Before process Ascorbic acid After process Before process Chlorogenic acid After process Before sieving 25 308,3 11,4 184,7 7,8 7,8 0,3 8,5 0,1 30 320,2 10,3 210,1 7,8 8,2 0,8 8,1 0,4 35 321,2 18,2 175,0 5,2 7,3 0,2 7,1 0,5 Cold break 50 281,7 6,6 149,6 2,1 8,4 0,3 2,1 0,6 60 279,4 8,0 161,3 12,4 21,6 1,6 22,4 1,1 70 329,2 9,5 52,4 6,6 9,3 0,4 9,3 0,4 80 263,5 7,2 3,9 0,1 14,6 0,4 15,6 1,0 Pasteurisation 95°C - 25 min 272,9 1,5 247,0 1,9 7,0 0,5 6,4 0,5 95°C - 60 min n.t. - n.t. - 7,0 0,5 6,8 0,3 105°C - 15 min 224,2 4,4 201,5 9,3 8,9 0,4 8,8 0,6 105°C - 25 min 189,1 5,6 163,1 4,3 9,1 0,2 9,4 0,4 105°C - 60 min 238,8 3,8 202,1 17,7 8,9 0,4 8,7 0,4 125°C - 25 min 222,0 6,2 163,7 2,1 6,9 0,3 7,6 0,2 125°C - 60 min 227,6 5,1 112,1 4,0 6,9 0,5 7,0 0,8 Cold break under N2 60 80 217,8 177,2 3,9 7,6 130,3 63,0 16,6 3,5 9,7 8,4 0,9 0,4 10,5 8,7 0,9 0,4 In bold the average and in italic the standard deviation of 4 repetitions (2 analytic and 2 pilot repetitions). n.t. = not tested.
Table 3. Parameter kinetic values and temperature range validity for all micronutrients.
Table 4. Concentration expressed in mg/100 g of dry matter. Process step
Re-heating Re-heating under N2 50°C 60°C 70°C 80°C 95°C 50°C 70°C 95°C Ascorbic acid Before process
88,0 104,9 114,3 191,5 183,3 112,2 106,6 106,1 1,0 7,7 2,1 2,5 5,8 0,8 1,6 2,1 After process 2,0 1,8 0,4 0,0 7,6 91,8 90,6 83,6 1,3 0,2 0,0 - 0,3 1,3 0,3 0,5 In bold the average and in italic the standard deviation of 4 repetitions (2 analytic and 2 pilot repetitions).
Table 5. Concentration expressed in mg/100 of dry matter. Process step
Re-heating Re-heating under N2 50°C 60°C 70°C 80°C 95°C 50°C 70°C 95°C Rutin Before process 14,8 n.t. 14,6 26,2 21,2 n.t.0,1 - 0,4 0,5 0,9 - -n.t. n.t. -After process 15,2 n.t.0,3 - 14,5 23,5 22,6 n.t.0,6 2,1 1,9 - -n.t. n.t. -Chlorogenic acid Before process 5,5 n.t. 5,2 13,6 16,8 n.t.0,1 - 0,1 0,7 0,9 - -n.t. n.t. -After process 5,3 n.t.0,1 - 4,9 12,7 17,8 n.t.0,1 0,7 1,3 - -n.t. n.t. -Naringenin Before process 1,4 n.t. 1,4 7,1 6,1 n.t.0,0 - 0,0 0,1 0,3 - -n.t. n.t. -After process 1,4 n.t.0,1 - 0,0 1,3 5,4 5,4 n.t.0,5 0,5 - -n.t. n.t. -β-carotene Before process 3,7 3,4 3,7 5,3 6,0 3,7 3,5 3,5 0,1 0,1 0,1 0,1 0,3 0,1 0,0 0,1 After process 3,4 3,2 3,0 4,1 3,7 3,6 3,5 3,1 0,1 0,1 0,1 0,1 0,2 0,2 0,1 0,2 Lycopene Before process 102,9 100,2 97,8 149,2 91,2 94,3 96,1 92,5 3,6 0,7 1,9 44,4 7,8 3,7 5,3 0,0 After process 96,4 84,2 70,9 77,0 69,8 94,6 91,6 70,6 2,3 10,1 4,4 6,6 10,4 1,9 2,6 11,6 In bold the average and in italic the standard deviation of 4 repetitions (2 analytic and 2 pilot repetitions). n.t. = not tested.
Figures
Fig. 1. User-friendly interface of the SiMiNuT tool.