OATAO is an open access repository that collects the work of Toulouse
researchers and makes it freely available over the web where possible
Any correspondence concerning this service should be sent
to the repository administrator: tech-oatao@listes-diff.inp-toulouse.fr
This is an author’s version published in: https://oatao.univ-toulouse.fr/27032
To cite this version:
Pettes-Duler, Matthieu and Roboam, Xavier and Sareni,
Bruno and Touhami, Sarah and Lefèvre, Yvan and Llibre,
Jean-François. Sensitivity analysis of a hybrid-electric aircraft
powertrain based on Sobol indices. (2020) In: Aerospace
Europe Conference 2020, 25-28 February 2020 (Bordeaux,
France). (Unpublished)
Sensitivity analysis of a hybrid-electric aircraft powertrain based on Sobol indices.
Matthieu PETTES-DULER, Xavier ROBOAM, Bruno SARENI, Sarah TOUHAMI, Yvan LEFEVRE,Jean-François LLIBRE.
LAPLACE, Université de Toulouse, CNRS, INPT, UPS, France ENSEEIHT 2, rue Charles Camichel - BP 7122 - 31071 Toulouse Cedex 7
pettes@laplace.univ-tlse.fr
KEYWORDS: More Electric Aircraft, Hybrid-Electric Propulsion, Multidisciplinary Design Optimization, Sensitivity Analysis.
ABSTRACT:
This paper presents a sensitivity analysis based on the Sobol indices which is an essential step “on the road of system optimization”. Such analysis focuses on electrical propeller subsystem (propellers, gearbox, electric motors) including surrogate design models. A previous study [1] has shown that electromechanical actuators (electric generators and electric motors) involve more than 30% of hybrid electric propulsion system weight. Furthermore, most of the variables used for the electric machine design. The electric motor design model is detailed with the related constraints. A physical analysis based on design parameter sensitivity and parameter couplings are described. This study will permit to remove insensitive variables in view of simplifying the global optimization process to be achieved at the whole powertrain level.
1. Introduction
Research on hybrid-electric aircraft has never been important. The European HASTECS (Hybrid Aircraft; Academic reSearch on Thermal and Electrical Components and Systems) project in the framework of Clean Sky II focuses on series hybrid electric architecture. Assessments are integrated at system level and involve design and analysis of the main devices of the hybrid powertrain (see Fig. 1):
electric machines and related cooling, cables, power electronics and associated thermal management and auxiliary sources (fuel cells, batteries).
Fig. 1. Series hybrid electric powertrain architecture.
Such system integration takes into account the main environmental constraints, related to partial discharges due to new high power and ultra-high voltage standards. It is already known from other studies[2]] [3]that [4]integration of a hybrid-electric propulsion system into an aircraft tends to increase its mass even by considering optimistic assessments (electric motor specific power higher than 10kW/kg). Disruptive technologies have to be found in order to promote the electric flight opportunity. In HASTECS project moderate targets have been chosen. The first to be reached by 2025 is to get specific powers of 5 kW/kg for electric motors (including the cooling system) with partial discharge tolerance, while15 kW/kg are imposed for the power electronics and its adjoined cooling system. The second target by 2035 is to reach or exceed 10 kW/kg for electromechanical actuators and 25 kW/kg for inverters (cooling systems are included in all cases). This study aims at a multidisciplinary design optimization (MDO) through analytical models of each device of the hybrid electric powertrain with a fixed aircraft architecture. In our case, a series hybrid-electric aircraft architecture, involving system design oriented models to optimize the propulsion system, is assessed. Estimating the Maximum Take-Off Weight (MTOW) and its snowball effects, the fuel burn can also be assessed and is seen as the optimization objective. It can be derived by means of the simplified but realistic integrated design process (cf Fig. 2) already validated with reference to aerodynamic models [5]
Fig. 2 : Integrated Design Process Loop
Through each device model, either efficiency and weight are assessed at the end of each iteration to take account of the whole powertrain weight included in the MTOW.
2. Sobol indices-based sensitivity analysis. In order to prepare the global optimization of the overall hybrid-electric powertrain by limiting the number of decision variables, a study of each technical model of the devices has to be assessed. The issue is to select the most sensitive variables at the powertrain level. An example of work deals with the Sobol indices for global sensitivity analysis. In this work, G. Chastaing[6], used such indices for dependent values for an energy study of a building. In this case, variables are assumed to be independent.
2.1. An overview of the Sobol indices:
Sobol indices allow to identify particularly sensitive input variables X with regard to certain output mean values Y. Such indices are obtained by decomposition of the variance in the case of independent inputs. Model output may be written as follows:
: ℝ → ℝ
, , , … , →
Following the Hoeffding decomposition [7]The output variable is:
∑ ∑ , ⋯
, ,…, , , … , (1)
Where is constant and calculated by the mean of
Y is a function of , , nbvar is the number of
variables, i and j are the indices. To obtain variance decomposition expression, f function is assumed to be square-integral, the decomposition may be squared and integrated. Dividing Eq. (1) by the output variance ! : 1 ∑ #$ #%& ' ∑ #$( #%& ' ⋯ #),*,…,+, #%& ' (2) Where ! - | , !/-0 1 , 23 4 4
So, Sobol indices,56, are defined as follows:
0 8 5 #%&/-0 1 23#%& ' 8 1 (3)
They are different orders:
First order indices: express the effects of each
variable, Xi with respect to the output Y, but not
considering correlation effects between inputs;
0 8 5, #%&9-: ;#%& ', <=4 5 4 5 8 1 (4)
Second order indices: express correlations between
two input variables , .Total order indices:
consider the effects of the variable alone and correlation effects of all other with > ? 6.
2.2. Calculation of the Sobol indices:
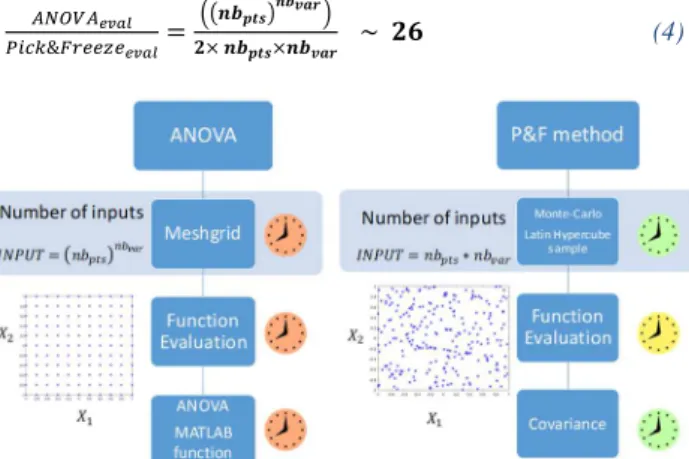
It exists several means to calculate the Sobol indices. In this article two methods have been compared. A choice between them has been made to approximate the indices by considering the calculation time:
1. The ANOVA (Analyze Of VAriance) method based on a regular disposition of the inputs(with @ABCD the number of level): in the example of the electric motor model:
/EFGHI3EFJKL MNO PQ R NSPGHI .
2. The Pick and Freeze method [8], [9] based on two random samplings of the inputs: in the example of the electric motor model: T R EFGHIR EFJKL NO R NSU GHI .
The rate of convergence between the two methods is equivalent to the ratio expressed by Eq. 4:
VWX#VY Z
[ \]&_&``a`Y Z
9/EFGHI3EFJKL=
TR EFGHIREFJKL ~ TP (4)
Fig. 3: Comparison of two Sobol indices estimation methods
The CPU cost of ANOVA method is huge due to its input combinatorial explosion. The function evaluation is directly proportional to the number of inputs. On the contrary, Pick&Freeze method complexity depends on the number of points used for sensitivity analysis. The random draw for the Pick&Freeze method has a small CPU cost. In the case study of an electric motor, the comparison in terms of CPU cost gives explicit differences:
1. for ANOVA method, 1.5 days (four levels (EFGHI) and EFJKL 13 input variables) 2. for Pick&Freeze method: 20 minutes for
From results reported above obviously Pick&Freeze method is the one chosen to be used in the following for its reasonable CPU cost.
3. Whole sensitivity analysis based on specific power assessments.
In this section as in the section 4, a sensitivity analysis based on the Sobol indices is proposed. Two outputs are considered: the MTOW and the fuel burn mass. These outputs of the sensitivity analysis are assessed by means of the looped process proposed in the Fig. 2. Furthermore, for each iteration of the looped process, all the components of the powertrain are sized by following the flow chart of the Fig. 4, from the propeller sizing till the sizing of both hybridized sources (GTs and fuel cells).
Fig. 4: Integrated design process flow chart.
In the current section, in order to confirm the results obtained in [Erreur ! Source du renvoi introuvable.], the input variables of the sensitivity analysis are related to the assessments on both specific powers and efficiencies for electric motors and power inverters. For this study, the component assessments chosen in [1] are considered to set the upper and lower bounds.
In the following studies, a 3-kV ultra-high voltage direct current has been considered. Three hybrid-electric architectures are compared cf Fig. 5: - Turbo electric architecture (TEA) (cf Fig. 5 Aircraft
1): the propulsive power is only supplied by two Turboshafts which drive an electric powertrain. No additional electric source is introduced.
- Hybrid-electric architecture (HEA) (cf Fig. 5 Aircraft 2): the electrical propulsive chain couples an auxiliary electric source (here potentially a fuel
cell) with both turboshafts in order to save fuel
during the low-power demand phases (taxi-in, taxi-out, descent) cf Fig. 6. In that case, both turboshafts have the same (symmetrical) sizing (HEA);
- Hybrid-electric architecture with one turboshaft (HEA1GT), (cf Fig. 5 Aircraft 3): this architecture is the same as the previous one, except that only one turboshaft is embedded. The auxiliary electric source is thus designed for the failure case and completes the power required for takeoff and climb cf Fig. 7. The unique gas turbine is designed for the cruise.
Fig. 5 : Hybrid-electric aircraft architectures.
Fig. 6: Energy management of the Symmetrical Hybrid Electric Aircraft (HEA).
Fig. 7: Energy management of the One Engine Hybrid INPUT DATA Propeller Gearbox Emotor AC Cable Inverter DC Cable EPDC DC Cable Rectifier DC Cable DC Cable Generator Turboshaft Rectifier Generator Turboshaft Battery/FC R @AklC
EPDC: Electrical Power Distribution Center FC : Fuel Cell 0 0,1 0,2 0,3 0,4 0,5 0,6 0,7 0,8 0,9 1 0 20 40 60 80 100 120 P o w e r (p u ) Time (min)
Electrical Power Distribution Center Profile (PU)
TA X I-O U T CRUISE TAKE-OFF & CLIMB
D E S C E N T TA X I-IN H2 H2 APPROACH & LANDING H2 R T R T R T 0 0,1 0,2 0,3 0,4 0,5 0,6 0,7 0,8 0,9 1 0 20 40 60 80 100 120 P o w e r (p u ) Time (min)
Electrical Power Distribution Center Profile (PU)
TA X I-O U T CRUISE TAKE-OFF & CLIMB
D E S C E N T TA X I-IN H2 H2 APPROACH & LANDING H2 H2
Electric
Aircraft (HEA1GT).
The results are detailed in Fig. 8 and Fig. 9
respectively regarding the fuel burn then the MTOW as the output. The electric motor is the most sensitive electrical component so the most important to be optimized with regard to the MTOW. The efficiency (m) is also sensitive on the fuel mass. Regarding the Fig. 7: , efficiencies (m`klCl& and m n`&C`&) are sensitive as they directly impact the source sizing so the fuel burn demand. Besides, the power density of the electric motor is highly sensitive to the fuel mass: the results confirm those obtained in a previous study [1].
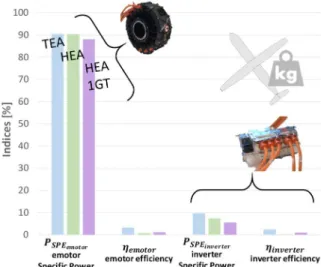
Regarding the sensitivity of both specific powers and efficiencies on MTOW (cf Fig. 9): the specific power (op[qYrsts ) of the electric motor is the most sensitive variable to decrease the aircraft mass.
Fig. 8: First order Sobol indices for three hybrid-electric architectures regarding the fuel mass; bar colors are
related to the 3 compared architectures.
Fig. 9: First order Sobol indices for three hybrid-electric architectures regarding the MTOW; bar colors are
related to the 3 compared architectures.
This analysis was based on very simple models for
electronic powers and electric motors which allow validating the sensitivity analysis based on Sobol indices using the Pick&Freeze calculation method. Therefore, the same approach can be used on system-oriented design models involving a geometrical and electromagnetic sizing model for the electric motor which is the most critical and complex component to be designed.
4. Sensitivity analysis of electric motor based on the sizing model:
In this section, only the electric Motor is focused. The sizing model developed in [10]for electric motor design has been taken in order to illustrate the interest of this approach. After the choice of the index calculation method, input variables (and subsequent bounds) have to be determined. In our case an input vector including thirteen variables has been chosen for the motor model inputs [Erreur ! Source du renvoi introuvable.]. It is composed of:
• The power sizing point o`kD a [%] from the power profile.
• The rotational speed sizing point uD a [%] from the rotational speed profile.
• The tangential stress v [Pa].
• The current density w&kD [A/mm²].
• The maximum air gap flux density xy%B [T].
• The maximum teeth flux density xC``Cz [T].
• The maximum yoke flux density x{l]` [T].
• The ratio between the rotor diameter and the active length of the e-motor |}&lC/•k[-].
• The maximum rotor yoke flux density x{l]`st [T].
• The ultra-high voltage direct current €•#}‚[V].
• The number of slots per poles and per phases
@`BB[-].
• The number of pole pairs ƒ [-].
• The number of conductors per slot u\`[-]. As previously both mass and efficiency have been chosen as outputs for the model. The process is reported in Fig. 10:
Power profile Rotationnal speed profile
Inputs variables eMotor model Field weakening model Sobol indices „klCl&tst ZY /m`klCk%… „&lCl& „DC%Cl& „\ll• y/m`klC† s‡$ZY
Fig. 10:
Process to determine Sobol Indices for the electric motor sensitivity analysis.
In order to estimate the cooling mass a specific power of cooling equal to 1 kW/kg is assessed. In that way, losses are simply converted into a roughly estimated cooling mass.
4.1. Analysis of 1st order Sobol indices on the design-oriented electric motor model. Both methods (Anova vs Pick&Freeze) for estimating Sobol Indices have been compared. First order Sobol indices comparison is described in Fig. 11 and Fig. 12.
Fig. 11: First order Sobol indices calculated by the two estimation methods. Output variable: efficiency. Input
variables: motor parameter
Fig. 12: First order Sobol indices calculated by the two estimation methods. Output variable: mass. Input
variables: motor parameter.
At first, this analysis shows that results provided by both estimation methods (Anova vs Pick&Freeze) are quite similar which validates these approaches. In the following the Pick & Freeze method (less consuming in CPU time) can then be
Concerning the obtained values, this first set of sensitivity analysis results are surprising. Indeed, certain variables which are usually impacting the electric motor mass for experts (as the current
density) are not displayed by the 1st order Sobol indices. This can be explained by the two following points:
1. The bounds of input variable bounds have a clear influence on the Sobol indices; Thus, with the help of the electric motor experts, all variable bounds have been revisited.
2. The “low influence” of input variables is also due to the dependences between input variables (To remind, Sobol method assumes the independence of input variables). In this study case, the number of conductors per slot (u\`) is clearly a dependent variable as it may be observed in the Eq. 5 linking
u\` with other input variables:
uˆ‰ Š‹‹! Œk%∗#Ž••‘’
∗√ ∗#)”†$ Y• –6—ℎ (5)
DB &` ƒ, @`BB, ™}&lCšk, … (6)
• DB &` : voltage in one spire [V]
• › : the modulation depth [-]
Finally, the “dependent variables” (such as uˆ‰) can be suppressed in the inputs to keep only independent inputs.
Furthermore, it has to be underlined that 1st order indices do not take account of correlation effects which are rich in information. The total Sobol indices have to be considered for that purpose.
Based on this, sensitivity analysis study is revisited by changing the bounds of input variables, suppressing dependent variables and also analyzing total indices with correlation effects. 4.2. Revisited sensitivity analysis with total
indices and refined bounds:
As previously mentioned, the total order Sobol index are useful to be exploited (effect of the parameter alone + correlation effects of all other with > ? 6). In Fig. 13 results of such analysis are reported:
Fig. 13: First order (pale color) and total order (dark color) Sobol indices and its effects on the e-motor
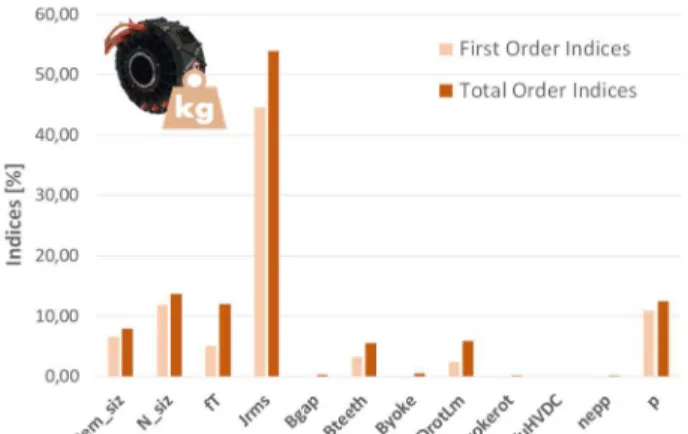
Fig. 14: First order (pale color) and total order (dark color) Sobol indices and its effects on the e-motor mass.
Analyzing Sobol indices and their effect on the electric motor mass, four total order Sobol indices close to zero have been obtained. But these same variables are sensitive on the Emotor efficiency analysis (cf Fig. 13 ).This latter issue shows that both outputs must be considered in order to have a relevant and completer sensitivity analysis. Finally, the insensitive parameters (commonly on both outputs) are:
• x{l]`&lCthe rotor yoke flux density.
• x{l]` the stator yoke flux density.
5. Sensitivity analysis on the
electromechanical powertrain (propeller, gearbox, electric-motor).
In that part, the electromechanical powertrain is concerned coupling gearbox and propeller devices with the eMotor in the sensitivity analysis.
Previous studies have been performed without considering feasibility constraints. In the following study, two constraints have been added: A thermal constraint used by the research teams in charge of the electric motor design and its cooling is related to the necessary cooling effort: œ R w`•8 2.10 with the following parameters:
œ R w`• /[ sŽZY]¡[t,∗p¢ s+ZY” ¥Y¡[£$+¤ ¥Y∗§’¨v¡[£$+‡ $¦t$s+3 (7)
• o©l€•` : the Joule losses [W].
• oª&l : the iron losses [W].
• o« ¬%y` : the windage losses [W].
• o-& \C l : the friction losses in bearings [W].
• 5%•`D%y` : the bore area of the e-motor [› ].
• ®‚¯ °« : the copper resistivity [Ω.m] function of winding temperature °«
• ±C : the end-winding coefficient [-].
This thermal constraint allows to design the electromechanical actuator by considering the cooling system. Beyond this limit the cooling system could not cool down the electric motor which consequently reaches its thermal limit. The second constraint is related to the maximum peripheral speed (150 m/s).
B`& Bz`&%•8 150›/³ (8)
Beyond this value, mechanical deformations can destroy the actuator. Moreover, the variables involved in the propeller and gearbox models have been added to complete the sensitivity analysis. The input data are the requirement data (Thrust, Mach, Altitude) and the analysis process is illustrated in Fig. 15.
Fig. 15: Electromechanical powertrain sensitivity analysis process.
The following set of variables is chosen with their corresponding bounds:
Table 1: sensitivity analysis input variables and their bounds.
Input Variables Lower bound Upper bound
´B&lB”$µ % 100 150 ™y l… 4 1 15 o‰›D a % 80 130 uD a % 80 150 v o 40000 148500 w&kDœ/››² 6 25 xy%Bk%… ° 0.8 1.05 xC``Czk%…° 1 1.53 ™¬&lC•k % 0.5 1.25 €•#}‚ 1000 3000 @`BB 4 1 4 ƒ 4 2 10
• ´B&lB”$µ : the oversizing of the propeller.
• ™y l… : The gearbox ratio.
Propeller MODEL Gearbox MODEL eMotor MODEL
Profile swepping with field weakening + cooling model
(1kW/kg) Sobol indices „klCl&tst ZY/m`klCk%…/¸1/¸2 „&lCl& „DC%Cl& „\ll• y/m`klC† s‡$ZY¸1/¸2 THRUST/MACH /ALTITUDE „y l… my l… „B&lB`••`& mB&lB`••`&
5.1. Sensitivity analysis without constraints. In this section, the electromechanical powertrain efficiency during the cruise, the mass, and the constraints have been stored as outputs in order to determine the Sobol indices. In addition to previous outputs (masses and efficiency), constraints are calculated and displayed to emphasize their influence following the values of the input variables. The results are similar to the ones observed in the previous study (see Fig. 14) except for the tangential pressure and the flux density in the air gap (+10% total order Sobol index). This difference arises from the introduction of the gearbox ratio. Adding this variable allows adapting the rotational speed of the electric motor; thus the rotation speed range is higher than for the previous study. Consequently, the tangential stress and the flux density in the air gap have more impact on the rotor volume and consequently on the motor mass.
Fig. 16: First order (pale color) and total order (dark color) Sobol indices on the e-motor efficiency (without
fulfilled constraints).
Fig. 17: First order (pale color) and total order (dark color) Sobol indices on the e-motor mass (without
fulfilled constraints).
The volume of copper and the volume of magnetic yoke in the stator vary the losses of the electrical machine. Increase the volumes increases losses.
Thus, while the rotor volume variation impacts the stator volume, the stator yoke and copper volumes are impacted too, consequently the losses also vary.
The gearbox ratio directly impacts the e-motor rotor volume (consequently the e-motor mass); thus it becomes the most impacting variable on the overall system mass.
Fig. 18 : First order (pale color) and total order (dark color) Sobol indices on the e-motor peripheral speed
(without constraints).
Regarding the peripheral speed constraint, the impacting variables are directly related to the following equation Eq. 8, linking several input parameters: B`& Bz`&%• (9) Œ[`k”$µ W”$µ ∗ › ¹ Œ [† s†∗º¥,s» W† s†∗¼¥,s»• ∗ ½ ¾-¿∗ ™}&lC/šk • ) À¼¥,s».W† s†.W”$µ Where • my l… : gearbox efficiency [%]
• uB&lB: propeller rotation speed [RPM]
• oB&lB: propeller shaft power [W]
The propeller diameter intervenes through the propeller shaft power oB&lB in the equation 8. So all the sensitive parameters in the Fig. 18 appear the previous equation. 0 10 20 30 40 50 60 70 In d ic e s [% ]
First Order Indices Total Order Indices E-motor variables Gearbox Propeller + gearbox variables 0,0 10,0 20,0 30,0 40,0 50,0 60,0 70,0 80,0 In d ic e s [% ]
First Order Indices Total Order Indices
0,0 10,0 20,0 30,0 40,0 50,0 60,0 70,0 80,0 90,0 In d ic e s [% ]
First Order Indices Total Order Indices
Fig. 19 : First order (pale color) and total order (dark color) Sobol indices on the e-motor peripheral speed
(upper part) and thermal constraint (lower part) (without fulfilled constraints).
For the second constraint (i.e. the thermal limit), results reported in Fig. 13 are similar to those of Fig. 19. Indeed, losses are directly linked with the œ R
w`•, product which qualitatively represents the
thermal constraint.
5.2. Sensitivity analysis with constraints.
In that sub section, only tests fulfilling both constraints (peripheral speed and thermal constraints) are considered for the sensitivity analysis (i.e. for the calculation of Sobol indices).
Fig. 20: First order (pale color) and total order (dark color) Sobol indices on the e-motor efficiency (with fulfilled constraints).
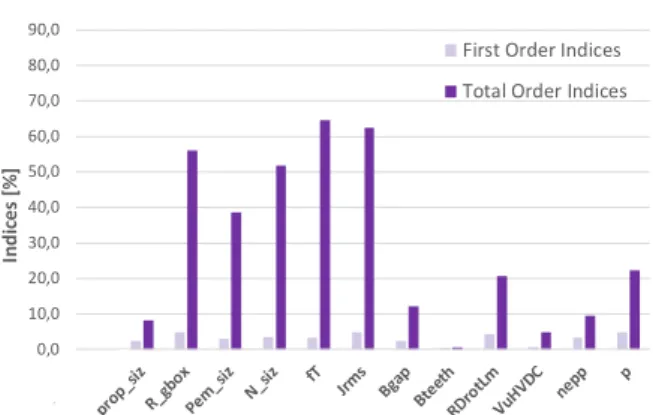
It is interesting to compare the analysis results related to the design of the propulsion system whether if constraints are fulfilled or not. If constraints are not considered (cf Fig. 13), the electric motor variables are the most sensitive to efficiency with respect to the ones related to the gearbox and propeller which indices are quite small. On the contrary, when constraints are taken account and fulfilled, the propeller variable becomes particularly sensitive. This aspect shows that constraint fulfilment is an essential issue of the sensitivity analysis process.
The propeller is the element of the propulsive system characterized by the broadest efficiency variation range. The gearbox efficiency is fixed at 98.5%, while the electric motor has an average efficiency of 97%. considering that propeller has a maximum efficiency value of 85%, the propeller diameter oversizing significantly impacts the whole electromechanical propulsive system efficiency. The slightest improvement in performance makes its sensitive to global efficiency.
Fig. 21: First order (pale color) and total order (dark color) Sobol indices on the e-motor mass (with fulfilled constraints).
Fig. 17 and Fig. 21 display the comparison of motor mass in the case where constraints are checked or not. The trend is quite similar in both cases. The gearbox ratio is more sensitive when constraints are fulfilled. In fact, this variable determines the rotor volume and the torque which is directly linked with the thermal constraint. At the same way, the gearbox ratio determines the motor rotational speed and consequently the peripheral speed.
Fig. 22 : First order (pale color) and total order (dark color) Sobol indices on the e-motor peripheral speed (with constraints).
Obviously the input parameters are sensitive to peripheral speed either if the constraints are checked or not (cf Fig. 18 and Fig. 22). Otherwise, other input variables only influence the output (here the peripheral speed) when the constraint is checked. In other words, in Fig. 18, the current density w&kD, the flux density in the air gap xy%B, the flux density in the teeth xC``Cz, the HVDC bus €•#}‚
0,0 10,0 20,0 30,0 40,0 50,0 60,0 70,0 80,0 90,0 In d ic e s [% ]
First Order Indices Total Order Indices
0 10 20 30 40 50 60 70 In d ic e s [% ]
First Order Indices Total Order Indices
E-motor variables Gearbox Propeller + gearbox variables 0,0 10,0 20,0 30,0 40,0 50,0 60,0 70,0 80,0 In d ic e s [% ]
First Order Indices Total Order Indices
0,0 10,0 20,0 30,0 40,0 50,0 60,0 70,0 80,0 90,0 In d ic e s [% ]
First Order Indices Total Order Indices
and the number of slot per poles and per phases
@`BB were equal to zero. In Fig. 22, the indices have a small (but not null) sensitivity on outputs.
Fig. 23 : First order (pale color) and total order (dark color) Sobol indices on the e-motor thermal constraint(with fulfilled constraints).
When both constraints are checked (Fig. 19, Fig. 23), huge correlation effects appear and the total Sobol indices are pretty high for most of input variables. It is not surprising that the most impacting variables are the gearbox ratio –which determines the torque–, the power and rotational speed sizing, the tangential stress and the current density which is a direct image of the copper losses.
6. Conclusion
To global issue of this paper was to propose a sensitivity analysis approach based on Sobol indices applied to a series hybrid architecture of aircraft powertrain. In order to be able to analyze to whole electromechanical powertrain, a compact design loop has been proposed and validated in order to roughly assess the snowball effects obtained when the weight and efficiencies of embedded devices is varied. This looped process allows integrating weight and efficiency variations to derive consequences in terms of thrust and fuel burn. Then, several sensitivity analyses have been proposed starting with a global vision of the whole powertrain based on rough models with assessments only related to specific powers and energies for the main devices of the powertrain. This part clearly shows that technological performance is really sensitive at the system level and clearly drives the hybrid aircraft performance! The sensitivity analysis was also achieved based on design models proposed in the HASTECS project, especially for the work dedicated to electric motors [10]. This analysis is an important preliminary step before to go further towards the optimization of the overall hybrid electric powertrain, which will be the future study.
7. Acknowledgment
This project has received funding from the Clean Sky 2 Joint Undertaking under the European Union’s Horizon 2020 research and innovation program under grant agreement No 715483. 8. References
[1] M. Pettes-Duler, X. Roboam, and B. Sareni, “Integrated design process of a hybrid electric propulsion system for future aircraft,”
Electrimacs 2019, no. May, pp. 1–6, 2019.
[2] P. Schmollgruber et al., “Multidisciplinary exploration of dragon: An onera hybrid electric distributed propulsion concept,”
AIAA Scitech 2019 Forum, 2019, doi:
10.2514/6.2019-1585.
[3] M. Voskuijl, J. van Bogaert, and A. G. Rao, “Analysis and design of hybrid electric regional turboprop aircraft,” CEAS Aeronaut.
J., vol. 9, no. 1, pp. 15–25, 2018, doi:
10.1007/s13272-017-0272-1.
[4] J. Hoelzen et al., “Conceptual design of operation strategies for hybrid electric aircraft,” Energies, vol. 11, no. 1, pp. 1–26, 2018, doi: 10.3390/en11010217.
[5] J. Thauvin, “Exploration de l’espace de conception d’un avion régional hybride par optimisation multidisciplinaire - Exploring the design space for a hybrid-electric regional aircraft with multidisciplinary design optimisation methods.”, PhD thesis, Université de Toulouse, France, October 2018.
[6] G. Chastaing, “Indices de Sobol généralisés pour variables dépendantes,” PhD thesis, Université de Grenoble, France, October 2013.
[7] I. M. SOBOL, “Sensitivity Estimates for Nonlinear Mathematical Models,” Math.
Mod. Comput. Exp., vol. 1, no. 4, pp. 407–
414, 1993.
[8] F. Gamboa et al., “Statistical inference for Sobol pick freeze Monte Carlo method To cite this version : HAL Id : hal-00804668 Statistical inference for Sobol pick freeze Monte Carlo method,” 2016.
[9] M. Grandjacques, B. Delinchant, and O. Adrot, “Pick and Freeze estimation of sensitivity index for static and dynamic models with dependent inputs,” J. la Société
Française Stat., vol. 157, no. 2, pp. 65-89–
89, 2016.
[10] S. Touhami, A. Zeaiter, M. Fénot, Y. Lefevre, and J. Llibre, “Electro-thermal Models and Design Approach for High Specific Power Electric Motor for Hybrid Aircraft,” AEC2020. 0,0 10,0 20,0 30,0 40,0 50,0 60,0 70,0 80,0 90,0 In d ic e s [% ]
First Order Indices Total Order Indices