Official URL
https://doi.org/10.1145/3290605.3300332
Any correspondence concerning this service should be sent
to the repository administrator:
[email protected]
This is an author’s version published in:
http://oatao.univ-toulouse.fr/26189
Open Archive Toulouse Archive Ouverte
OATAO is an open access repository that collects the work of Toulouse
researchers and makes it freely available over the web where possible
To cite this version: Simon, Florine and Roudaut, Anne and Irani,
Pourang and Serrano, Marcos Finding Information on Non-Rectangular
Interfaces.
(2019) In: ACM International Conference on Human Factors
in Computing Systems (ACM CHI 2019), 3 May 2019 - 9 May 2019
(Glasgow, United Kingdom).
Finding Information on Non-Rectangular Interfaces
Florine Simon IRIT University of Toulouse Toulouse, France fl[email protected] Anne Roudaut BIG University of Bristol Bristol, UK [email protected] Pourang Irani HCI Lab University of Manitoba Winnipeg, Canada [email protected] Marcos Serrano IRIT University of Toulouse Toulouse, France [email protected] ! ABSTRACTWith upcoming breakthroughs in free-form display technologies, new user interface design challenges have emerged. Here, we investigate a question, which has been widely explored on traditional GUIs but unexplored on non-rectangular interfaces: what are the user strategies in terms of visual search when information is not presented in a traditional rectangular layout? To achieve this, we present two complementary studies investigating eye movements in different visual search tasks. Our results unveil which areas are seen first according to different visual structures. By doing so we address the question of where to place relevant content for the UI designers of non-rectangular displays.
displays having any 2D shape [9], and circular displays are already available on many smartwatches (e.g. the Motorola M360). Beyond smartwatches, previous works revealed a broad range of usage contexts [16], where existing artifacts with non-rectangular features were suggested for display augmentation (such as road signs, kitchen cooktops, pocket mirrors among others). &ese technological advances challenge the way we design graphical user interfaces as users may use unconventional strategies for perceiving and searching information on non-rectangular displays.
Recent work [16][17] has begun to address some of the related challenges. In [16], the authors investigate how text layout affects readability and in [17] they propose design guidelines for visual interfaces, such as web pages, based on user’s subjective aesthetic preference. Although both of these works showed essential differences between rectangular and non-rectangular interfaces, these prior studies have not examined visual search strategies employed by users. Revealing these pa%erns is key in identifying how to best place and structure content [4] on non-rectangular displays. Designers could use such information to place relevant information at strategic locations for rapid access, key knowledge for identifying where to place menus or a%ention-grabbing banners on websites [4].
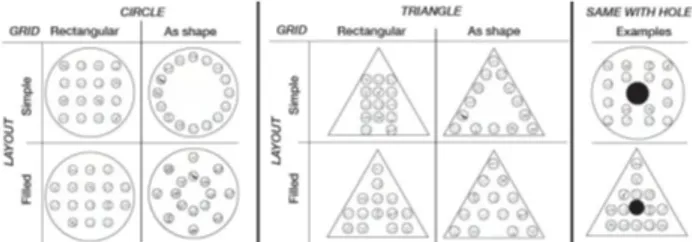
In this work, we fill this gap by investigating eye movements when visually searching information on non-rectangular interfaces. More specifically (see Figure 1) we investigate different type of grids (rectangular or “as shape”, i.e. circular on a circle and triangular on a triangle), and content layout, i.e. the way content is distributed on a grid (we explore two layouts: simple or filled). We looked at two display shapes (circle and triangle, with and without a hole) based on prior work on non-rectangular displays [16], [17]. To track eye movements, we use gaze tracking that has already been widely used to understand how users search information on traditional screens [2].
KEYWORDS
Non-rectangular interface; Visualisation; User interfaces design; visual search.
1!INTRODUCTION
While rectangular interfaces and displays have been the golden standard since the advent of computers, recent technological breakthroughs are paving the way for non-rectangular interfaces. It is now possible to manufacture
expectation about where to find information) and region saliency (i.e. contrast, color, intensity etc.).
2.2! Eye gaze pa!erns on traditional interfaces Gaze tracking has been used to understand how users search information on traditional screens, which has helped generate guidelines for UI designers [2], [3], [4]. Past studies have primarily focused on identifying web page viewing pa%erns, such as the F-shaped pa%ern [14], i.e. when a user focuses on the le' side of the page and then performs horizontal scans. However, it is difficult to generalize these results to other types of grids or interface shapes. For instance, studies have shown that placing text near images influences reading speed [2], or that grouping items affects visual search time [3]. Unveiling gaze pa%erns on non-rectangular interfaces includes the added complexity that such shapes disrupt any of the conventions accepted on traditional display shapes. 2.3! UIs design on non-rectangular interfaces
Researchers have developed novel non-rectangular interfaces for different contexts, ranging from tabletop UIs [5] to round smartwatches [1]. Serrano et al. [16] ,[17] studied how to generate generic guidelines for the design of such UIs. &eir first study [16] focused on text mappings on non-rectangular shapes in terms of reading performance and perceived aesthetic value. Results uncovered new text presentation rules for non-rectangular interfaces: for instance, to use dynamic scrolling on non-rectangular shapes, text should be resized so that each line contains the same amount of text. In a second study [17], they focused on visual layouts for web pages, comparing them in terms of perceived symmetry, clarity and preference. Results led to a set of design guidelines, some of which contradict current conventions: for instance, instead of rectangular boxes for text or images, designers can reshape the content to fit the display (circular on circle, triangular on triangles). However, none of these papers have looked at the movements made by the eyes and how they are affected by different non-rectangular layouts. Yet, as said earlier, understanding visual search is a core concern for HCI, and capturing this knowledge can inform designers how best to present and layout content on non-rectangular interfaces.
3! CONTROLLED STUDY
&e goal of our study was to understand gaze pa%erns and search time when carrying a visual search task on non-rectangular interfaces.
Figure 1. !e visual compositions explored in our studies result from the combination of two types of grid and two icon layouts, on shapes with or without a hole (we show all the shapes without a hole and give an example of two shapes having a hole).
We performed an controlled study looking at visual search where participants had to explore the entire interface to count a number of specific items. Our study shows that grid and icon layout affect exploration time and gaze trajectory: rectangular grids reduce exploration time compared to circular or triangular grids, and certain areas of the interface are looked at earlier under different grid and layout conditions. We also performed a follow-up study to understand if the results would change when participants had to find one item among others, therefore requiring only a partial exploration of the interface content. &is study confirms that rectangular grids favor search time, and reveals that users tend to adopt a different visual strategy when looking for a single item compared to scanning the entire interface.
Our main contribution is an initial exploration of visual search strategies when searching information on non-rectangular interfaces. Our work does not only contribute to the area of free-form displays but can also extend to other research fields dealing with information visualization and mixed reality interfaces, as these also deal with non-rectangular information presentation approaches.
2! RELATED WORK
We present work on search pa%erns on traditional displays and UI design on non-rectangular interfaces.
2.1!Factors Influencing Visual A!ention
When searching for information, we continually make eye movements called saccades. Between saccades, eyes remain still during fixations. &e duration of these fixations is about 200-300ms. Visual information is mainly perceived during fixations [15]. &is is the reason why we also used eye fixations as a measure of visual a%ention. It is accepted that three factors influence fixation locations [4] ,[12]: task (i.e. information need), user memory (i.e.
3.1! Task
Our visual search task involves looking at the entire interface content to find relevant information. In particular, our task consists in counting the number of elements that do not match a target set of images. &is task allows us to observe the gaze path over the entire interface since participants must explore all the content.
3.2! Participants
Twelve participants (6 males, between 19 and 40 years - mean 26) were recruited from a local university. Eleven were students, one a researcher, and all had normal or corrected-to-normal vision.
3.3! Procedure
Participants were instructed to count the number of targets (icons) in each interface as quickly as possible while avoiding mistakes. Each interface contained a set of 14 (for the triangle) or 16 icons (for the circle), which are not strictly equivalent as we are not concerned with comparing among shapes (the study was divided into two independent parts, one for each shape, as detailed below). &e number of icons was motivated by the need to place them on a grid, hence needing an even number. &rough pre-tests we found the optimal number for each shape: if we had studied fewer icons, the task would be trivial, and adding more icons, would make the task too complex and the icons too small.
All the icons represented animals except 2 to 6 targets representing vehicles. &e positions of the targets were randomized for each trial. Participants had to press the keyboard spacebar to display the interface. Once they counted the targets, they pressed the spacebar, which led to a screen on which they had to click on the bu%on corresponding to the number of targets (five choices, from 2 to 6). &ey were given feedback of the correct/incorrect choice and pressed the spacebar to move to the next trial. Each participant completed 48 search trials. Participants took a break mid-way. &e entire session lasted 30 minutes.
Figure 2. Icons from [19] used in our study. Animals represented distractor items, while target items were vehicles.
3.4! Interface content
We used icons, as text presentation affects readability [11],[16]. To avoid any effect of other factors influencing eye movements (such as color or contrast [10]), our interfaces are composed of icons extracted from a standardized set of black-and-white items with similar visual complexity [19]. Over the different semantic categories in the set, we choose icons representing animals, while icons representing vehicles (Figure 2) were used as target(s) to find.
3.5! Display shape
Given the exponential space of possible display shapes to study we choose to limit the scope of our studies by looking at two shapes (circle and triangle), with and without a hole, based on prior work on non-rectangular displays [16],[17]. &ese previous works revealed a broad range of usage contexts, where existing artifacts with non-rectangular features were suggested for display augmentation. Some examples included placing displays on road signs, kitchen cooktops, pocket mirrors, puzzle pieces, bike handles, shoes, drink cans, and electric plugs, among others. &is prior work demonstrated how these layouts are actually likely to be used in the future: the triangular and circular shapes can be found in these scenarios (road signs and pocket mirror displays respectively), as well as the presence of holes on certain displays (see Fig. 1 and Fig. 2 in [16] for an illustration of some of them). &ese specific shapes were also used as study factors in [17], where results in [17] suggest that other shapes (such as trapezoid, pentagon and hexagon) offer similar legibility results as the circle. Using such shapes thus allows us to discuss our results in light of prior findings, focusing on aesthetics and reading performance.
3.6! Grid
&e visual grid indicates how the elements are aligned. Based on prior work [17], we choose two grids: rectangular, or “as-shape”, i.e. adapted to the interface shape (Figure 1): circular on the circle and triangular on the triangle.
3.7! Icon layout
Along with grid, an important composition factor is icon layout [6]. It defines how icons fill the display area. We explored two types of icon layouts: simple and filled (Figure 1). E.g. in the circular grid, icons can be placed along one inner circle (simple layout) or two circles (filled layout).
3.8! Apparatus
We used a Tobii EyeX eye tracker (50Hz) and a 24” LCD monitor (92 dpi, 1920x1080). &e Tobii eye tracker was calibrated for each participant. Participants were seated at a desk, about 75 cm from the screen. &e shapes on the screen corresponded to a 14” display, and the rest of the display was blacked out.
3.9! Experimental Design
&e experiment was composed of two independent parts, carried in the same session, each one corresponding to one display shape (circle and triangle). Each part followed a 2×2×2 within-subjects design with 3 independent variables: Hole (with or without hole), Grid (rectangular or as shape), and Icon layout (simple or filled). For each condition, participants had to perform 5 trials (i.e. browse 5 interfaces). We counterbalanced the order of each part. Within each part, the interfaces were displayed randomly. For each shape (Circle and Triangle), we had 2 holes x 2 grids × 2 icon layouts × 5 repetitions = 40 trials per participant. In total, we collected 40×12=480 trials for the Circle and 480 trials for the Triangle.
3.10!Collected data analysis
section we focus on the main differences between conditions.
3.11!Results
All participants had error rate below 5%, therefore we don’t report it in detail, focusing on time measures.
Exploration time on the Circle
For the Circle shape, results show that on average exploration lasted 6.5 s (CI[6.3, 6.7]) with a hole, and 6.0 s (CI[5.8, 6.2]) without a hole. It took more time to explore the layout with a circular grid (6.3 s, CI[6.1, 6.5]) than with a rectangular grid (5.7 s, CI[5.5, 5.9]).
Exploration time on the Triangle
For the Triangle, we found no difference on exploration time with or without hole. As with the circle, exploring a triangular grid was slower: on average, it took participants 5.8 s (CI[5.5, 6.0]) to explore the layout with a triangular grid, and 5.3 s (CI [5.0, 5.5]) with the rectangular grid.
Mean time to first fixations per areas on the Circle On the circle (Figure 3), the presence of a hole did not seem to have an impact on first fixations. &erefore, we analyzed results with and without holes together.
First, we looked at the order in which participants explore each of the five regions of the interface. We observed a difference between the two grids (rectangular, circular). On rectangular grids, first fixations occur on the top-le' area of the circle (1.9 s, CI[1.6, 2.1]) then on the center (2.4 s, CI[1.8, 3.1]). On circular grids, participants first looked at the center (1.0 s, CI[0.7, 1.3]), before looking at the top-le' area (2.5 s, CI[1.9, 3.0]). Interestingly, on circular grids with simple layout, the bo%om-right area was looked at earlier than the bo%om-le' area, indicating a clockwise circular search path.
Figure 3. Mean time to first fixation (in s) per region on the Circle shape across all participants (biggest circles correspond to latest fixation).
!"# $"% $"% $"% !"# $"& $"& $"' RECTANGULAR GRID AS SHAPE GRID
SIMPLE LAYOUT FILLED LAYOUT ("% )"' #"* '"% )"' )") ("& (") #"& #"* ("& #"$ We recorded the search time and eye movements for each
trial. We also recorded error rates to ensure that the task was performed properly. We analyzed the eye tracking data using the same approach as in [4]: we divided each shape into five regions (top-le', top-right, bo%om-le', bo %om-right and center regions). &is approach limits the impact of tracking error: these regions are sufficiently large that we discarded the data from fixations positioned on the boundaries of these regions.
We then calculated the mean time to the first fixation for each area and display it as in [4]. i.e. steadily gazing in an area with a radius of 50 pixels for at least 100 ms. We also calibrated the tracking device for each participant to increase the tracking accuracy.
Regarding the data analysis, while HCI experiment data is traditionally analyzed by applying null-hypothesis significance testing (NHST), this form of analysis of experimental data has come under increasing criticism within the statistics [6] and HCI communities [7]. We thus chose to rely on estimation techniques with 95% confidence intervals as recommended by the APA [21]. For the reader more used to interpret the p-values, a parallel might be drawn with results obtained through the estimation technique and CIs reports (see Figure 3 in [13]). Given the richness of eye-tracking data, in the results
Figure 4. Mean time to first fixation (in s) per region on the Triangle shape across all participants (biggest circles correspond to latest fixation).
3.12!Summary
Our study reveals that grid and icon layout affect exploration time and gaze trajectory. Our results indicate that rectangular grids reduce exploration time compared to circular or triangular grids. Rectangular grids are generally explored through a traditional trajectory, with first fixations occurring at the top-le'. Instead, grids that follow the circular grid (with a simple layout) are explored with a trajectory starting in the center of the display and following a clockwise circular path. Surprisingly, we could not find the same clockwise pa%ern on the triangular grid with simple layout, which can be a%ributed to the legacy bias of circular interfaces such as watches.
4! FOLLOW-UP STUDY
&e goal of this follow-up study was to understand search time when doing a partial search (i.e. visually searching for a single item) on non-rectangular interfaces.
4.1! Task
&is visual search task involved finding one item only, thus avoiding the need to scan the entire interface (unless the user does not find the item). Besides gaze path, partial search allows us to measure the visual search time for specific items located at different places on the interface.
4.2! Participants
We recruited 12 participants (6 males) aged between 19 and 47 (mean 25.8). All were students, except one researcher, with normal or corrected-to-normal vision, and experienced computer users. 9 of them took part in the study 1, one month earlier.
4.3! Procedure and apparatus
&e task of the second experiment was similar to [8]: it consisted in finding one target icon among a set of icons. We used the same set of icons and apparatus than with study 1: participants had to find a vehicle among a set of animals. Participants had to press the spacebar to start the trial and display the interface. Once they found the target, they pressed the spacebar again (stopping the trial timer), which made the icons disappear, leaving only empty icons (small circles). &ey were then asked to click on the circle corresponding to the target position. &ey were finally given visual feedback informing that they made a correct/incorrect response.
4.4! Experimental Design
&e design, independent factors and counterbalancing were the same as in study 1 (only the task changed). For
RECTANGULAR GRID AS SHAPE GRID
SIMPLE LAYOUT FILLED LAYOUT !"# !"$ #"% # # # # !"& !"# %"$ '"! '"$ '"' %"( '"' %") !"$ '"* '"* '"! %"(
Next, we analyzed the results for each of the five regions of the interface (top-le', top-right, bo%om-le' and bo%om-right). Results did not reveal any difference among factors for the top-right and bo%om-le' regions. For the top-le' area of the interface, the circular grid with simple layout was looked at later than all other conditions (3.0 s, CI[2.4, 3.6] vs. 1.9 s, CI[1.5, 2.2]). Interestingly, for the bo%om-right region, the same condition was looked at earlier than all other conditions (4.0 s, CI[3.6, 4.4] vs. 4.9 s, CI[4.3, 5.5]). &ese are interesting results, since they contradict traditional gaze pa%erns [14]. Finally, for the center region, we also found that circular grid with simple layout was looked at earlier than other conditions (0.6s CI[0.5, 0.7] vs. 2.1s CI[1.5, 2.7]). &is probably indicates that participants fixated the center of the display at the beginning of the trials for this condition.
Mean time to first fixations per areas on the Triangle
On the triangle (Figure 4), we found the same trend across all conditions: participants’ first fixations occur on the top-le' area of the display (1.4 s, CI[1.2, 1.7]), then on the top-right area (2.0 s, CI[1.6, 2.3]) and finally on the bo%om. We found no difference between bo%om-le' and bo%om-right areas for any condition.
Concerning the time of the first fixation for each of the five regions of the interface (top-le', top-right, bo%om-le' and bo%om-right), results did not reveal any difference among factors for the top-right and bo%om-right regions. However, rectangular grids with a simple layout favor rapid fixations on the le': the top-le' was more rapidly seen (1.2 s, CI[1.1, 1.3]) than on triangular grids (1.6 s, CI[1.42, 1.9]); similarly, the bo%om-le' was more rapidly seen (3.4 s, CI[3.2, 3.7]) than on triangular grids (4.1 s, CI[3.7, 4.4]).
4.5! Results
We looked in detail at visual search time for each condition and for each target position. All error rates were below 5%.
Visual sear" time on the Circle
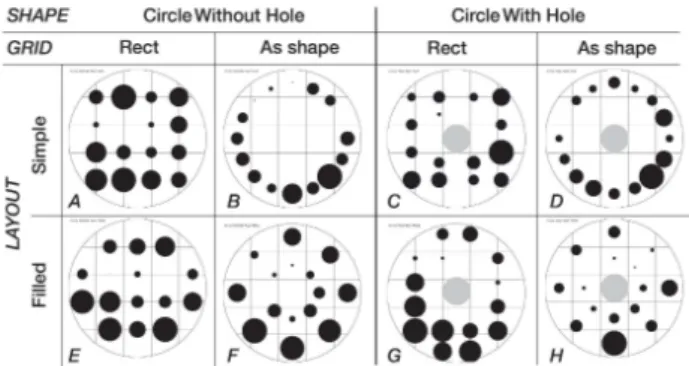
Figure 5. Mean search time per target for the circular conditions (bigger circles correspond to longer time).
Time by target position on the Triangle
On the Triangle, when using a triangular grid, the items that took longer to find were in the bo%om. However, unlike for the circular grid, there was no strong tendency across conditions concerning the position of the longest items to find: it could be at the bo%om-le' (Fig. 6-D), bo%om-center (Fig. 6-H) or bo%om-right (Fig. 6-B).
When using a rectangular grid, we observed the same effect as with the Circle, i.e. some items at the top of the shape took as long to find as those at the bo%om (see Fig 6-C, G or E).
Figure 6. Mean search time per target for triangular conditions (bigger circles correspond to longer time).
4.6! Summary
Our second study shows that, when looking for one single item on an interface, users tend to adopt a different strategy than when scanning the entire interface. Some participants informally indicated that their strategy was to look at the center and get an overview of nearby icons using peripheral vision to find the target. &is would explain the artifacts found on rectangular grids, where some items at the top of the shape took as long to find as those at the bo%om.
the Circle we had 8×16 icons x2 repetitions = 256 trials per participant. For the Triangle, we had 8×14 icons x2 repetitions = 224 trials per participant.
For the Circle shape, results revealed a difference between layouts on completion time: on average exploration lasted 1.7 s (CI[1.62, 1.85]) when the layout was Filled, and 1.92 s (CI[1.81, 2.03]) when Simple. Results did not reveal differences for the different Hole and Grid conditions.
Visual sear" time on the Triangle
For the Triangle shapes, results revealed that both Grid and Icon layout had an impact on completion time. Overall, participants found the target faster on the rectangular grid (1.4 s, CI[1.39, 1.47]) than on the triangular grid (1.6 s, CI[1.59, 1.67]). Contrary to the circle, completion time was shorter with the Simple layout (1.4 s, CI[1.43, 1.54]) than with the Filled layout (1.6 s, CI[1.52, 1.66]).
Time by target position on the Circle
We calculated and visualized the time to find each target for each condition, both on the circle and on the triangle. While overall results are in line with the previous study (i.e. items at the bo%om are longer to find), we found some interesting results on the circular grid: with a simple layout (Figure 5 – B and D), the item that took longer to find (3.5s, CI[1.9, 5.2], vs. 1.8s CI[1.6, 1.8] for all other targets) was positioned on the bo%om-right. &is result contradicts those of study 1, showing that sometimes users adopt different strategies when scanning the entire interface or when looking for a single icon. With a Filled layout, the icons on the inner circle were found earlier (1.5s, CI[1.3, 1.7]) than on the external circle (2.0s, CI[1.7, 2.3]).
On rectangular grids, some of the icons on the top area were as long to find (i.e. around 2s) as those on the bo%om (Figure 5-A or E). One possible explanation is that when participants missed these targets, they needed to scan the entire layout before returning to the top area.
5! DISCUSSION
5.1! Non-rectangular visual search
Our results cast some light on how users search for information on non-rectangular interfaces. &ese results are generally consistent with prior knowledge, such as that fixations are placed to maximize information gain [20]: it is then logical that on circular grids, participants perform a circular search when doing a global exploration; or they start exploring at the display center. &e influence of legacy bias explains that eye movement is clockwise and that first fixations occur on the top-le' area of the interface for some non-rectangular grids (such as triangular grids on triangles).
5.2! Aesthetics preference vs. exploration
rectangular displays occur in public se%ings (e.g. looking at a smartwatch in the street), where looking at the display is a secondary task; therefore, we would like to investigate how limited visual a%ention affects our findings.
7! CONCLUSION
&is paper investigates how display shape, grid and content layout affect the user information search strategies on non-rectangular displays. With two studies, we identified gaze pa%erns and measured visual search time for seeking items on such non-traditional displays. We found that rectangular grids tend to improve performance compared to non-rectangular grids in terms of search time. While gaze pa%erns on regular grids follow common pa%erns, we observed clockwise circular gaze pa%erns on non-rectangular grids. Our studies also measured the time needed to find a specific item on a non-rectangular interface according to its position, providing designers with useful information to optimize such interfaces.
ACKNOWLEDGMENTS
&e authors would like to thank all the study participants for their valuable time. &is work is supported by the French National Research Agency (PERFIN ANR JCJC project, ANR-18-CE33-0009), by the CNRS (PICS n°07635) and by the UK Engineering and Physical Sciences Research Council (EPSRC EP/P004342/1). We also acknowledge support from the CIMI Chair program. REFERENCES
[1]! Daniel Ashbrook, Kent Lyons, and &ad Starner. 2008. An
investigation into round touchscreen wristwatch interaction. In Proceedings of the 10th international conference on Human computer interaction with mobile devices and services (MobileHCI '08). ACM, New York, NY, USA, 311-314.
DOI=h%p://dx.doi.org/10.1145/1409240.1409276
[2]! David Beymer, Peter Z. Orton, and Daniel M. Russell. 2007. An eye
tracking study of how pictures influence online reading. In Proceedings of the 11th IFIP TC 13 international conference on Human-computer interaction - Volume Part II (INTERACT'07). Springer-Verlag, Berlin, Heidelberg, 456-460..
h%ps://doi.org/10.1007/978-3-540-74800-7_41
[3]! Tanja Blascheck, Lonni Besançon, Anastasia Bezerianos, Bongshin
Lee, Petra Isenberg. Glanceable Visualization: Studies of Data Comparison Performance on Smartwatches. IEEE Transactions on Visualization and Computer Graphics, Institute of Electrical and Electronics Engineers, 2019, 25 (1).
[4]! Georg Buscher, Edward Cutrell, and Meredith Ringel Morris. 2009.
What do you see when you're surfing?: using eye tracking to predict salient regions of web pages. In Proceedings of the SIGCHI Conference on Human Factors in Computing Systems (CHI '09).
ACM, New York, NY, USA, 21-30. DOI:
h%ps://doi.org/10.1145/1518701.1518705
[5]! Daniel Co%ing and Markus Gross. 2006. Interactive
environment-aware display bubbles. In Proceedings of the 19th annual ACM
performance
Prior studies exploring non-rectangular interface aesthetics [17] revealed that users prefer grids aligned with the display shape (circular on the circle, triangular on the triangle) as this leads to a more aesthetically pleasant, clear and symmetric interface. Interestingly, our results show that these grids generally slow down visual exploration speed on the circle and the triangle, compared to a rectangular grid.
Prior work also found that placing a menu at the bo%om of a circular display is perceived as nicer, clearer and more symmetric than at the top [17]. However, our results show that this area takes the most time to look at. An implication is that, in a real interface, menus placed at the bo%om need to be visually salient, to help users find items rapidly, especially the first time they are exposed to the interface.
6! LIMITATIONS AND FUTURE WORK
We plan to extend our investigations to different display sizes, interface content and usage contexts. First, our studies focused on a particular display size (the circle/ triangle correspond to a 14” display). Exploring other displays sizes will help generalize our results to smaller (e.g. smartwatches [3]) or larger setups (e.g. public displays). We are also interested to see whether our results generalize to other shapes, e.g. non-symmetrical ones. Secondly, we focused on icons to avoid any visual bias from text while ignoring the nature/aesthetics of the actual content. We would like to carry similar experiments with more complex interfaces, such as web interfaces produced by visual designers for circular or triangular displays [17]. Finally, many use cases for
non-symposium on User interface so'ware and technology (UIST '06). ACM, New York, NY, USA, 245-254.
DOI=h%p://dx.doi.org/10.1145/1166253.1166291
[6]! Geoff Cumming. 2014. &e new statistics: Why and how.
Psychological Science 25, 1 (Jan. 2014), 7–29. DOI:
h%p://dx.doi.org/10.1177/0956797613504966
[7]! Pierre Dragicevic. 2016. Fair statistical communication in HCI. In
Modern Statistical Methods for HCI, Judy Robertson and Maurits Kaptein (Eds.). Springer International Publishing, Cham,
Switzerland, Chapter 13, 291–330. DOI:
h%p://dx.doi.org/10.1007/978-3-319-26633-6_13
[8]! Michael D. Fleetwood and Michael D. Byrne. 2008. Modeling the
visual search of displays: a revised ACT-R model of icon search based on eye-tracking data. Hum.-Comput. Interact. 21, 2 (May 2008), 153-197. DOI=h%p://dx.doi.org/10.1207/s15327051hci2102_1
[9]! Folium Optics. h%p://www.foliumoptics.com (last accessed January
2019)
[10]! Wilbert Galitz. 2007. &e Essential Guide to User Interface Design: An Introduction to GUI Design Principles and Techniques. John Wiley & Sons, Inc., NY, USA.
[11]! Jacek Jankowski, Krystian Samp, Izabela Irzynska, Marek Jozwowicz, and Stefan Decker. 2010. Integrating Text with Video and 3D Graphics: &e Effects of Text Drawing Styles on Text Readability. In Proceedings of the SIGCHI Conference on Human Factors in Computing Systems (CHI '10). ACM, New York, NY, USA, 1321-1330. DOI: h%ps://doi.org/10.1145/1753326.1753524
[12]! David E. Kieras and Anthony J. Hornof. 2014. Towards accurate and practical predictive models of active-vision-based visual search. In Proceedings of the SIGCHI Conference on Human Factors in Computing Systems (CHI '14). ACM, New York, NY, USA, 3875-3884. DOI: h%ps://doi.org/10.1145/2556288.2557324
[13]! Krzywinski, M. and Altman, N. Points of Significance: Error bars. Nature Methods 10, 10 (2013), 921–922.
[14]! Jakob Nielsen (2006). F-Shaped Pa%ern For Reading Web Content.
Retrieved September 18, 2007, from
h%p://www.useit.com/alertbox/reading_pa%ern.html
[15]! Keith Rayner. Eye movements in reading and information processing: 20 years of research. In Psychological Bulletin, 124, 1998, 372-422.
[16]! Marcos Serrano, Anne Roudaut, and Pourang Irani. 2016. Investigating Text Legibility on Non-Rectangular Displays. In Proceedings of the 2016 CHI Conference on Human Factors in Computing Systems (CHI '16). ACM, New York, NY, USA, 498-508. DOI: h%ps://doi.org/10.1145/2858036.2858057
[17]! Marcos Serrano, Anne Roudaut, and Pourang Irani. 2017. Visual Composition of Graphical Elements on Non-Rectangular Displays. In Proceedings of the 2017 CHI Conference on Human Factors in Computing Systems (CHI '17). ACM, New York, NY, USA, 4405-4416. DOI: h%ps://doi.org/10.1145/3025453.3025677.
[18]! Sharp free form display. h%ps://www.sharpsma.com/free-form-display (last accessed Sept 2018)
[19]! Joan G. Snodgrass and Mary Vanderwart. 1980. A standardized set of 260 pictures: norms for name agreement, image agreement, familiarity, and visual complexity. Journal of experimental psychology: Human learning and memory 6, 2: 174.
[20]! Yuan-Chi Tseng and Andrew Howes. 2008. &e adaptation of visual search strategy to expected information gain. In Proceedings of the SIGCHI Conference on Human Factors in Computing Systems (CHI
'08). ACM, New York, NY, USA, 1075-1084. DOI:
h%ps://doi.org/10.1145/1357054.1357221
[21]! VandenBos, G.R., ed. Publication Manual of the American Psychological Association (6th ed.). American Psychological Association, 2009.