Mixing performance in continuous oscillatory baffled reactors
16
0
0
Texte intégral
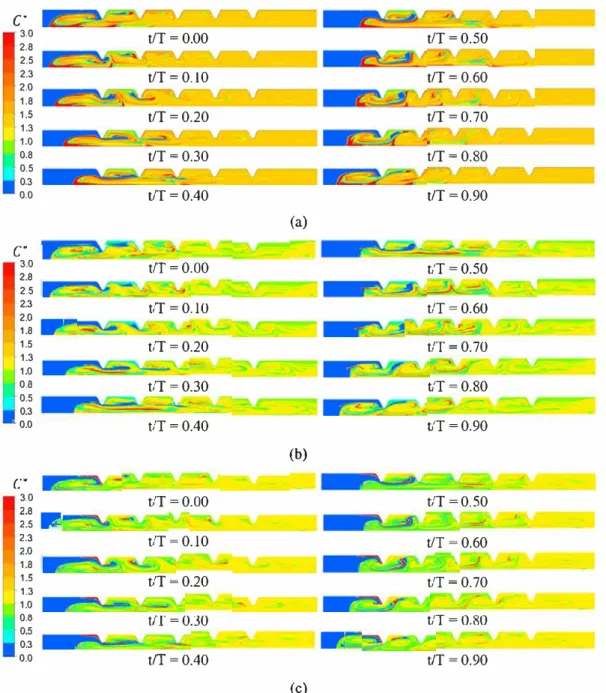
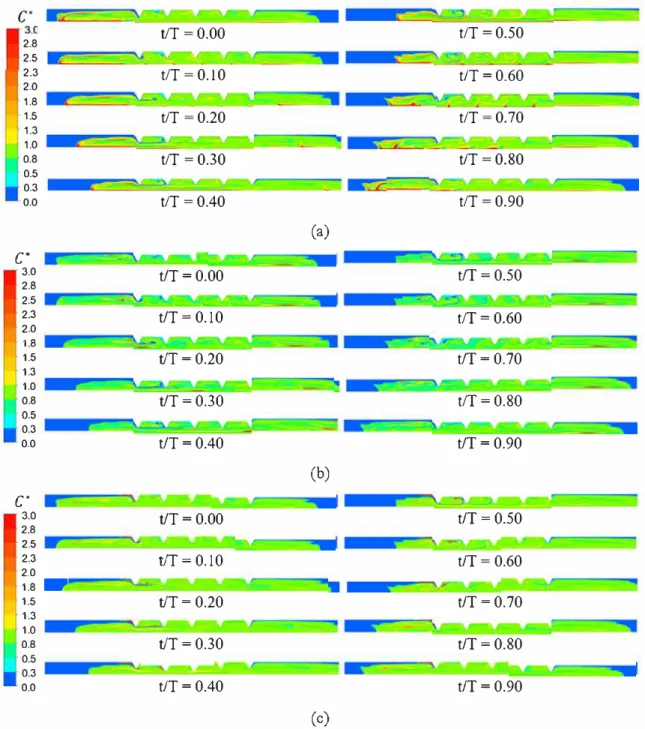
Figure
+7
Documents relatifs