an author's http://oatao.univ-toulouse.fr/23039
https://doi.org/10.1515/polyeng-2018-0131
Sahnoune, Mohamed and Kaci, Mustapha and Taguet, Aurélie and Delbé, Karl and Mouffok, Samir and Abdi, Said and Lopez-Cuesta, José-Marie and Focke, Walter W. Tribological and mechanical properties of polyamide-11/ halloysite nanotube nanocomposites. (2019) Journal of Polymer Engineering, 39 (1). 25-34. ISSN 2191-0340
Mohamed Sahnoune*, Mustapha Kaci, Aurélie Taguet, Karl Delbé, Samir Mouffok, Said Abdi,
José-Marie Lopez-Cuesta and Walter W. Focke
Tribological and mechanical properties
of polyamide-11/halloysite nanotube
nanocomposites
Abstract: This article reports some morphological,
tri-bological, and mechanical data on polyamide-11(PA11)/halloysite nanotube (HNT) nanocomposites prepared by melt-compounding. HNTs extracted from the Djebel Deb-bagh deposit in Algeria were incorporated into the polymer at 1, 3, and 5 wt%. For comparison, commercial HNTs were also used under the same processing conditions. Scan-ning electron microscopy showed that both HNTs were homogeneously dispersed in the PA11 matrix, despite the presence of few aggregates, in particular at higher filler contents. The tribological properties were significantly improved, resulting in a decrease in the friction coefficient and the wear rate characteristics due to the lubricating effect of HNTs. This is consistent with optical profilometry data, which evidenced the impact of both types of HNTs on the surface topography of the nanocomposite samples, in which the main wear process was plastic deforma-tion. Furthermore, Young’s modulus and tensile strength were observed to increase with the filler content, but to the detriment of elongation at break and impact strength. Regarding the whole data, the raw Algerian halloysite led
*Corresponding author: Mohamed Sahnoune, Laboratoire des
Matériaux Polymères Avancés (LMPA), Université de Bejaia, Bejaia 06000, Algeria; and Centre des Matériaux des Mines d’Alès (C2MA), IMT Mines d’Alès, 6 avenue de Clavières, 30319 Alès cedex, Alès, France, e-mail: sahnoune_mohamed@yahoo.fr
Mustapha Kaci: Laboratoire des Matériaux Polymères Avancés
(LMPA), Université de Bejaia, Bejaia 06000, Algeria
Aurélie Taguet and José-Marie Lopez-Cuesta: Centre des Matériaux
des Mines d’Alès (C2MA), IMT Mines d’Alès, 6 avenue de Clavières, 30319 Alès cedex, France
Karl Delbé: Laboratoire de Génie Production (LGP), ENIT-INPT,
Université de Toulouse, 47, Avenue d’Azereix, Tarbes, France
Samir Mouffok and Said Abdi: Laboratoire des Sciences et Génie
des Matériaux, Faculté de Génie Mécanique et Génie des Procédés, USTHB, Alger, Algeria
Walter W. Focke: Institute of Applied Materials, University of
Pretoria, Private Bag X20, Hatfield 0028, Pretoria, South Africa
to interesting results in PA11 nanocomposites, thus reveal-ing its potential in polymer engineerreveal-ing nanotechnology.
Keywords: halloysite; mechanical properties; optical
pro-filometry; polyamide-11; tribology.
1 Introduction
Polyamide-11 (PA11) is a versatile thermoplastic polymer exhibiting excellent characteristics in terms of chemical resistance, thermal stability, as well as piezoelectric and ferroelectric properties [1]. Moreover, PA11 is biocompat-ible and has the advantage of being less hydrophilic than the commonly used polyamide-6 and polyamide-6,6 [2, 3]. However, PA11 has poor wear resistance [4], which limits its widespread applications in many fields includ-ing the offshore and automotive industry for which the wear properties are the most important tribological char-acteristics [5–7]. According to the literature [4, 8–14], one of the most efficient methods to improve the tribological properties of polyamides consists in incorporating a small amount of nanofillers into the polymer matrix. This often leads to an improvement in the tribological properties of the nanocomposite materials due probably to the high contact surface area of the nanoparticles, which develop more interactions with the polymer matrix [15]. Moreover, since the nanoparticles are of the same size scale as the counterface asperities, they may polish the asperities and promote the development of tribologically favorable transfer films that protect the nanocomposite material from direct asperity contact and damage [16].
In the last decade, halloysite nanotubes (HNTs), which belong to the kaolin group, have attracted signifi-cant attention as a new type of clay nanofillers for polymer nanocomposites compared to the most commonly used ones, i.e. layered silicates and carbon nanotubes (CNTs) [17]. Indeed, HNTs have higher intrinsic stiffness com-pared to the montmorillonite clay [18, 19]. They are cheap, naturally available, and biocompatible [20]. HNTs do not require exfoliation because of their unique tubular
structure and contain a few hydroxyl groups on the outer surface. Various polymer nanocomposites reinforced with HNTs have been investigated in thermoplastics [18, 21–25], thermosets [26–29], and elastomers [30, 31]. As a result, Young’s modulus, tensile strength, thermal stability, and fire-retardant properties are often improved. Recently, the Algerian HNTs were successfully tested as a reinforcing agent and a compatibilizer in some polymer blends such as PA11/PS [32], PA11/SEBS-g-MA [33], and PHBV/PBS [34]. On the other hand, on PA11/HNT nanocomposites, there are few publications [1, 35, 36] and even fewer on the tribological properties. Indeed, despite the potential of halloysite in the tribology area to become an attrac-tive candidate as an environment-friendly lubricant addi-tive, there is rather limited literature on the use of HNTs to improve the tribological properties of materials [37, 38] and none on thermoplastic matrices. Results from the pre-vious studies have shown the positive role of halloysite on the tribological properties through increased wear resist-ance and reduced surface roughness of the materials.
Therefore, the objective of this paper is to study (for the first time) the tribological behavior as well as the mor-phological and mechanical properties of PA11 nanocom-posites reinforced with raw Algerian HNTs prepared by melt-compounding. The effect of the HNT content on the material properties was evaluated at 1, 3, and 5 wt% using scanning electron microscopy (SEM), tribological meas-urements, optical profilometry, and tensile and Charpy impact tests. The results were compared with those obtained on both PA11/commercial HNT nanocomposites and neat PA11.
2 Materials and methods
2.1 Materials
PA11 (Rilsan® LMNO) was supplied by Arkema (France). According to the manufacturer, this grade is free of addi-tives. The polymer has the following specifications:
M̅w ≈ 51,000 g mol−1 and d = 1.02 g cm−3. The raw Algerian halloysite nanotubes (referred to as HNT A) were extracted from Djebel Debbagh deposit in Guelma (Algeria). The filler particles have an average diameter of 25 μm and a surface area of 51.4 m2 g−1. Further details on the physical charac-teristics are reported in a previous paper [34]. Commercial halloysite nanotubes (referred to as HNT C) were purchased from Sigma Aldrich (France) and the main characteristics are as follows: outer diameter = 30–70 nm, length = 1.3 μm, density = 2.53 g cm−3, surface area = 64 m2 g−1, and cation
exchange capacity (CEC) = 8 meq g−1. Prior to processing, both HNTs and PA11 were dried under vacuum at 80°C for 24 h and overnight, respectively, to remove traces of moisture.
2.2 Sample preparation
Various PA11/HNT samples filled at 1, 3, and 5 wt% were prepared by melt-compounding under vacuum in a semi-industrial twin-screw extruder (BC 21 Clextral) having a screw diameter (Φ) = 25 mm and length to diameter ratio (L/Φ) = 48 at a screw speed of 250 rpm according to the compositions reported in Table 1. The temperature profile was set at 140/230/235/245/250°C from the hopper to the die. After pelletizing, the granules were dried under vacuum at 80°C overnight and then injection-molded into standard test specimens for tribological and mechanical tests using an injection-molding machine (KM50-180X; Krauss Maffei). The temperature profile ranged from 220 to 225°C, and the mold temperature was kept at 40°C. The holding pressure and screw rotation speed were 135 bar and 100 rpm, respectively, while the throughput was 50 cm3 s−1.
2.3 Characterization techniques
2.3.1 Scanning electron microscopy (SEM)
SEM was conducted under high vacuum with an environ-mental SEM machine (Quanta 200 FEG; FEI Company) operating at 12.5 kV. SEM was used to evaluate the degree of dispersion of HNTs in the PA11 matrix. The specimens obtained by injection molding were cryo-fractured and coated with a thin carbon layer, and the fractured surfaces were observed in the backscattered electron (BSE) mode. Moreover, the fractured surfaces of the samples after the Charpy test, as well as the worn surfaces after being sput-ter-coated with a silver/gold film, were also observed.
Table 1: Codes and composition of the samples.
Sample PA11 (wt%) HNT A (wt%) HNT C (wt%) PA11 100 0 0 PA11/H1 99 1 0 PA11/H3 97 3 0 PA11/H5 95 5 0 PA11/HC1 99 0 1 PA11/HC3 97 0 3 PA11/HC5 95 0 5
2.3.2 Tribological measurements
Tribological tests were carried out on a CSM pin-on-disk tribometer (CSM Instruments SA, Switzerland) according to ASTM G99-05 standard procedure. A spherical-ended pin was placed in contact with the sample surface (disk) under a predetermined load, which generated the fric-tion force. A 6-mm-diameter hardened steel ball was used as the counter body. All the sliding tests were performed under ambient conditions with a normal load of 10 N at a sliding speed of 0.3 m s−1 and a sliding distance of 800 m. The wear track radius considered was 6 mm. Before the test, the surface roughness of the samples (Ra) was deter-mined using a piezoelectric-transducer roughness meter (TR100). The surfaces were cleaned and thoroughly dried to remove all dirt and foreign matter.
During sliding, the friction coefficient was continu-ously measured and recorded in real time by the tribom-eter computer software (TriboX) and the average value was taken. The average values of the friction coefficient in the test range were used as the friction coefficient of the samples [39]. The wear rate (W) (mm3 N−1 m−1) of each specimen was calculated using Eq. (1):
disk/ s
W V= FD (1)
where F is the load used, Ds is the sliding distance, and
Vdisk is the disk volume loss, which is given by 2 1 2 2 1/2 disk 2 sin 2d d4 (4 ) V R r r d r π − = − − (2)
where R is the wear track radius, d is the wear track width, and r is the pin end radius.
At least four measurements were made for each sample at different representative locations in the track and the average values were reported.
2.3.3 Optical profilometry
The topography and surface profiles before and after the tribological measurements were determined using a 3D optical profilometer (Wyko NT1100, Veeco) in the VSI (ver-tical shift interference) mode on sample disks of 25 mm diameter and 4 mm thickness. Analyses in optical pro-filometry were carried out on the “skin” of the sample, i.e. on an area that was not affected by the tribological test. For this analysis, the mean skewness Ssk and kurtosis Sku were measured.
The volume parameters were measured on the track after the tribological tests. The wear volume Vw, which is
the difference between the missing volume V– (volume below the reference surface defined by the undamaged surface) and the displaced volume V+ (volume of material above the reference surface), was determined [40]. The wear volume indicates whether there was a loss (Vw > 0) or transfer of material (Vw < 0) from the pin to the sample. The damage volume Vd, which is the sum of the absolute values of V– and V+, was also determined.
Each number displayed is the average of five skin measurements and four track measurements made at least at four different locations on the same sample.
2.3.4 Tensile test
Stress–strain analysis was carried out on ISO 527-2 IA type tensile bars according to ISO 527 standard test proce-dure. Young’s modulus was accurately measured using a clip-on extensometer (Zwick Roell) at a cross-head speed of 1 mm min−1, whereas the yield strength and elongation at break were determined at a speed of 20 mm min−1. The measurements were carried out with a tensile machine (Zwick Z010; Zwick Roell) under environmental condi-tions. Prior to testing, the samples were stored at 23°C and 50% RH for 10 days, according to ISO 527 standard. At least 10 specimens of each formulation were tested and the average values were reported.
2.3.5 Charpy impact
Notched Charpy impact strength of the samples was deter-mined using a pendulum impact tester (Zwick 5102; Zwick Roell) according to ISO 179 standard test procedure. The notched specimens had the dimensions of 80 × 10 × 4 mm3 and a depth notch of 2.0 mm. Prior to testing, all speci-mens were stored as dry as molded at 23°C and 0% RH for 10 days. At least 10 specimens of each formulation were tested and the average values were reported.
3 Results and discussion
3.1 Morphology
SEM micrographs of fracture surface of the different PA11/HNT nanocomposite samples are shown in Figure 1. In detail, Figure 1A,C, and E is related to the nanocom-posite samples filled with HNT A at 1, 3, and 5 wt%, respectively, while Figure 1B,D, and F corresponds to the
nanocomposite samples filled with HNT C at 1, 3, and 5 wt%, respectively. Figure 1A and B shows similar mor-phology, characterized by a homogeneous and uniform
dispersion of both HNTs in the PA11 matrix, most of the nanotubes being dispersed at the nanoscale. This may be due to the good affinity between PA11 and the HNTs.
A B
D
F E
C
Figure 1: SEM micrographs of fractured surfaces of the PA11/HNT samples. (A) PA11/H1, (B) PA11/HC1, (C) PA11/H3, (D) PA11/HC3,
However, a few aggregates are observed on the fracture surface of the PA11 nanocomposites, whose number and size increased with the filler content, as illustrated in Figure 1C and D. In Figure 1E and F, it is clearly observed that at 5 wt%, the mixing process intensity was insuffi-cient to break up entirely the HNT aggregates (~15 μm), which corresponded to micrometer-sized particles result-ing from the comminution process of HNTs.
3.2 Tribological properties
The surface roughness values (Ra) of neat PA11 and PA11/ HNT nanocomposites measured before the sliding test are reported in Table 2. Accordingly, the results range between 0.26 and 0.35 μm, which is 56% below the recommended maximum surface roughness value of 0.8 μm (ASTM G99-05 standard procedure). These results also indicate clearly the suitability of the melt-compounding process and the parameters in the preparation of the nanocom-posite samples, suggesting good interaction between HNTs and PA11 and, therefore, the good adherence of the filler particles to the polymer matrix.
One of the most important tribological properties of materials is the friction coefficient [15]. In this regard, Figure 2A and B shows the changes in the friction coef-ficient as a function of the sliding distance for the neat PA11 and PA11 nanocomposite samples filled with HNT A and HNT C, respectively. All curves exhibit two stages, i.e. the initial state and the steady state. A similar trend was observed for PA6 filled with organomodified mont-morillonite [8]. In the initial stage, the friction coefficient increases from a static value to the highest one, charac-terizing the initial step of the friction process. This step is also called the running-in period and corresponds to a maximum sliding distance of approximately 70 m. Beyond this value, corresponding to the second stage,
Table 2: Surface roughness (Ra), average friction coefficient (μ),
and wear rate (W) of neat PA11 and PA11/HNT nanocomposites.
Sample Surface roughness (Ra) (μm) Average friction coefficient (μ) Wear rate (W) (×10 − 5 mm3 N− 1 m − 1) PA11 0.32 0.43 ± 0.02 8.6 ± 0.68 PA11/H1 0.28 0.39 ± 0.02 5.7 ± 0.5 PA11/H3 0.3 0.35 ± 0.03 4.4 ± 0.32 PA11/H5 0.35 0.35 ± 0.02 4.6 ± 0.36 PA11/HC1 0.32 0.40 ± 0.02 6.5 ± 0.0.6 PA11/HC3 0.26 0.37 ± 0.02 5.3 ± 0.3 PA11/HC5 0.31 0.39 ± 0.02 5.6 ± 0.35
Figure 2: Evolution of the friction coefficient (μ) of the samples
as a function of the sliding distance for neat PA11 and PA11 nanocomposites filled with (A) HNT A and (B) HNT C at various filler content ratios.
the friction coefficient remains almost unchanged along the sliding distance. According to the data reported in Table 2, the addition of HNTs decreases slightly the friction coefficient of PA11 nanocomposites, with a maximum at the filler content of 3 wt%. Indeed for PA11/ HNT A nanocomposites, the values of friction coefficient are reduced by about 9% at 1 wt%, while at 3 and 5 wt% the decrease is almost 19% compared to the neat PA11. A similar trend is also observed for PA11/HNT C nanocom-posites, albeit less pronounced than the samples filled with HNT A. For comparison, it has been reported [13] that the friction coefficient of PA6 filled with multiwalled CNTs decreased from 0.11 to 0.07 with increased filler content from 3 to 10 wt%, whereas the incorporation of 5 wt% of organoclay in PA66 induced a decrease by only 11% compared to the neat polymer [12], thus highlighting the lubricating effect of halloysite on the friction coef-ficient of PA11.
The improved tribological properties of the PA11/ HNT nanocomposites were also investigated through the determination of the wear rate (W). Any enhance-ment in the tribological properties requires a reduc-tion in the wear rate. The main results are summarized in Table 2. From the table, it is clear that the addition of HNTs decreases significantly the wear rate of PA11 nano-composite, especially at 3 wt%. Indeed, the W value of PA11 is initially 8.6 × 10⁻⁵ mm3 N−1 m−1 and, upon addition of 1 and 3 wt% HNT A to PA11, W decreases to 5.7 × 10⁻⁵ and 4.4 × 10⁻⁵ mm3 N−1 m−1, representing almost 34% and 49% decrease from the initial value of PA11, respectively. At 5 wt%, although the W value of the nanocomposite sample is slightly higher, it still remains below that of the neat polymer. For the nanocomposite samples filled with the commercial HNTs (HNT C), a similar trend is noticed; however, the decrease in the W values is less pronounced than that of PA11/HNT A nanocomposites. Similar results have also been reported in literature on other polyamide
systems [12, 14, 41]. For example, the incorporation of 5 wt% of organoclay in PA66 caused a drop of the wear rate by 40% compared to that of the neat polymer [12].
According to the literature [8, 9, 39, 42, 43], the wear rate decrease is interpreted as a result of the formation of a tenacious transfer layer on the counter face by the clay nanoparticles, which protects the composite surface from direct contact with the counter face, reducing thereby the friction and wear of the nanocomposite samples. In the case of the phenomenon observed at 5 wt%, it might be due to the formation of HNT agglomerates, as shown in Figure 1E and F. The material peels off more easily during the sliding process [44].
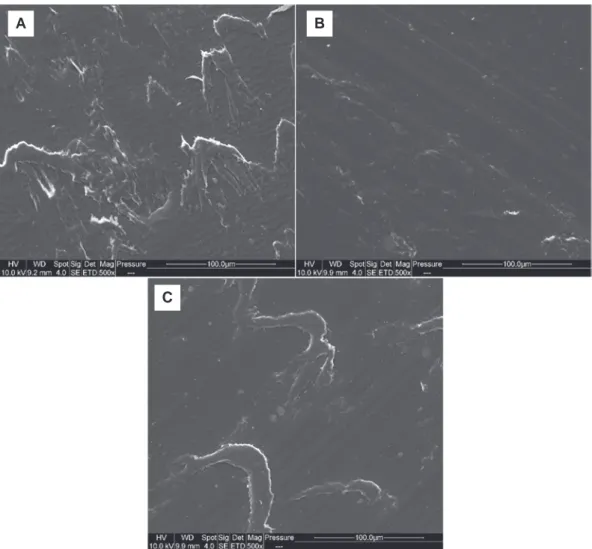
As is known, the wear mechanisms of polymeric materials can involve both adhesive and plastic defor-mation processes [45]. This can be determined using the morphologies of the worn samples. Figure 3 shows the worn surfaces of neat PA11 and those of PA11/H5 and PA11/HC5 nanocomposites. From Figure 3A, it is observed
A B
C
Figure 3: SEM micrographs of the worn surfaces during testing under a load of 10 N and at a sliding speed of 0.3 m/s of (A) PA11,
that the matrix has a rough surface, which is signifi-cantly damaged with the presence of lumps. This result suggests that the wear process depends on both plastic deformation and the adhesive wear mechanism [10]. On the other hand, the PA11/H5 sample (Figure 3B) exhibits a reduction in the shearing surface. Indeed, a smoother surface is observed with a reduced accumulation of the wear particles. For the nanocomposite sample filled with HNT C, i.e. PA11/HC5 (see Figure 3C), the worn surface reveals traces of shallow micro-cutting and wear-particle
accumulation. This is due probably to the presence of an excessive amount of clay particles in the sample (5 wt%), causing a tilting of the adhesive wear toward abrasive wear and impacting the shear deformation of the nanocomposite surface. These observations are in agreement with the tribological data (Table 2), empha-sizing the lubricating role of HNTs through the decrease of both the friction coefficient and wear rate of the PA11 nanocomposites.
3.3 Optical profilometry
The optical profilometry allows qualitative and quantita-tive characterization of a surface. In this respect, topo-graphical images were recorded from the undamaged (Figure 4) and track (Figure 5) surfaces for both the neat PA11 and PA11/HNTs nanocomposite samples filled at
Figure 4: Three-dimensional images of (A) PA11, (B) PA11/H5, and
5 wt.%. From Figure 4A, which is relative to PA11, an irreg-ular surface with many peaks and crevices is observed. A similar surface topography is also noticed in the PA11 nanocomposite samples at 5 wt% for both HNTs (see Figure 4B for PA11/H5 and Figure 4C for PA11/HC5). This seems to be consistent with the surface roughness (Ra) values provided in Table 2.
A quantitative analysis of the topography images allows the determination of the values of Ssk and Sku, which are reported in Table 3. These parameters give a more precise view on the sample’s morphology. Indeed,
Ssk indicates whether the surface profile is full (Ssk < 0)
or hollow (Ssk > 0). For our samples, all the Ssk values are positive, indicating a hollow surface profile. Nevertheless, for PA11/HC5, the value is close to 0, indicating a more flat surface. The Sku data tell us whether the profile is wide (Sku < 3) or narrow (Sku > 3), which in our case with PA11/ HC5 being the latter.
Figure 5A–C shows the three-dimensional images of the sample damages related to the track surfaces for the neat PA11 and PA11 nanocomposites at 5 wt%, and the measured values of Vw and Vd are shown in Table 3. From the data, it is observed that the Vd values, which are nearly the same for all the compositions, are largely superior to the Vw values, showing that the main wear process is plastic deformation. The wear volume of all the samples is rather small, with positive values for PA11 and PA11/HC5, revealing the presence of furrows on the track after the tribological test. The value of Vw of PA11/H5 is negative, meaning the presence of displaced material on the track,
which can be caused by some dilatation of the material due to water absorption or by degradation of the counter-part during tribological measurements.
3.4 Mechanical properties
The effect of HNTs on the mechanical properties of PA11 nanocomposites was evaluated at the filler contents of 1, 3, and 5 wt%, and the main results are summarized in Table 4. From the table, it is seen that the incorporation of HNTs in the PA11 nanocomposites results in an improve-ment in both Young’s modulus and tensile strength, whereas the elongation at break and impact strength show a reduction depending on the composition. Indeed, at 3 wt% of HNT A, the value of Young’s modulus of the PA11 nanocomposite increases by approximately 16% compared to that of neat PA11. This increase reaches almost 24% at 5 wt%. Furthermore, the tensile strength of the whole nanocomposite samples exhibits higher values than that of the neat polymer irrespective of the type and content ratio of HNTs, the maximum being reached for PA11/H1. This feature can be explained by the better dis-persion of the HNTs in the PA11 matrix at 1 wt% [9]. On the other hand, a regular decrease in both elongation at break and impact strength is noticed, which is more pronounced at the filler content of 5 wt%. Indeed, the elongation at break of PA11/H5 decreases by 58% compared to that of neat PA11, while its impact strength is reduced by 34%. A similar trend is also observed with HNT C. As an example, the value of Young’s modulus for PA11/HC5 increases by 20%, while its impact strength decreases by almost 44% compared to that of neat PA11. All these results are con-sistent with those reported in the literature [1, 18, 46–48], which are attributed to the reinforcing effect of the clay filler. The enhancement of the tensile strength of the PA11 nanocomposite samples could be due to the intrinsic stiffness of the individually dispersed halloysite nano-tubes [18] and also to some affinity between PA11 and
Table 3: Values of Ssk, Sku, Vw, and Vd of neat PA11, PA11/H5, and
PA11/HC5 samples.
Samples Ssk Sku Vw (×10 − 4 mm3) Vd (×10 − 2 mm3)
PA11 0.29 ± 0.07 3.63 ± 0.6 2.85 ± 0.1 1.1 ± 0.1 PA11/H5 0.32 ± 0.09 4.1 ± 0.8 –2.28 ± 0.3 1.2 ± 0.1 PA11/HC5 0.03 ± 0.08 5.82 ± 0.6 1.12 ± 0.2 1.2 ± 0.1
Table 4: Values of Young’s modulus, tensile strength, elongation at break, and impact strength of neat PA11 and PA11/HNT nanocomposite
samples.
Samples Young’s modulus (MPa) Tensile strength (MPa) Elongation at break (%) Impact strength (kJ m − 2)
PA11 1220 ± 25 41 ± 0.3 228.1 ± 10.2 5.5 ± 0.2 PA11/H1 1390 ± 55 44.6 ± 0.3 160.8 ± 15.6 3.8 ± 0.4 PA11/H3 1411 ± 32 43.8 ± 0.3 115 ± 27 3.9 ± 0.2 PA11/H5 1511 ± 75 44.6 ± 0.3 94.2 ± 15.6 3.6 ± 0.2 PA11/HC1 1348 ± 48 43.6 ± 0.9 224.6 ± 60.5 4.3 ± 0.7 PA11/HC3 1411 ± 35 43.9 ± 0.7 129 ± 53.8 3.2 ± 0.4 PA11/HC5 1463 ± 55 43.5 ± 0.3 100.6 ± 38.4 3.1 ± 0.6
HNTs. Regarding the toughness property, HNTs can play a double role. In the first instance, HNTs can enhance the toughness via a crack-bridging effect [18, 46], while hal-loysite aggregates can also cause stress concentrations in the sample, increasing its brittleness.
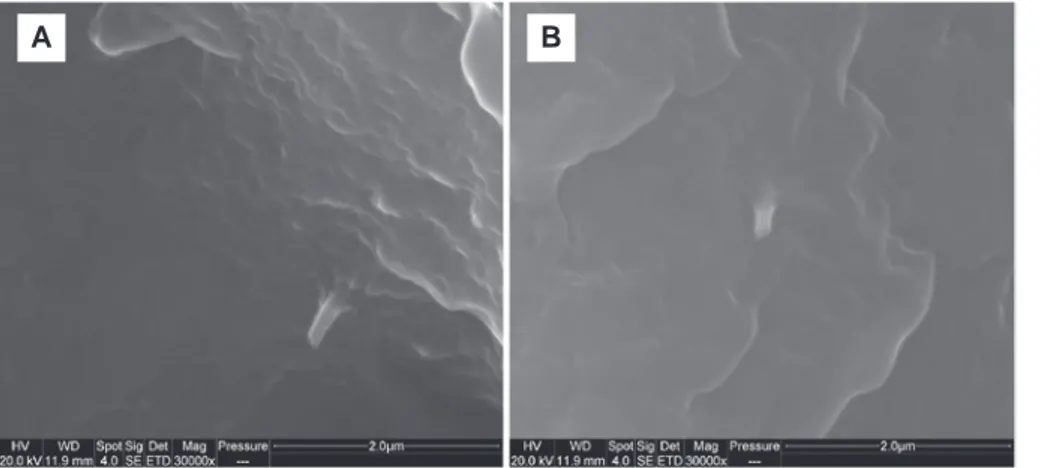
In order to gain a better understanding of the mechan-ical behavior effect of halloysite on PA11, SEM micro-graphs of the fractured surface of PA11 loaded at 5 wt% with both HNT A and HNT C are shown in Figure 6A and B, respectively, after performing the notched Charpy impact test. Both figures show good interfacial adhesion between the HNTs and the PA11 matrix. Moreover, most of HNT particles are well embedded in the polymer matrix, even though some pulled-out nanotubes are still observed.
4 Conclusions
This article focused on the use of the raw HNT A as a nano-filler in the PA11 matrix in order to improve the tribologi-cal and mechanitribologi-cal performance of the nanocomposite materials. The performance of PA11/HNT A nanocompos-ites prepared by melt-mixing at various filler contents was investigated on the basis of PA11 nanocomposites reinforced with commercial HNT C used under the same experimental conditions. For both HNTs, SEM analysis of the PA11/HNT nanocomposites showed a regular morphol-ogy, as evidenced by a fine and homogeneous dispersion of HNTs in PA11, although some aggregates were visible at 5 wt%. Further, the addition of HNTs to PA11 improved the tribological properties by reducing both the friction coef-ficient and wear rate parameters of the nanocomposite samples, which, however, were more pronounced for those filled with the raw HNT A. Optical profilometry confirmed the tribological results as wear volume changes after
halloysite incorporation, with plastic deformation as the main wear process. The mechanical data indicated a rein-forcement effect of HNTs in PA11 nanocomposites, though with a relative loss of toughness. Accordingly, the addition of HNTs to PA11 seems to be an efficient route to the prepa-ration of nanocomposite materials of higher mechanical and tribological performance. Therefore, HNTs with their tubular structure, biocompatibility, low cost, and unique surface chemistry can become a green alternative to the most common used lubricating agents in polymer nano-composites. Furthermore, the raw Algerian halloysite provided better results compared with the commercial ones, revealing its capacity to improve the tribological and mechanical properties of PA11 without any prior treatment.
Acknowledgments: The authors are grateful to EGIDE for
financially supporting this work through the Tassili pro-gram 13MDU891, Funder Id: 10.13039/501100008446 and to Jean-Jacques Flat from Arkema and the Algerian Com-pany SOALKA for supplying the PA11 resin and the raw Algerian halloysite, respectively.
Conflict of interest statement: The authors declare no
conflicts of interest regarding this article.
References
[1] Hao A, Wong I, Wu H, Lisco B, Ong B, Sallean A, Butler S, Londa M, Koo JH. J. Mater. Sci. 2015, 50, 157–167.
[2] He X, Yang J, Zhu L, Wang B, Sun G, Lv P, Phang IY, Liu T. J. Appl. Polym. Sci. 2006, 102, 542–549.
[3] Liu T, Lim KP, Tjiu WC, Pramoda KP, Chen ZK. Polymer 2003, 44, 3529–3535.
[4] Ambrósio JD, Balarim CVM, de Carvalho GB. Polym. Compos. 2016, 37, 1415–1424.
B A
[5] Unal H, Kurt M, Mimaroglu A. J. Polym. Eng. 2012, 32, 201–206. [6] Giraldo LF, López BL, Brostow W. Polym. Eng. Sci. 2009, 49,
896–902.
[7] Unal H, Hakan Yetgin S, Findik F. Ind. Lubr. Tribol. 2014, 66, 498–504.
[8] Srinath G, Gnanamoorthy R. J. Mater. Sci. 2005, 40, 2897–2901. [9] Dasari A, Yu ZZ, Mai YW, Hu GH, Varlet J. Compos. Sci. Technol.
2005, 65, 2314–2328.
[10] Li Y, Ma Y, Xie B, Cao S, Wu Z. Wear 2007, 262, 1232–1238. [11] Sumithra H, Sidda Reddy B. J. Reinf. Plast. Compos. 2018, 37,
349–353.
[12] Mu B, Wang Q, Wang T, Wang H, Jian L. Polym. Eng. Sci. 2008, 48, 203–209.
[13] Khun NW, Cheng HKF, Li L, Liu E. J. Polym. Eng. 2015, 35, 367–376.
[14] Findik F. Mater. Des. 2014, 57, 218–244.
[15] Burris DL, Boesl B, Bourne GR, Sawyer WG. Macromol. Mater. Eng. 2007, 292, 387–402.
[16] Bahadur S. Wear 2000, 245, 92–99.
[17] Liu M, Jia Z, Jia D, Zhou C. Prog. Polym. Sci. 2014, 39, 1498–1525. [18] Hedicke-Höchstötter K, Lim GT, Altstädt V. Compos. Sci.
Tech-nol. 2009, 69, 330–334.
[19] Du M, Guo B, Jia D. Polym. Int. 2010, 59, 574–582.
[20] Lvov Y, Abdullayev E. Prog. Polym. Sci. 2013, 38, 1690–1719. [21] Fujii K, Nakagaito AN, Takagi H, Yonekura D. Compos. Interfaces
2014, 21, 319–327.
[22] Liu M, Zhang Y, Wu C, Xiong S, Zhou C. Int. J. Biol. Macromol. 2012, 51, 566–575.
[23] Gaaz TS, Sulong A, Kadhum AAH, Nassir MH, Al-Amiery AA. Appl. Sci. 2017, 7, 291.
[24] Gaaz TS, Kadhum AAH, Michael PKA, Al-Amiery AA, Sulong A, Nassir MH, Jaaz A. Polymers. 2017, 9, 207.
[25] Gaaz TS, Luaibi HM, Al-Amiery AA, Kadhum AAH. Results Phys. 2018, 9, 33–38.
[26] Liu C, Luo Y, Jia Z, Li L, Guo B, Jia D. J. Macromol. Sci. Part B 2012, 51, 968–981.
[27] Ye Y, Chen H, Wu J, Ye L. Polymer 2007, 48, 6426–6433. [28] Albdiry MTT, Yousif BFF. Mater. Des. 2013, 48, 68–76. [29] Vahedi V, Pasbakhsh P. Polym. Test. 2014, 39, 101–114. [30] Ismail H, Pasbakhsh P, Fauzi MNA, Abu Bakar A. Polym. Test.
2008, 27, 841–850.
[31] Ismail H, Salleh SZ, Ahmad Z. Mater. Des. 2013, 50, 790–797. [32] Sahnoune M, Taguet A, Otazaghine B, Kaci M, Lopez-Cuesta JM.
Polym. Int. 2017, 66, 300–312.
[33] Sahnoune M, Taguet A, Otazaghine B, Kaci M, Lopez-Cuesta JM. Eur. Polym. J. 2017, 90, 418–430.
[34] Kennouche S, Le Moigne N, Kaci M, Quantin JC, Caro-Bretelle AS, Delaite C, Lopez-Cuesta JM. Eur. Polym. J. 2016, 75, 142–162.
[35] Prashantha K, Lacrampe MF, Krawczak P. J. Appl. Polym. Sci. 2013, 130, 313–321.
[36] Rashmi BJ. Express Polym. Lett. 2015, 9, 721–735.
[37] Song K, Rubner MF, Cohen RE, Askar KA. MRS Adv. 2017, 2, 27–32.
[38] Peña-Parás L, Maldonado-Cortés D, García P, Irigoyen M, Taha-Tijerina J, Guerra J. Wear 2017, 376–377, 885–892.
[39] You YL, Li DX, Si GJ, Deng X. Wear 2014, 311, 57–64. [40] Delbé K, Orozco Gomez S, Carrillo Mancuso JM, Paris JY,
Denape J. Key Eng. Mater. 2012, 498, 89–101. [41] Unal H, Findik F. Ind. Lubr. Tribol. 2008, 60, 195–200. [42] Srinath G, Gnanamoorthy R. Compos. Sci. Technol. 2007, 67,
399–405.
[43] Sun LH, Yang ZG, Li XH. Polym. Eng. Sci. 2008, 48, 1824–1832.
[44] Cai H, Yan F, Xue Q, Liu W. Polym. Test. 2003, 22, 875–882. [45] Demir Z. J. Polym. Eng. 2009, 29, 549–562.
[46] Prashantha K, Schmitt H, Lacrampe MF, Krawczak P. Compos. Sci. Technol. 2011, 71, 1859–1866.
[47] Handge UA, Hedicke-Höchstötter K, Altstädt V. Polymer 2010, 51, 2690–2699.
[48] Sharif NFA, Mohamad Z, Hassan A, Wahit MU. J. Polym. Res. 2012, 19, 9749.