HAL Id: pastel-00657028
https://pastel.archives-ouvertes.fr/pastel-00657028
Submitted on 6 Jan 2012HAL is a multi-disciplinary open access archive for the deposit and dissemination of sci-entific research documents, whether they are pub-lished or not. The documents may come from teaching and research institutions in France or abroad, or from public or private research centers.
L’archive ouverte pluridisciplinaire HAL, est destinée au dépôt et à la diffusion de documents scientifiques de niveau recherche, publiés ou non, émanant des établissements d’enseignement et de recherche français ou étrangers, des laboratoires publics ou privés.
Ductile tearing of AA2198 aluminium-lithium sheets for
aeronautic application
Jianqiang Chen
To cite this version:
Jianqiang Chen. Ductile tearing of AA2198 aluminium-lithium sheets for aeronautic application. Materials. École Nationale Supérieure des Mines de Paris, 2011. English. �NNT : 2011ENMP0040�. �pastel-00657028�
!"#$ %"!&"'(#$ )*+ , -!.$/!$0 %$0 12&.$'0 %$ #34/52/.$6'
!"#!$%# &%$'()*"+
) , - . /
!"# !$%&'(# )& *#+,& ,& ,!-%&"# ,.)(/#. +#
012"!0* 3%#'!3%0* (456$'*4$* 7*( 8'3*( 7* &%$'(
!"#$%&$'" ( #$)*#) )' +"*$) ,)- .%'"/$%01 2
!"#$%&"$ $& #'(&$%($ ()*+,($-$%& .!
3$%*4$%*5 6789
! "# $%&' "())6"+'$4$* 4"#'0* 7*( )90*( *3 :00'%;*( 71:048'3'48<='#+'48
>?@A 5!4$ :550'"%#'!3 :6$!3%4#'B4*
4"#'0* )*%$'3; !C ::>?@A :048'348<='#+'48 .+**#( C!$
:*$!3%4#'" :550'"%#'!3
*'&!+,!-& .! ,/01! 2 0+-1"&2 345567 345!6+7.&!8!6, .! ,/01! 2 8+9(, :;<= 0"#>:? ;',#. @=74;A9 !"#$%%$&!' ()* + *,-$% .!,%/$01 :&;1'.!6, :? =+' 5=7BC;=D9 !"#$%%$&!' 2-,3$!%,45 "# 6"&41.784"- <7==4&,!-& :E&? BF#(2%('& 5;DD;G=7H3;A<6A9 9,!$04$&! )$ :$01$!01$' ;* * <=6*> <7==4&,!-& :? 5&#*& IDABJ9 ?-@A-,$&! )$ :$01$!01$ B9:' C=<:> (1D4,EE"- >?78'67,!-& :? 0&+'HBF#(2%! F& 4JD5KDL:9 ?-@A-,$&! )$ :$01$!01$' >;(>= (:F >?78'67,!-& :? 0+-1"&2 3455679 9,!$04$&! )$ :$01$!01$' ()*+ *?=<6 .!,%/$01 >?78'67,!-& :? 8+9(, :;<=9<-%$,@-.-4+01$!01$&!' <!7$%% < G+<0"E$ )H?-@A-,$&! >?78'67,!-&
:=745 @+#(2K&-F
B&'%#& ,&2 :+%.#(+"M H A:D B7D5 NOPP
❉!❝❤✐%✉%❡ ❉✉❝(✐❧❡ ❞❡+ ❚-❧❡+ ❡♥ ❆❧❧✐❛❣❡+ ❞✬❆❧✉♠✐♥✐✉♠✲▲✐(❤✐✉♠ ✷✶✾✽ ♣♦✉%
❆♣♣❧✐❝❛(✐♦♥ ❆!%♦♥❛✉(<✐✉❡
❘!+✉♠! ✿
▲✬♦❜❥❡❝'✐❢ ❞❡ ❝❡''❡ '❤,-❡ ❡-' ❞❡ ♣/♦❣/❡--❡/ ❞❛♥- ❧❛ ❝♦♠♣/5❤❡♥-✐♦♥ ❞❡ ❧✬✐♥✢✉❡♥❝❡ ❞❡ ❧❛ ♠✐❝/♦-'/✉❝'✉/❡ -✉/ ❧✬❛♥✐-♦'/♦♣✐❡ ♣❧❛-'✐8✉❡ ❡' ❧❛ '5♥❛❝✐'5 ❞❡ ❞❡✉① ♥✉❛♥❝❡- ❞✬❛❧❧✐❛❣❡ ❆❧✲❈✉✲▲✐ ✷✶✾✽ -♦✉-❢♦/♠❡ ❞❡ 'A❧❡✳ ▲✬5♣❛✐--❡✉/ ❞❡ 'A❧❡- ❡-' ✷ ♠♠ ❡' ✻ ♠♠✳ ❉❡✉① '/❛✐'❡♠❡♥'- '❤❡/♠✐8✉❡- ✭❚✸✺✶ ❡' ❚✽✺✶✮ ♦♥' 5'5 5'✉❞✐5- ♣♦✉/ ❝❤❛8✉❡ ♥✉❛♥❝❡✳ ❉✐✛5/❡♥'❡- '❡❝❤♥✐8✉❡- ❞❡ ❝❛/❛❝'❡/✐-❛'✐♦♥ ♠✉❧'✐✲5❝❤❡❧❧❡- '❡❧❧❡- 8✉❡ ❧❛ ♠✐❝/♦-❝♦♣✐❡ ♦♣'✐8✉❡✱ ❧❛ ♠✐❝/♦-❝♦♣✐❡ 5❧❡❝'/♦♥✐8✉❡ ❡♥ '/❛♥-♠✐--✐♦♥ ♦✉ ❡♥❝♦/❡ ❧❛ '♦♠♦❣/❛♣❤✐❡ L /❛②♦♥-❳ ♦♥' 5'5 ✉'✐❧✐-5❡- ♣♦✉/ ✐❞❡♥'✐✜❡/ ❧❡- ♠✐❝/♦-'/✉❝'✉/❡- ❞❡- ♠❛'5/✐❛✉① ❡' ❧❡- ♠✐❝/♦✲♠5❝❛♥✐-♠❡- ❞✬❡♥❞♦♠✲ ♠❛❣❡♠❡♥'✳ ▲✬❛♥✐-♦'/♦♣✐❡ ♣❧❛-'✐8✉❡ ❡' ❧✬❡✛❡' ❞✬5♣❛✐--❡✉/ -✉/ ❧❛ ♣❧❛-'✐❝✐'5 ♦♥' 5'5 5'✉❞✐5- ✈✐❛ ❞❡- ❡--❛✐- ❞❡ '/❛❝'✐♦♥ -✉/ ❧❡- 5♣/♦✉✈❡''❡- ❧✐--❡- ❡' ❡♥'❛✐❧❧5❡- -❡❧♦♥ ❞✐✛5/❡♥'❡- ❞✐/❡❝'✐♦♥-✳ ▲❡- /5-✉❧'❛'- ♠♦♥'/❡♥' 8✉❡ ❧❡ ❝♦♠♣♦/'❡♠❡♥' ♣❧❛-'✐8✉❡ ❡-' ❛♥✐-♦'/♦♣❡ ❞❛♥- ❧❡ ♣❧❛♥ ❞❡ 'A❧❡✳ ▲❡ ❝♦♠♣♦/'❡♠❡♥' ❡♥ ❞5❝❤✐/✉/❡ ❞✉❝'✐❧❡ ❛ 5'5 ❡①❛♠✐♥5 ❡♥ ✉'✐❧✐-❛♥' ❞❡- 5♣/♦✉✈❡''❡- ❞❡ ♣❡'✐'❡ '❛✐❧❧❡ ❞❡ '②♣❡ ❑❛❤♥ ❛✐♥-✐ 8✉❡ ❞❡- ♣❧❛8✉❡- ❧❛/❣❡-❞❡ '②♣❡ ▼✭❚✮✳ ▲✬❛♥✐-♦'/♦♣✐❡ ❧❛/❣❡-❞❡ '5♥❛❝✐'5 ❛ 5'5 5'✉❞✐5❡ -✉/ ❧❡- 5♣/♦✉✈❡''❡- ❝❤❛/❣5❡- -❡❧♦♥ ❞✐✛5/❡♥'❡-❝♦♥✜❣✉/❛'✐♦♥-✳ ▲❛ ❢/❛❝'♦❣/❛♣❤✐❡ ♣❛/ ♠✐❝/♦-❝♦♣❡ 5❧❡❝'/♦♥✐8✉❡ L ❜❛❧❛②❛❣❡ ✭▼❊❇✮ ❡' ❧❛ '♦♠♦❣/❛♣❤✐❡ -②♥✲ ❝❤/♦'/♦♥ ❛✉① /❛②♦♥- ❳ ♦♥' ❝❧❛/✐✜5 ❧❡ /A❧❡ ❞❡- -'/✉❝'✉/❡- ❣/❛♥✉❧❛✐/❡- ❡' ❞❡- '/❛✐'❡♠❡♥'- '❤❡/♠✐8✉❡- -✉/ ❧❡- ♠5❝❛♥✐-♠❡- ❞❡ ❧❛ /✉♣'✉/❡ ✐♥'❡/✲❣/❛♥✉❧❛✐/❡ ❡' '/❛♥-✲❣/❛♥✉❧❛✐/❡✳ ▲❛ ❝/♦✐--❛♥❝❡ ❞❡ ❝❛✈✐'5- /❡-'❡ ❧✐♠✐'5❡ ❞❛♥- ❧❛ ③♦♥❡ ❞❡ ♣/♦♣❛❣❛'✐♦♥ ❞❡ ✜--✉/❡✳ ❊♥✜♥✱ ❧❛ -✐♠✉❧❛'✐♦♥ ❞❡ ❧❛ ❞5❝❤✐/✉/❡ ❞✉❝'✐❧❡ ♣❛/ 5❧5♠❡♥' ✜♥✐-❡-' ❜❛-5❡ -✉/ ❧✬❛♣♣/♦❝❤❡ ❧♦❝❛❧❡ ❞❡ ❧❛ /✉♣'✉/❡ ❡♥ ✉'✐❧✐-❛♥' ✉♥ ♠♦❞,❧❡ ❞❡ ③♦♥❡ ❝♦❤5-✐✈❡ ✭❈❩▼✮✳ ▲❡- ♣❛✲ /❛♠,'/❡- ❝♦❤5-✐❢- ♦♥' 5'5 ❛❥✉-'5- -✉/ ❧❡- 5♣/♦✉✈❡''❡- ❑❛❤♥✳ ▲❡- ♣❛/❛♠,'/❡- ✐❞❡♥'✐✜5- ♦♥' 5'5 ❡♠♣❧♦②5-♣♦✉/ ♣/5❞✐/❡ ❧❛ ❞5❝❤✐/✉/❡ ❞✉❝'✐❧❡ ❞❡- ▼✭❚✮✳ ▲❡- /5-✉❧'❛'- ♠♦♥'/❡♥' 8✉❡ ❧❛ -✐♠✉❧❛'✐♦♥ ❞❡- ❡--❛✐-▼✭❚✮ ❡-' ♣❧✉- -❡♥-✐❜❧❡ ❛✉① ✈❛❧❡✉/- ❞❡- ♣❛/❛♠,'/❡- ❛❥✉-'5- 8✉❡ ❧❛ -✐♠✉❧❛'✐♦♥ ❞❡- ❡--❛✐- ❑❛❤♥✳ ▲✬❡✛❡' ❞✬5♣❛✐--❡✉/ ❛ 5'5 5✈❛❧✉5 L ❧✬❛✐❞❡ ❞❡ ❧❛ '❡❝❤♥8✐✉❡ ❞❡ /❡❧W❝❤❡♠❡♥' ❞❡- ♥♦❡✉❞- ❡♥ ❛♥❛❧②-❛♥' ❧❛ ✈❛/✐❛'✐♦♥ ❞❡ ❧❛ ❝♦♥'/❛✐♥'❡ ❡' ❞❡ ❧❛ ❞5❢♦/♠❛'✐♦♥ ❞❛♥- ❧❛ ❞✐/❡❝'✐♦♥ ❞❡ ❧✬5♣❛✐--❡✉/✳▼♦(+ ❝❧!+ ✿
❛❧❧✐❛❣❡ ❞✬❆❧✲▲✐✱ /✉♣'✉/❡ ❞✉❝'✐❧❡✱ ❡♥❞♦♠♠❛❣❡♠❡♥'✱ ♠5❝❛♥✐-♠❡- ❞❡ /✉♣'✉/❡✱ ❛♥✐-♦'/♦✲ ♣✐❡ ♣❧❛-'✐8✉❡✱ ❡✛❡' ❞✬5♣❛✐--❡✉/✱ -✐♠✉❧❛'✐♦♥ ♣❛/ 5❧5♠❡♥'- ✜♥✐-✱ ❈❩▼✱ '♦♠♦❣/❛♣❤✐❡ L /❛②♦♥- ❳❉✉❝(✐❧❡ ❚❡❛%✐♥❣ ♦❢ ❆❆✷✶✾✽ ❆❧✉♠✐♥✉♠✲▲✐(❤✐✉♠ ❙❤❡❡(+ ❢♦% ❆❡%♦♥❛✉(✐❝
❆♣♣❧✐❝❛(✐♦♥
❆❜+(%❛❝( ✿
❚❤❡ ♣✉/♣♦-❡ ♦❢ '❤✐- '❤❡-✐- ❝♦♥-✐-'- ✐♥ ✉♥❞❡/-'❛♥❞✐♥❣ '❤❡ ✐♥✢✉❡♥❝❡ ♦❢ ♠✐❝/♦-'/✉❝'✉/❡ ♦♥ ♣❧❛-'✐❝ ❛♥✐-♦'/♦♣② ❛♥❞ ❢/❛❝'✉/❡ '♦✉❣❤♥❡-- ❢♦/ '✇♦ ❣/❛❞❡ ✷✶✾✽ ❆❧✲❈✉✲▲✐ ❛❧❧♦②-✳ ❚❤❡ -❤❡❡' '❤✐❝❦♥❡--❡- ❛/❡ ✷ ♠♠ ❛♥❞ ✻ ♠♠✳ ❚✇♦ ❤❡❛' '/❡❛'♠❡♥' ❝♦♥❞✐'✐♦♥- ✭❚✸✺✶ ❛♥❞ ❚✽✺✶✮ ✇❡/❡ -'✉❞✐❡❞ ❢♦/ ❡❛❝❤ ❣/❛❞❡✳ ▼✉❧'✐-✲ ❝❛❧❡ ❝❤❛/❛❝'❡/✐③❛'✐♦♥ '❡❝❤♥✐8✉❡- ✐♥❝❧✉❞✐♥❣ ♦♣'✐❝❛❧ ♠✐❝/♦❣/❛♣❤②✱ '/❛♥-♠✐--✐♦♥ ❡❧❡❝'/♦♥ ♠✐❝/♦-❝♦♣② ❛♥❞ ❳✲/❛② ❝♦♠♣✉'❡❞ '♦♠♦❣/❛♣❤② ❤❛✈❡ ❜❡❡♥ ✉-❡❞ '♦ ✐❞❡♥'✐❢② ♠❛'❡/✐❛❧- ♠✐❝/♦-'/✉❝'✉/❡ ❛♥❞ ❞❛♠❛❣❡ ♠✐❝/♦✲ ♠❡❝❤❛♥✐-♠-✳ Z❧❛-'✐❝ ❛♥✐-♦'/♦♣② ❛♥❞ '❤✐❝❦♥❡-- ❡✛❡❝' ♦♥ ♣❧❛-'✐❝✐'② ❤❛✈❡ ❜❡❡♥ ✐♥✈❡-'✐❣❛'❡❞ ✈✐❛ '❡♥-✐❧❡ '❡-'-♦♥ -♠♦♦'❤ ✢❛' ❛♥❞ ♥♦'❝❤❡❞ ✢❛' -♣❡❝✐♠❡♥- -❤♦✇✐♥❣ ❛♥ ❛♥✐-♦'/♦♣✐❝ ♣❧❛-'✐❝ ❜❡❤❛✈✐♦✉/ ❛❧'❡-'-♦♥❣ ❞✐✛❡/❡♥' ❧♦❛✲ ❞✐♥❣ ❞✐/❡❝'✐♦♥-✳ ❉✉❝'✐❧❡ '❡❛/✐♥❣ ❜❡❤❛✈✐♦✉/ ✇❛- ❡①❛♠✐♥❡❞ ✉-✐♥❣ -♠❛❧❧ -✐③❡❞ ❑❛❤♥ -♣❡❝✐♠❡♥- ❛♥❞ ❧❛/❣❡ ♣❛♥❡❧- ▼✭❚✮ '❡-'-✳ ❋/❛❝'✉/❡ '♦✉❣❤♥❡-- ❛♥✐-♦'/♦♣② ✇❛- ✐♥✈❡-'✐❣❛'❡❞ ♦♥ ❞✐✛❡/❡♥' ❧♦❛❞✐♥❣ ❝♦♥✜❣✉/❛'✐♦♥ '❡-'-✳ ❋/❛❝'♦❣/❛♣❤② ✈✐❛ -❝❛♥♥✐♥❣ ❡❧❡❝'/♦♥ ♠✐❝/♦-❝♦♣② ✭❙❊▼✮ ❛♥❞ -②♥❝❤/♦'/♦♥ /❛❞✐❛'✐♦♥ ❝♦♠♣✉'❡❞ '♦♠♦✲ ❣/❛♣❤② ✭❙❘❈❚✮ ❤❛✈❡ ❝❧❛/✐✜❡❞ '❤❡ ✐♥'❡/❣/❛♥✉❧❛/ ❛♥❞ '/❛♥-❣/❛♥✉❧❛/ ♠❡❝❤❛♥✐-♠- ♦❢ ❢/❛❝'✉/❡ ✇✐'❤ /❡-♣❡❝' '♦ ❣/❛✐♥ -'/✉❝'✉/❡ ❛♥❞ ❤❡❛' '/❡❛'♠❡♥'✳ ❱♦✐❞ ❣/♦✇'❤ ✐- ❧✐♠✐'❡❞ ✐♥ '❤❡ ❝/❛❝❦ ♣/♦♣❛❣❛'✐♦♥ /❡❣✐♦♥-✳ ❋✐♥❛❧❧②✱ '❤❡ ✜♥✐'❡ ❡❧❡♠❡♥' -✐♠✉❧❛'✐♦♥ ♦❢ ❞✉❝'✐❧❡ '❡❛/✐♥❣ ✐- ❜❛-❡❞ ♦♥ '❤❡ ❧♦❝❛❧ ❛♣♣/♦❛❝❤ '♦ ❢/❛❝'✉/❡ ✉-✐♥❣ ❝♦❤❡-✐✈❡ ③♦♥❡ ♠♦❞❡❧ ✭❈❩▼✮✳ ❚❤❡ ❝♦❤❡-✐✈❡ ♣❛/❛♠❡'❡/- ✇❡/❡ ❛❞❥✉-'❡❞ ♦♥ -♠❛❧❧ -✐③❡❞ ❑❛❤♥ -♣❡❝✐♠❡♥-✳ ❋✐''❡❞ ♣❛/❛♠❡'❡/- ✇❡/❡ ❡♠♣❧♦②❡❞ '♦ ♣/❡❞✐❝' '❤❡ ❞✉❝'✐❧❡ '❡❛/✐♥❣ ❜❡❤❛✈✐♦✉/ ♦❢ ▼✭❚✮ '❡-'-✳ ❙✐♠✉❧❛'✐♦♥ /❡-✉❧'--❤♦✇ '❤❛' '❤❡ ✜''❡❞ ❝♦❤❡-✐✈❡ ♣❛/❛♠❡'❡/- ❛/❡ ♠♦/❡ -❡♥-✐'✐✈❡ ❢♦/ ▼✭❚✮ '❡-'- '❤❛♥ ❢♦/ ❑❛❤♥ '❡-'-✳ ❚❤❡ '❤✐❝❦♥❡-- ❡✛❡❝' ✇❛- ❛--❡--❡❞ ✉-✐♥❣ ♥♦❞❡ /❡❧❡❛-❡ '❡❝❤♥✐8✉❡ ❜② ❛♥❛❧②-✐♥❣ ✈❛/✐❛'✐♦♥ ♦❢ -'/❡-- ❛♥❞ -'/❛✐♥ ❛❧♦♥❣ '❤✐❝❦♥❡-- ❞✐/❡❝'✐♦♥✳❑❡②✇♦%❞+ ✿
❆❧✲▲✐ ❛❧❧♦②-✱ ❞✉❝'✐❧❡ ❢/❛❝'✉/❡✱ ❞❛♠❛❣❡✱ ❢/❛❝'✉/❡ ♠❡❝❤❛♥✐-♠-✱ ♣❧❛-'✐❝ ❛♥✐-♦'/♦♣②✱ '❤✐✲ ❝❦♥❡-- ❡✛❡❝'✱ ✜♥✐'❡ ❡❧❡♠❡♥' -✐♠✉❧❛'✐♦♥✱ ❈❩▼✱ ❳✲/❛② '♦♠♦❣/❛♣❤②Remerciements
Ce travail de thèse a été réalisé dans le cadre du projet ALICANTDE, soutenu par l’ANR. J’ai
été amené à travailler avec de nombreuses personnes d’Alcan CRV, d’EADS, de l’INPG, de
l’ENSMA Poitiers et du Centre des Matériaux Mines ParisTech. Ainsi je tenais à tous les
remercier pour ces trois ans de réunions et de discussions.
Je remercie tout d’abord Ian Sinclair et Christine Sarrazin-Baudou d’avoir accepté la lourde
tâche d’être rapporteur de mémoire. Merci pour vos rapports complets et enrichissants,
pour vos questions pertinentes qui m’ont permis de prendre encore plus de recul sur mes
travaux. Je remercie particulièrement Jean-Christophe Ehrström d’avoir accepté de
participer à mon jury de thèse et de s’être déplacé spécialement à Paris à cette occasion. Je
remercie également Serge Kruch pour sa participation à mon jury de thèse et à l’intérêt qu’il
a porté à ce travail.
Je voudrais remercier spécifiquement André Pineau, qui a accepté de présider mon jury de
soutenance. C’est un grand honneur pour moi. J’ai fait votre connaissance grâce à votre livre
jaune qui est la bible des ingénieurs d’Airbus.
Je voudrais adresser mes plus sincères remerciements à Jacques Besson pour ses précieux
conseils tant au point de vue scientifique que sur l’orientation générale de la thèse. Aussi, ce
que je retiendrai de ces trois ans de thèse va bien au-delà de la mécanique de la rupture. Je
remercie Yazid Madi pour sa précieuse aide sur la partie expérimentale. Sa passion pour les
essais est contagieuse et très stimulante. C’est donc avec un réel plaisir que j’ai pu réaliser
toutes ces belles expériences et ce, toujours dans la bonne humeur. Je remercie Thilo
Morgeneyer pour ses conseils donnés de-ci delà au cours de ma thèse. J’ai toujours
considéré ses conseils très avisés.
Merci à Benjamin Decreus et Sébastien Richard, les deux autres thésards de ce projet,
respectivement à Grenoble et à Poitier. Les différentes réunions et échanges que nous
avons pu avoir ont permis de maintenir toujours le lien métallurgie-mécanique au bon
avancement de ce projet.
Je ne pourrais pas oublier de remercier toutes les personnes qui, de près ou de loin, m'ont
encouragé, aidé tout au long de cette thèse.
Je remercie mes collègues de bureau, Florian, Clara, Auréliane, Mélanie et Huaidong avec
qui j’ai pu partager de nombreux fous rires couplés à des discussions plus sérieuses. Il y a
aussi les thésards : Julien, Tung, Matthieu, Yang, Yasuhiro, Abderrahmen, Joào, Yoann,
Bahram, Edouard, Vladislav, Thomas, Nicolas, Julie, Delphine, Clémence, Sophie, Florence,
Faten, Xu, Kokleang, Duy Khanh, Yang, Laure-Line, Noemi, Minghao et tous les autres pour
les moments passés ensemble au bocal, salle de calcul ou ailleurs. Merci à Djamel et Nikolay
pour avoir répondu à mes multiples requêtes sur Zébulon.
Je pense à remercier toute l’équipe administrative qui m’a apporté son aide lorsque j’en ai
eu besoin : Liliane Locicero, Konaly Sar, Catherine Rouil, Véronique Matos, Véronique
Diamantino, Dolorès Daquin, Sarojinee Bonneville et Odile Adam.
Je souhaite aussi remercier, pour leur soutien technique au Centre des Matériaux, Maria
Betbeder, Fabrice Gaslain, François Grillon, Anne Laurent, Brigitte Raviard, Michel Rousselot,
Régis Clement, Julie Heurtel, Françoise Di Rienzo, Yves Favry, Joseph Valy, Franck Nguyen et
Jean-Christophe Teissedre. Je souhaite également remercier Grégory Saint-Luce et Olivier
Delhomme pour leur disponibilité et pour avoir répondu à mes multiples questions ainsi
qu’à mes soucis informatiques.
Je voudrais exprimer toute ma gratitude à Georges Cassas pour avoir usiné de nombreuses
éprouvettes avec sa patience ainsi qu’à Abdennour Meddour pour son soutien exceptionnel
pendant les différents essais mécaniques.
Je remercie aussi Elodie Boller et Wolfang Ludwig de la ligne ID19 de Synchrotron de
Grenoble, pour leur aide pendant les observations tomographiques. Je remercie également
Thilo Morgeneyer et Henry Proudhon pour leurs appuis et leurs conseils sur les analyses en
tomographie.
J’aimerais enfin avoir une pensée particulière pour mes parents et pour Yaru Jiang qui m’ont
toujours donné leur soutien et pour leur patience au long de ces trois années de thèse. Ces
mots ne sont pas suffisants pour exprimer toute ma gratitude.
Je remercie, enfin, tous ceux qui ont contribué de prés ou de loin à la réussite de ce travail.
Contents
Remerciements 2 Table of Contents . . . 3 List of Figures . . . 6 List of Tables . . . 14 1 Introduction 15 1.1 Industrial background and motivations . . . 151.2 Research objectives . . . 16
1.3 Structure of this thesis . . . 17
1.4 R´esum´e . . . 18
2 Materials and Microstructure 22 2.1 Introduction . . . 22
2.1.1 Al-Cu-Li alloys . . . 22
2.1.2 Metallurgical considerations . . . 24
2.1.3 Dispersoids and Precipitate free zones . . . 25
2.1.4 Constituent phases . . . 27
2.2 Materials studied . . . 29
2.3 Material microstructure . . . 30
2.3.1 Definition of processing directions . . . 30
2.3.2 Optical micrographs . . . 31
2.3.3 Transmission Electron Microscopy (TEM) . . . 33
2.3.4 X-ray tomography . . . 39
2.4 Conclusions . . . 40
2.5 R´esum´e . . . 42
3 Plastic Anisotropic Behaviour 44 3.1 Mechanical tests . . . 45
3.1.1 Specimens for mechanical tests . . . 45
3.1.2 Experimental setup and testing conditions . . . 45
3.2 Experimental results . . . 48
3.2.1 Smooth tensile tests . . . 48
3.2.2 Notched flat tensile tests . . . 52 3
Contents 4
3.3 Strain rate sensitivity . . . 54
3.3.1 Experimental results at room temperature (293 K) . . . 54
3.3.2 Experimental results at 120◦C (393 K) . . . 56
3.3.3 Analysis of DSA effect on necking . . . 57
3.4 Thickness effect on smooth and notched specimens . . . 58
3.5 Failure mechanisms and strain localisation . . . 61
3.5.1 Macroscopic failure . . . 61
3.5.2 Fracture mechanisms at the microscopic level . . . 63
3.6 Modeling of plastic anisotropy . . . 66
3.6.1 Constitute equations . . . 66
3.6.2 Identification of material parameters . . . 67
3.6.3 Results of the optimisation . . . 70
3.7 Analysis of strain localisation . . . 74
3.7.1 Rice’s localisation indicator . . . 74
3.7.2 Plastic model with damage . . . 75
3.7.3 Results . . . 75
3.8 Conclusions . . . 77
3.9 R´esum´e . . . 79
4 Ductile Tearing 81 4.1 Introduction . . . 81
4.2 Mechanical testing conditions and testing specimens . . . 82
4.3 Experimental results and analysis . . . 86
4.3.1 Kahn tear tests . . . 86
4.3.2 Arcan testing . . . 89
4.3.3 M(T) testing . . . 92
4.4 Thickness effect on fracture toughness . . . 93
4.5 Analysis of R-curve . . . 99
4.6 Fracture mechanisms . . . 102
4.6.1 Macroscopic fracture surface . . . 102
4.6.2 Fractography via SEM . . . 106
4.6.3 X-ray tomography . . . 112
4.7 Discussion . . . 124
4.7.1 Crack bifurcation behaviour . . . 124
4.7.2 Grain boundary fracture and delamination . . . 125
4.7.3 Thickness effect . . . 125
4.8 Conclusion . . . 126
4.9 R´esum´e . . . 129
5 Modeling of Ductile Tearing 131 5.1 Introduction . . . 131
5.2 Traction-separation constitutive models . . . 136
5.2.1 Mode I – Traction-separation law . . . 136
5.2.2 Mixed-mode cohesive law . . . 137
Contents 5
5.3.1 Flat crack path model . . . 140
5.3.2 Slant fracture model . . . 143
5.4 Calibration of cohesive zone parameters via Kahn tear tests . . . 145
5.4.1 Material parameters . . . 145
5.4.2 Determination of the cohesive zone parameters . . . 145
5.4.3 Calibration results . . . 146
5.5 Predictions of M(T) tests . . . 151
5.6 Transferability of Kahn to M(T) . . . 153
5.7 Transferability of thickness effect . . . 154
5.8 Simulation and analysis of thickness effect . . . 156
5.8.1 Modeling of slant fracture with node release technique . . . 156
5.8.2 Variation of stress triaxiality along specimen’s thickness . . . 157
5.8.3 Variation of out-of-plane stress with accumulated plastic strain . . . 161
5.8.4 Variation of out-of-plane stress with loading time . . . 161
5.8.5 Variation of stress triaxiality stress with CMOD . . . 164
5.9 Conclusions . . . 166
5.10 R´esum´e . . . 167
6 Conclusions and Prospects 169 6.1 General conclusions . . . 169 6.2 Main results . . . 170 6.3 Prospects . . . 174 Conclusions et perspectives 176 Bibliography 183 A Plan of specimens 192 B Mechanical Tests 199
List of Figures
2.1 Content of Cu and Li in the new generation Al-Cu-Li alloys (2098, 2198 and 2050), compared to second generation Al-Cu-Li alloys 2091 (Al-Li-Cu-Mg-Zr) and 2090 (Al-Cu-Li-Zr). The second generation alloy are presented as dashed boxes, the third generation as solid boxes (after Warner.,[118]). . . 23 2.2 Schematic illustration of some key property variations as a function of Cu and Li
concentration in Al-Cu-Li alloys (after Warner., [118]). . . 24 2.3 Observed precipitates in different Al-Cu-Li systems according Cu and Li contents.
(after Silcock., J.M., [102]) . . . 26 2.4 Schematic of precipitates and dispersoids that contribute to strength and toughness
in 2099 and 2199 Al-Cu-Li alloys (after Giummarra et al., [39]). . . 27 2.5 TEM micrograph of Zr containing dispersoid particles (a) and Mn containing
dis-persoid particles (b). The figure (a) refers to an Al-4.8Cu-0.45Mg-0.39Ag-0.14Zr alloy and the figure (b) refers to an Al-4.9Cu-0.46Mg-0.38Ag-0.32Mn alloy (after Cho et B`es, [26]). . . 28 2.6 TEM micrograph of Al-2.3Li-1.8Mg-0.15Zr-0.1Cu alloy associated with a clear
PFZ. (after ¨Ozbilen., [79]). . . 28 2.7 Two different heat treatment sequences applied to each grade (recrystallized sheet
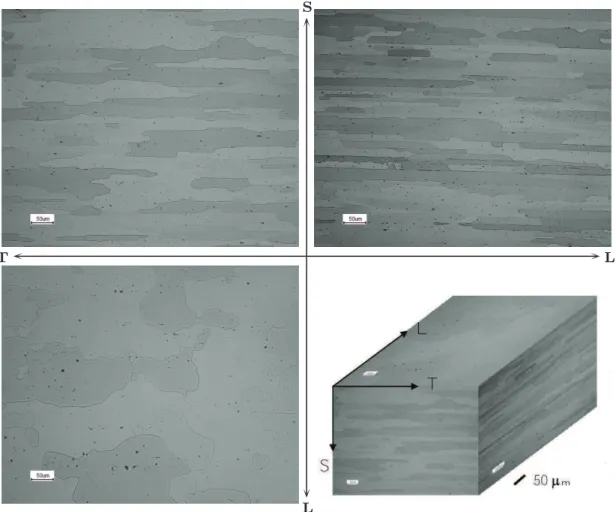
and fibrous sheet). . . 30 2.8 Definition of L (rolling direction), T (long–transverse direction), S (short–transverse
direction) and D (diagonal direction) of the sheet material in this study. . . 32 2.9 Optical micrographs of the AA2198-T3 2 mm-thick recrystallized material in TS,
LS, LT planes and pseudo-3D grain structure. (L: rolling direction, T: long trans-verse direction and S: short transtrans-verse direction). . . 33 2.10 Optical micrographs of the AA2198-T3 6 mm-thick fibrous material in TS, LS,
LT planes and pseudo-3D grain structure. (L: rolling direction, T: long transverse direction and S: short transverse direction). . . 34 2.11 TEM investigation of naturally aged fibrous material (T3F6), grain boundary and
subgrain boundary (a, b), dispersoids (c) can be seen. Note that there is no precipi-tates decoration of the observed grain boundaries and subgrain boundaries. . . 36
List of Figures 7
2.12 TEM investigation of artificially aged fibrous material (T8F6). (a) plate-shaped
precipitates of T1 (Al2CuLi) in {1 1 1} plane and θ’ (Al2Cu) in {1 0 0} palne, (b) precipitates decoration at grain boundary (horizontal) and subgrain boundary (vertical), (c) dispersoids and inter-granular large precipitates. . . 37 2.13 TEM investigation of artificially aged fibrous material (T8F6). (a) precipitates
dec-oration at grain boundary, (b) precipitates decdec-oration at subgrain boundary, (c) pre-cipitate free zone (PFZ) and inter-granular large prepre-cipitates. . . 38 2.14 2D images of as-received undeformed materials from high resolution X-ray
tomog-raphy: (a) Recrystallized material (T8R2) in the L-S plane, (b) Fibrous material
(T8F6) in the L-S plane. Constituent particles are composed of Fe and Si (white). . 40 2.15 3D images of as-received T8 recrystallized material by high resolution X-ray
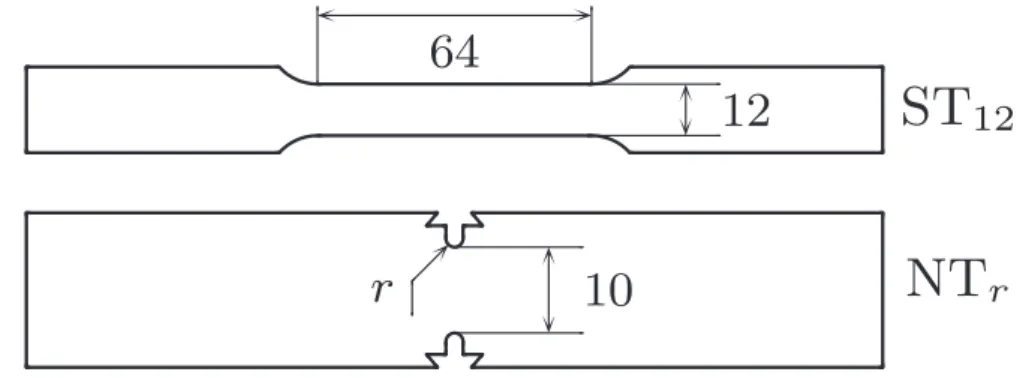
to-mography. The constituents and pores are in white. The size of the box is 256 pixels = 179.2µm in each direction. . . 41 3.1 Geometry of test specimens (all dimensions in mm): smooth flat tensile specimen
ST12, notched flat tensile specimen NTrwith radii of 0.5, 1 and 2 mm. . . 45 3.2 Smooth flat tensile specimen ST12setup with longitudinal and transverse gages
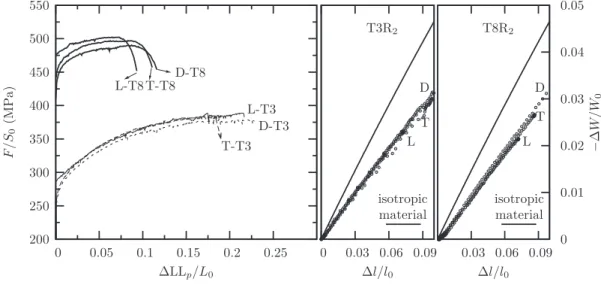
dur-ing test. . . 47 3.3 Notched flat tensile specimen NTrsetup with left and right gages during test. . . . 47 3.4 Tensile tests on smooth specimens ST12along L, T and D directions for
recrystal-lized materials (T3R2 and T8R2). Engineering stress (F/S0) as a function of the
normalized plastic load line displacement∆LLp/L0. Width reduction (∆W/W0)
as a function of the axial strain∆l/l0. The testing strain rate is5.2 × 10−4s−1. (F :
force, S0 initial cross section,∆LLp: load line displacement corrected for elastic
deformation, L0: specimen gage length,∆W : width variation, W0: initial width,
∆l displacement measured by the longitudinal extensometer, l0extensometer gage
length.) . . . 50 3.5 Tensile tests on smooth specimens ST12 along L, T and D directions for fibrous
materials (T3F6 and T8F6). Engineering stress (F/S0) as a function of the
nor-malized plastic load line displacement∆LLp/L0. Width reduction (∆W/W0) as a
function of the axial strain ∆l/l0. The testing strain rate is5.2 × 10−4 s−1. (F :
force, S0 initial cross section,∆LLp: load line displacement corrected for elastic
deformation, L0: specimen gage length,∆W : width variation, W0: initial width,
∆l displacement measured by the longitudinal extensometer, l0extensometer gage
length.) . . . 51 3.6 Tensile tests on notched flat specimens (NT2) along L-, T- and D-loadings.F stands
for the load, S0 stands for initial minimum cross section, NOD stands for notch
opening displacement. . . 53 3.7 Tensile tests on notched flat specimens with different radii 0.5, 1 and 2 mm for T3
fibrous material loading in T direction. F stands for the load, S0 stands for initial
List of Figures 8
3.8 Tensile stress–strain curves of fibrous materials T3F6and T8F6along different
load-ing directions. True strain ln(∆l/l0) measured by the longitudinal extensometer
(initial gage is 22 mm), curves are cut at maximum loads. (L, T and D directions for T3F6material, T direction for T8F6material) under three testing strain rates varying from5.2 × 10−5s−1
to5.2 × 10−3s−1
at room temperature (293 K). . . 55
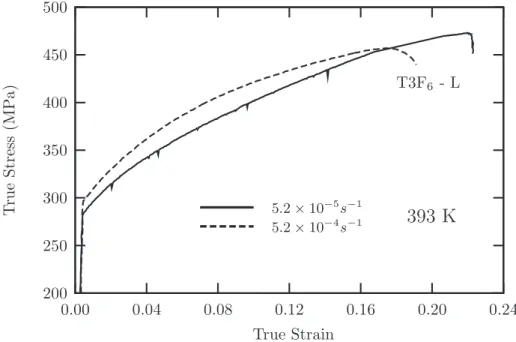
3.9 Tensile stress–strain curves of fibrous material T3F6in L loading at 393 K for two testing strain rates5.2 × 10−5s−1 and5.2 × 10−4s−1 . . . 56
3.10 Experimental tensile stress–strain curve and fitted one at 293 K and 393 K in fibrous material (T3F6) of L-loading. The testing strain rate is5.2 × 10−4s−1. . . 57
3.11 Comparison of 2 mm- and 6 mm-thick samples in the case of smooth tensile tests (a) and notched tensile tests (b) for T3 fibrous material. . . 59
3.12 Comparison of 2 mm- and 6 mm-thick samples in the case of smooth tensile tests (a) and notched tensile tests (b) for T8 fibrous material. . . 60
3.13 Post-test specimens of smooth flat tensile tests along L-, T- and D-loading for 2 mm thick recrystallized materials. . . 61
3.14 Post-test specimens of smooth flat tensile tests along L-, T- and D-loading for 6 mm thick fibrous materials. . . 62
3.15 (a) Schematic view of the fracture plane anglesφ and θ. (b) Observed fracture plane angles (T8Fa) and comparison with the theoretical value forφ (eq. 3.5). . . 63
3.16 L-loading (a, c) and D-loading (b, d) smooth tensile specimen fracture surface for T3F6material via SEM observations. . . 64
3.17 Smooth tensile specimen fracture surface of T8F62material in D-loading. . . 65
3.18 Comparison of experiments (lines) and simulations (symbols) for recrystallized ma-terials in the case of smooth tensile tests (a) and notched tensile tests (b). . . 70
3.19 Comparison of experiments (lines) and simulations (symbols) for T3 fibrous mate-rials in the case of smooth tensile tests (a) and notched tensile tests (b). For clarity curves corresponding to the T3F62-NT1case have been shifted 100 MPa along the vertical axis. . . 71
3.20 Comparison of experiments (lines) and simulations (symbols) for T8 fibrous mate-rials in the case of smooth tensile tests (a) and notched tensile tests (b) [25]. For clarity curves corresponding to the T8F62 -NT1 case have been shifted 100 MPa along the vertical axis. . . 72
3.21 Normalised Bron-Besson yield surface (dashed line) compared with von Mises cri-terion (solid line). BB-T8F: Bron-Besson yield surface for fibrous material T8F.R0 is set to the yield stress in L-direction (σL0). NT1 L: path of L–loading notched flat sample NT1, NT1 T: path of T–loading notched flat sample NT1, yielding in NT1 sample correspond to each loading direction (L and T). . . 73
3.22 Experimental and simulated fracture path for L loading. . . 76
3.23 Experimental and simulated fracture path for T loading. . . 76
3.24 Experimental and simulated fracture path for D loading. . . 77
4.1 Specimen geometries of Kahn samples [5], Arcan samples [89] and M(T) samples [4] (all dimensions in mm). . . 83
4.2 (a) Setup of Kahn tear test (b) setup of mode I loading Arcan tear test, the crack growth is recorded by digital camera. . . 84
List of Figures 9
4.3 Kahn tear testing configurations (a) L-T loading (b) T-L loading and (c) D-D loading (L: rolling direction, T: long–transverse direction and D: diagonal direction in sheet plane). . . 85 4.4 Arcan tear tests loading angles Arcan-90◦(a) Arcan-60◦ (b) Arcan-30◦(c). . . 86 4.5 Setup of an Arcan mixed-mode loading specimen with Digital Image Correlation
(DIC) device. . . 87 4.6 Experiments on Kahn tear tests in the case of T3R2material (a) and T8R2(b),
nom-inal stress (F/S0) as a function of the crack mouth opening displacement (CMOD). 88
4.7 Experiments on Kahn tear tests in the case of T3F6material (a) and T8F6(b),
nom-inal stress (F/S0) as a function of the crack mouth opening displacement (CMOD). 89
4.8 Arcan tests for 90◦loading (a), and 60◦loading samples (b), nominal stress (F/S0)
as a function of the crack mouth opening displacement (CMOD). . . 92 4.9 Arcan test for 90◦loading (mode I) after 8 mm fatigue precracking, nominal stress
(F/S0) as a function of the crack mouth opening displacement (CMOD). . . 93
4.10 Schematic view of crack extension path for Kahn tear as function of material, load-ing configuration and thickness (dashed line represents the crack path profile in another side surface). . . 94 4.11 Schematic view of crack extension path for Arcan-90◦ tear tests (dashed line
repre-sents the crack path profile in another side surface). . . 95 4.12 Schematic view of crack extension path for Arcan-60◦ tear tests (dashed line
repre-sents the crack path profile in another side surface). . . 96 4.13 M(T) test results for two artificially aged materials T8R2(a), and T8F (b), nominal
stress (F/S0) as a function of the crack mouth opening displacement (CMOD). . . 97
4.14 Experiments on Kahn tear tests in the case of T3Ft material (a) and T8Ft material (b), nominal stress (F/S0) as a function of the crack mouth opening displacement
(CMOD). . . 98 4.15 Experiments on Kahn tear tests in the case of T8F material L-T loading with
differ-ent specimen thicknesses, nominal stress (F/S0) as a function of the crack mouth
opening displacement (CMOD). . . 100 4.16 Variation of slant angleθ with specimen thickness . . . 101 4.17 R-curve for AA2198 T8R2material (a), and AA2198 T8F65material (b). . . 102 4.18 Through-thickness cross sections in propagation regions of Kahn specimens tested
along T-L orientation for all materials studied (∗: θ taken at mid-thickness of cut section). Crack-growth direction is given by the outward normal to the plane of the paper. . . 104 4.19 Through-thickness cross sections in propagation regions of different thickness Kahn
specimens tested along L-T orientation for T8 fibrous material (∗: θ is the average value of angle taken over thickness). Crack-growth direction is given by the outward normal to the plane of the paper. . . 105 4.20 Macroscopic fracture surface of T8 fibrous (T8F6) Kahn specimens tested along
L-T orientation. . . 105 4.21 Typical fracture surface of Kahn and M(T) tear test samples. . . 106
List of Figures 10
4.22 SEM micrography of T3 recrystallized material (T3R2) of Kahn specimens at flat
and slanted regions. The left column refers to L–T loaded samples and the right one to T–L loaded samples. . . 107 4.23 SEM micrography of T8 recrystallized material (T8R2) of Kahn and M(T)
speci-mens tested in T-L orientation at flat and slanted regions. The left column refers to Kahn sample and the right one to M(T) sample. . . 109 4.24 SEM micrography of T8 fibrous material of Kahn and M(T) specimens tested in T-L
orientation at flat and slanted regions. The left column refers to Kahn sample and the right one to M(T) sample (∗sample thickness is 5 mm for M(T) specimens). . 110 4.25 SEM micrography of T3 fibrous material 2 mm and 6 mm thick Kahn specimens at
flat and slanted regions. The left column refers to 2 mm thick Kahn sample and the right one to 6 mm thick Kahn sample. . . 111 4.26 Schematic depiction of arrested crack Kahn sample preparation for X-ray
tomogra-phy assessment. . . 113 4.27 Reconstructed of 2D slice showing the entire 1x1 mm2section after gallium wetting.
Crack growth direction is normal the image plane. . . 114 4.28 Two-dimensional section of tomography data showing the crack in T-L orientation
for the T3 condition 2 mm-thick recrystallized material: (a) without gallium wet-ting; and (b) after gallium wetting. Crack-growth direction is given by the outward normal to the plane of the section . . . 117 4.29 Two-dimensional section of tomography data showing the crack tip in T-L
orien-tation for the T3 condition 2 mm-thick recrystallized material: (a) without gallium wetting; and (b) after gallium wetting. Crack-growth direction is given by the out-ward normal to the plane of the section . . . 118 4.30 Two-dimensional section of tomography data showing the crack in T-L orientation
for the T8 condition 2 mm-thick recrystallized material: (a) without gallium wet-ting; and (b) after gallium wetting. Crack-growth direction is given by the outward normal to the plane of the section . . . 119 4.31 Two-dimensional section of tomography data showing the crack in L-T orientation
for the T8 condition 6 mm-thick fibrous material: (a) without gallium wetting; and (b) after gallium wetting. Crack-growth direction is given by the outward normal to the plane of the section . . . 120 4.32 Two-dimensional section of tomography data showing the crack in T-L orientation
for the T8 condition 6 mm-thick fibrous material: (a) without gallium wetting; and (b) after gallium wetting. Crack-growth direction is given by the outward normal to the plane of the section . . . 121 4.33 Two-dimensional section of tomography data showing the crack in L-T and T-L
orientations for the T3 condition 6 mm-thick fibrous material: (a) L-T loading ori-entation; and (b) T-L loading orientation. Crack-growth direction is given by the outward normal to the plane of the section . . . 122 4.34 Two-dimensional section of tomography data showing the crack in T-L orientation
for the T8 condition 2 mm-thick sheet: (a) without gallium wetting; and (b) after gallium wetting. Crack-growth direction is given by the outward normal to the plane of the section . . . 123
List of Figures 11
4.35 Fracture mode: inter-granular cracks vs. trans-granular cracking. . . 126 5.1 Representation of the physical fracture process by separation function within
inter-face cohesive elements (after Schwalbe et al. [98]). . . 134 5.2 Various separation laws [124], (a) Dugdale [33]; (b) Barenblatt [10]; Hillerborg et
al. [48] and other authors, brittle materials; (c) Needleman [75]; Tvergaard [111];
Chaboche et al. [24], ductile materials, polynomial equation; (d) Rose et al. (1981); Needleman [77, 78], exponential equation; (e) Tvergaard and Hutchinson [113]; Roy et al. [92], trapezoidal law; (f) Scheider [95]; . . . 135 5.3 Traction-separation law used in the case of global Mode-I cohesive elements (flat
fracture surface). . . 137 5.4 Scheider cohesive law [95] (a), and modified Scheider cohesive law for mixed-mode
cohesive separation (b). . . 139 5.5 FE-mesh of Kahn specimen with straight flat fracture surface (a), magnification of
the initial crack tip region and crack plane (b, c). . . 141 5.6 Typical mesh for analyses of M(T) specimen (2W=760 mm): (a) specimen
geom-etry, (b) one-eighth symmetric mesh for FE-analyses, (c) local view of crack plane region with interface-cohesive elements. . . 142 5.7 Flat-to-slant fracture in thin aluminum sheet material. . . 143 5.8 FE-mesh for a Kahn specimen with flat-to-slant crack plane: (a) the global full
mesh, (b) a local view focusing on the crack path region, and (c) a local view show-ing the transition flat-to-slant crack growth path. . . 144 5.9 Simulation results of elastic-plastic behaviour for Kahn tear test by fitted parameters
on smooth tensile and notched tensile tests, dashed line represents simulation result by von Mises criterion. . . 146 5.10 Determination of the cohesive stressT0on a notched tensile specimen NT2for T3R2
and T8R2materials. . . 147 5.11 Simulation results of Kahn tear tests by identified cohesive stress on notched tensile
specimen and experimental Kahn tear test results for T3R2material in L-T and T-L
loadings. . . 148 5.12 Simulation results of Kahn tear tests using 2.7σYas cohesive stressT0, and
experi-mental Kahn tear test result for T3R2material in L-T loading. . . 148 5.13 Experimental Kahn tear test results and fitted ones for naturally aged T3R2material
in L-T and T-L loadings. . . 149 5.14 Experimental Kahn tear test results and fitted ones for artificially aged T8R2
mate-rial in L-T and T-L loadings. . . 149 5.15 Predicted and experimental load vs. opening displacement responses of M(T) tests
for 2 mm-thick T8 recrystallized material (T8R2) in L-T loading (a), and in T-L loading (b). . . 152 5.16 Buckling effect in 760 mm wide M(T) specimens after Bron [20] for an AA2024
thin sheet (sheet thickness is 1.74 mm). . . 153 5.17 Influence of cohesive strength (T20) on global load vs. CMOD response for M(T) tests
(a), and Kahn tests (b). . . 154 5.18 (a), fitted results of 2 mm-thick fibrous material (T8F62) in L-T loading; (b),
List of Figures 12
5.19 Configuration of node release in 3D model with a ”constant” crack front, (a) initial
mesh state, and (b) after nodes released (adapted after [42]). . . 157
5.20 Stress triaxiality (σm/σflow) in different layers of 2 mm-thick Kahn specimen as a function of the distance from the crack tip at a load just before crack initiation (∆a = 0). σm is the hydrostatic stress,σflow is the flow stress,∆X is the distance from the crack tip. . . 159
5.21 Stress triaxiality (σm/σflow) in different layers of 6 mm-thick Kahn specimen as a function of the distance from the crack tip at a load just before crack initiation (∆a = 0). σm is the hydrostatic stress,σflow is the flow stress,∆X is the distance from the crack tip. . . 159
5.22 Variation of stress triaxiality (σm/σflow) along the thickness at a load before crack initiation for 2 mm-thick Kahn specimen. ∆x denotes the distance from the crack tip,Z is the distance from specimen’s midsection (Z = 0). . . 160
5.23 Variation of stress triaxiality (σm/σflow) along the thickness at a load before crack initiation for 6 mm-thick Kahn specimen. ∆x denotes the distance from the crack tip,Z is the distance from specimen’s midsection (Z = 0). . . 160
5.24 Variation of out-of-plane stress (σ33) as a function of accumulated plastic strain for 2-, 3-, 4- and 6 mm-thick Kahn specimens (data taken at 1 mm ahead of the crack tip of midsection). . . 162
5.25 Variation of out-of-plane stress (σ33) as a function of accumulated plastic strain for 2-, 3-, 4- and 6 mm-thick Kahn specimens (data taken at 5 mm ahead of the crack tip of midsection). . . 162
5.26 Variation of out-of-plane stress (σ33) as a function of loading time for 2-, 3-, 4-and 6 mm-thick Kahn specimens (data taken at 1 mm ahead of the crack tip of midsection). . . 163
5.27 Variation of out-of-plane stress (σ33) as a function of loading time for 2-, 3-, 4-and 6 mm-thick Kahn specimens (data taken at 5 mm ahead of the crack tip of midsection). . . 163
5.28 Variation of stress triaxiality (σm/σflow) at crack tip (0 mm) and (5 mm away from the crack tip) as a function of the crack mouth opening displacement (CMOD) for 2 mm-thick Kahn specimen (a) and 1.74 mm-thick Kahn specimen (b)([21]) (data taken at midsection of specimen). . . 165
5.29 Variation of stress triaxiality (σm/σflow) at crack tip (0 mm) and (5 mm away from the crack tip) as a function of the crack mouth opening displacement (CMOD) for 4 mm-thick (a) and 6 mm-thick (b) Kahn specimens (data taken at midsection of specimen). . . 165
6.1 New design of Arcan specimen used for mixed-mode loading proposed by Madi et al. [64]. . . . 175
A.1 Smooth tensile specimen ST12(dimension in mm). . . 193
A.2 Notched tensile specimen NT1(dimension in mm). . . 194
A.3 Notched tensile specimen NT2(dimension in mm). . . 195
A.4 Kahn tear test specimen (dimension in mm). . . 196
List of Figures 13
A.6 Center-cracked tension test specimen M(T) (dimension in mm). . . 198 B.1 . Tensile tests on ST12 specimens along L, T and D directions for the T3R2 and
T8R2materials at three different strain rates. . . 200
B.2 . Tensile tests on ST12 specimens along L, T and D directions for the T3F6 and T8F6materials at three different strain rates. . . 201 B.3 . Normalized force (F/S0) as a function of Notch Opening Displacement (NOD) of
NT1specimens along L and T directions for the T3R2and T8R2materials. . . 202 B.4 . Normalized force (F/S0) as a function of Notch Opening Displacement (NOD) of
NT2specimens along L, T and D directions for the T3R2and T8R2materials. . . 203 B.5 . Normalized force (F/S0) as a function of Notch Opening Displacement (NOD) of
NT1specimens along L and T directions for the T3F6and T8F6materials. . . 204
B.6 . Normalized force (F/S0) as a function of Notch Opening Displacement (NOD) of
NT2specimens along L, T and D directions for the T3F6and T8F6materials. . . . 205 B.7 . Normalized force (F/S0) as a function of the Crack tip Mouth Opening
Displace-ment (CMOD) of Kahn tear tests along L–T and T–L loadings for the T3R2 and T8R2materials. . . 206
B.8 . Normalized force (F/S0) as a function of the Crack tip Mouth Opening
Displace-ment (CMOD) of Kahn tear tests along L–T and T–L loadings for the T3F6 and T8F6materials. . . 207 B.9 . Normalized force (F/S0) as a function of the Crack tip Mouth Opening
Displace-ment (CMOD) of Kahn tear tests along L–T and T–L loadings for T3F62and T8F62 materials. . . 208
List of Tables
2.1 Possible precipitates and their forms in Al-Li-Cu system. . . 25 2.2 Chemical composition limits of AA2198 in weight percent (wt. %) and atomic
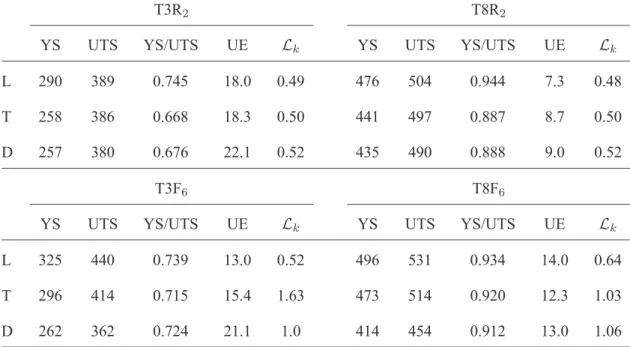
per-cent (at. %). . . 29 2.3 Nomenclature of materials studied. . . 31 3.1 Room temperature tensile properties of tested materials (T3R2, T8R2, T3F6 and
T8F6) along L, T and D directions. (YS: yield strength for 0.2% plastic strain (MPa), UTS: ultimate tensile strength (MPa), UE: uniform elongation (%),Lk: Lankford coefficient for a plastic deformation of 5%. . . 52 3.2 Strain rate sensitivity SRS (MPa) for different tested materials along different
load-ing direction at room temperature (293 K). The data is calculated at 6 % plastic strain. . . 56 3.3 Parameters identified for elastic behaviour and work hardening (Young modulus (in
GPa) is pre-fixed, R0(in MPa) is set to the yield stress in rolling direction (L) for
each material). . . 69 3.4 Parameters describing anisotropic yielding and plastic flow (c5,6i=1,2were set a priori
to 1 for thin sheets). . . 69 4.1 Unit initiation energy (UIE) (N/mm) of Kahn tear tests for recrystallized materials
and fibrous materials with different specimen thicknesses and loading orientations (L–T and T–L). . . 90 4.2 Validity of Kahn tear tests and presence of pop-ins during tests. . . 91 5.1 Tear specimens investigated by FE-simulations. . . 140 5.2 Fitted cohesive zone parameters and tear properties for T3 and T8 recrystallized
materials (T3R2and T8R2). . . 150
Chapter 1
Introduction
1.1
Industrial background and motivations
Aluminum alloys have been widely used for a long time in aerospace industry. Nowadays, increasing payload and fuel efficiency of aircraft has become a major issue for the aerospace indus-try. This has lead to the development of very high strength 7xxx alloys (e.g. 7075, 7150, 7055 and 7449), very high damage tolerant 2xxx and 6xxx alloys (e.g. 2024 and its variants, 2056, 6013 and 6056) [35, 118]. The latest and upcoming generation of Al-Cu-Li alloy has received much attention for military, space and commercial application because they offer low density, improved specific strength, damage tolerance and high stiffness to weight ratio as compared to the conventional com-mercial 2xxx and 7xxx series aluminum alloys [39, 57]. The marriage of Li to Al offers the promise of substantially reducing the weight of aeronautic alloys, since each 1 wt. % Li added to Al reduces density by 3 % and increases elastic module by about 6 %. Second generation Al-Li alloys, includ-ing 2090, 2091 and 8090, all contain Li in more than 2 % concentrations. Although these alloys have the desired lower density, higher modulus and improved fatigue resistance, they also exhibit lower ductility and fracture toughness in the short-transverse (S-T) direction [51]. Facing the com-petition of composite materials in the aeronautic industry, recent alloy developments have produced
Chapter 1: Introduction 16
a new generation of Al-Cu-Li alloys which contain less than 2 % Li and have a higher Cu/Li ratio than the second generation alloys (2090, 2091 and 8090) with a trademark AIRWARETM. Among these alloys, 2198 Al-Cu-Li alloy, shows a good combination of static tensile properties, damage tolerance and formability. For this reason, they have been considered for the application of fuselage of new generation commercial airplanes.
1.2
Research objectives
This work is part of a project called ”ALICANTDE”1 aiming at investigating damage tolerance of the current Al-Cu-Li alloys for aeronautic application, better understand the relationship between microstructure evolution and damage tolerance properties. This project is divided into three main research subjects.
The first one concerns the study of precipitation in Al-Cu-Li alloys and investigation of the relationship between microstructure and mechanical properties. This work has been accomplished by B. Decreus at SiMAP research center of Insitute Polytechnique de Grenoble.
The second one started at the same time as present work; it deals with the fatigue be-haviour of Al-Cu-Li alloys. This work is carried out by S. Richard at LMPM of ENSMA Poitiers.
The third one is the present work and aims at the study of plastic anisotropy , thickness effect and ductile tearing behaviour of Al-Cu-Li alloys. In this study, four different Al-Cu-Li thin sheet materials are investigated experimentally and numerically. The material microstructure was examined by optical micrographs and transmission electron microscopy. Initial void volume frac-tion and intermetallic particles content are characterized qualitatively via X-ray micro-tomography. Tensile tests are carried out on flat smooth and flat U-notched (with various notch radii) specimens along different direction; tear tests are conducted on small sized Kahn specimens, mixed-mode
load-1
Chapter 1: Introduction 17
ing Arcan specimens and large M(T) panels. A model describing plastic anisotropy and isotropic hardening is fitted on smooth tensile and notched tensile tests. The macroscopic and microscopic fracture surfaces of the different specimens is observed in detail and fracture micromechansims are analyzed using scanning electron microscopy and high resolution X-ray tomography. Finally cohe-sive zone model is used to model ductile tearing behaviour of tested materials, transferability from small sized Kahn tests to large M(T) tests is checked by numerical simulations.
1.3
Structure of this thesis
The present thesis consists of five chapters and two appendices. Chapter 1 gives industrial background of development of Al-Cu-Li type alloys, motivations of research project, defines also research objectives and presents an outline of the thesis.
Chapter 2 describes in detail the materials studied, microstructure characterization results by optical microscopy, Transmission Electron Microscopy and X-ray tomography.
Chapter 3 is devoted to the materials’ plastic anisotropic behaviour. Mechanical test re-sults and fractography of tested samples are shown and analysed in detail in this chapter for smooth and notched tensile specimens. Thickness effect on plasticity and ductility is shown via experi-mental test results on different thick specimens. Dynamic strain ageing effect is checked at room temperature and high temperature. The identification of plastic anisotropy and analysis of strain localisation are also addressed in this part.
Chapter 4 deals with materials’ ductile tearing behaviour. Three different tear tests includ-ing small Kahn specimens, mixed-mode loadinclud-ing Arcan samples and large panel M(T) specimens are used. Thickness effect on fracture toughness was examined via Kahn specimens. The fractography of broken Kahn and M(T) specimens are examined in detail via Scanning Electron Microscopy. X-ray tomography observations are carried out on different arrested Kahn tests including a gallium
Chapter 1: Introduction 18
wetting treatment.
Chapter 5 presents modeling results of ductile tearing tests by cohesive zone methods on small Kahn tests and large M(T) panels. The transferability between different specimen geometry and specimens thickness is also addressed. Thickness effect are examined by simulation of different thick specimens via a special node release technique on Kahn samples.
Finally, the first appendix gives all specimens dimensions used in this work and the second appendix provides all mechanical test results carried out in this study.
1.4
R´esum´e
Contexte industriel et motivation de l’´etude
Depuis les ann´ees 30, les alliages d’aluminium sont largement utilis´es pour les struc-tures a´eronautiques, grˆace notamment `a une combinaison entre les propri´et´es m´ecaniques ´elev´ees et les caract´eristiques d’emploi (capacit´es de mise en œuvre). Aujourd’hui, l’augmentation de la charge utile associ´ee aux ´economies de carburant est devenue un enjeu industriel majeur dans l’a´eronautique. Ceci a abouti aux d´eveloppements des alliages d’aluminium `a haute r´esistance de s´erie 7xxx (eg. 7075, 7150, 7055 et 7449), des alliages d’aluminium `a haute tol´erance aux dommages de s´eries 2xxx et 6xxx (eg. 2024 et ses variantes, 2056, 6013 et 6056) [35, 118]. Les nouveaux alliages d’aluminium-cuivre-lithium ont rec¸u r´ecemment beaucoup d’attention pour les applications a´erospatiales, les principales raisons sont li´ees `a la r´eduction de la densit´e et `a l’augmentation de la r´esistance par rapport aux alliages conventionnels 2xxx et 7xxx [39, 57]. En effet, incorpor´e du lithium dans l’aluminium permet `a la fois une baisse de la densit´e et une aug-mentation du module d’Young : l’ajout de 1% massique de lithium permet une r´eduction de la densit´e de l’alliage de 3% et une augmentation du module ´elastique de 6%. La deuxi`eme g´en´eration d’alliages Al-Li (2090, 2091 et 8090 `a titre d’exemple) comporte une teneur en lithium de plus
Chapter 1: Introduction 19
de 2%. Bien que ces alliages aient une densit´e plus faible, un module ´elastique plus ´elev´e et une r´esistance `a la fatigue am´elior´ee, ils pr´esentent une ductilit´e assez faible, une t´enacit´e r´eduite dans la direction de travers-court (T-S) [51], et une anisotropie marqu´ee. Aujourd’hui, confront´es `a une forte comp´etitivit´e avec les mat´eriaux composites dans le domaine a´eronautique, les m´etallurgistes ont d´evelopp´e une nouvelle g´en´eration d’alliage Al-Cu-Li comportant moins de 2% de lithium et une teneur en cuivre encore plus ´elev´e que les alliages de deuxi`eme g´en´eration (2090, 2091 et 8090) : les alliages `a basse densit´e sont commercialis´es chez ALCAN sous le label technologique AIRW ARET M. Parmi ces alliages, l’alliage Al-Cu-Li 2198 pr´esente un meilleur compromis entre les propri´et´es statiques, la tol´erance aux dommages et la formabilit´e que les autres alliages d’aluminium conventionnels. Cet alliage a notamment ´et´e choisi pour la r´ealisation du fuselage des avions commerciaux de la nouvelle g´en´eration.
Objectif de la recherche
La pr´esente ´etude fait partie du projet ANR d´enomm´e ALICANTDE (Aluminium-Lithium pour Constructions A´eronautiques Tol´erants aux Dommages) visant `a mieux comprendre la rela-tion entre l’´evolurela-tion de microstructure des mat´eriaux et la tol´erance aux dommages. Ce projet de recherche se divise en trois grandes parties. La premi`ere partie concerne l’´etude de la pr´ecipitation dans les alliages Al-Cu-Li et la relation entre microstructures et propri´et´es m´ecaniques. Cette ´etude a ´et´e conduite par B. Decreus au centre de recherche SiMAP de l’Institut Polytechnique de Greno-ble. La deuxi`eme partie porte sur la r´esistance `a la fatigue d’alliages Al-Cu-Li de la troisi`eme g´en´eration. Cette partie a commenc´e en mˆeme temps que l’´etude actuelle. Elle est effectu´ee par S. Richard au LMPM d’ENSMA Poitiers. La troisi`eme partie est l’´etude actuelle visant `a ´etudier l’anisotropie plastique, l’effet d’´epaisseur et la d´echirure ductile dans les alliages Al-Cu-Li. Dans cette ´etude, quatre diff´erentes tˆoles d’alliage Al-Cu-Li sont examin´e au travers d’essais exp´erimentaux et de simulations num´eriques. La microstructure des mat´eriaux est caract´eris´ee par
Chapter 1: Introduction 20
le microscope optique et le microscope ´electronique en transmission (MET). La fraction volumique de vides et de particules interm´etalliques des mat´eriaux est quantifi´ee via la tomographie `a rayon X. Les essais de traction sont effectu´es sur les ´eprouvettes de traction lisse et entaill´ee selon diff´erentes directions de sollicitation. Les essais de d´echirure sont r´ealis´es sur des ´eprouvettes de petite taille Kahn, des ´eprouvettes charg´ees en mode mixte Arcan et des grandes plaques M(T). Un mod`ele d´ecrivant l’anisotropie plastique et l’´ecrouissage isotrope est utilis´e, identifi´e sur la base des essais de traction lisse et entaill´ee. Les faci`es de rupture de diff´erentes ´eprouvettes sont examin´es minu-tieusement au niveau macroscopique et microscopique. Le m´ecanisme de rupture est analys´e via le microscope ´electronique `a balayage (MEB) et la tomographie `a rayon X. Enfin, un mod`ele de zone coh´esive est propos´e pour mod´eliser le comportement `a la d´echirure ductile des mat´eriaux. La transf´erabilit´e entre l’´eprouvette de petite taille Kahn et de grande taille M(T) est examin´ee par simulation num´erique.
Structure du m´emoire
Le m´emoire de th`ese se compose de six chapitres et deux annexes. Le chapitre 1 four-nit bri`evement le contexte industriel des d´eveloppements d’alliages aluminium-cuivre-lithium, les motivations de la recherche et les objectives de cette ´etude. Le plan du m´emoire est aussi pr´esent´e dans cette partie. Le chapitre 2 pr´esentera en d´etail les mat´eriaux de l’´etude, la caract´erisation multi-´echelle de la microstructure par les techniques suivantes : microscopie optique, microscopie ´electronique en transmission (MET) ou encore la tomographie `a rayon X. Le chapitre 3 sera con-sacr´e au comportement anisotrope plastique des mat´eriaux. Les essais m´ecaniques et les faci`es de rupture seront analys´es et compar´es minutieusement dans ce chapitre pour les ´eprouvettes de traction lisse et entaill´ee. L’effet d’´epaisseur sur la plasticit´e et la ductilit´e seront examin´es via les r´esultats exp´erimentaux sur les ´eprouvettes de diff´erentes ´epaisseurs. Le vieillissement dynamique est abord´e au travers d’essais de traction `a diff´erentes vitesses. L’identification de l’anisotropie
Chapter 1: Introduction 21
plastique et l’analyse de la localisation de d´eformation seront aussi pr´esent´es dans ce chapitre. Le chapitre 4 se chargera du comportement en d´echirure ductile des mat´eriaux. Trois diff´erents types d’´eprouvettes (Kahn, Arcan et M(T)) seront utilis´es. L’effet d’´epaisseur sur la t´enacit´e sera ex-amin´e via les ´eprouvettes Kahn. Les faci`es de rupture des ´eprouvettes Kahn et M(T) seront analys´es en d´etail via la microscopie ´electronique `a balayage (MEB). Les observations de tomographie en haute r´esolution `a rayon X seront effectu´ees sur les essais Kahn interrompus y compris un traite-ment de gallium pour mettre en ´evidence la structure granulaire. Le chapitre 5 d´ecrira l’analyse et les r´esultats de la mod´elisation de la d´echirure ductile en utilisant un mod`ele de zone coh´esive pour les essais Kahn et M(T). La transf´erabilit´e entre les ´eprouvettes de g´eom´etries diff´erentes et d’´epaisseurs diff´erentes sera ´egalement discut´ee dans cette partie. L’effet d’´epaisseur sera examin´e par la simulation ´el´ements finis via une technique de relˆachement de nœuds sur les ´eprouvettes Kahn. Enfin, le chapitre 6 donnera les conclusions et les perspectives de cette ´etude.
L’annexe 1 donne les dimensions d’´eprouvettes utilis´ees dans ce travail et l’annexe 2 fournira tous les r´esultats des essais m´ecaniques effectu´es dans cette ´etude.
Chapter 2
Materials and Microstructure
In this chapter we will start by a brief introduction of aluminium-copper-lithium alloys. To facilitate discussion on materials’ microstructure, we give a short description of literature survey on metallurgical considerations of Al-Cu-Li alloys and their typical microstructures. Then we will present the materials studied and heat treatments applied in this work. The material microstructure was characterized by various techniques including optical metallographic observation, transmission electron microscopy and X-ray tomography assessment.
2.1
Introduction
2.1.1
Al-Cu-Li alloys
Aluminium-Copper-Lithium alloys are attractive for aerospace applications because they combine strength and damage tolerance along with an increase of the modulus of aluminium and reduction of the density. Each 1 wt % of lithium increases the modulus by about 6% while de-creasing the density about 3% [35, 118]. However, the early promise of property improvements with Al-Cu-Li alloys has not been realized. Even the second generation alloys, which contained around 2% lithium, that came out in the 1980s, experienced a number of serious technical
Chapter 2: Materials and Microstructure 23
lems: excessive anisotropy in the mechanical properties; lower than desired fracture toughness and ductility; hole cracking and delamination during drilling. The anisotropy found in these alloys is associated with the strong crystallographic textures that develop during processing, with the frac-ture toughness problem being one of primarily low strength in the short-transverse (S-T) direction [51]. To circumvent some of these problems, a new generation of alloys has been developed with lower lithium contents. As illustrated in Fig. 2.1, these alloys are generally of a higher Cu/Li ratio than the second generation alloys (2090 and 2091 illustrated in this figure). The factors underlying the choice of Cu and Li concentrations in these T1 (Al2CuLi) precipitate strengthened alloys are
illustrated schematically in Fig. 2.2.
Figure 2.1: Content of Cu and Li in the new generation Al-Cu-Li alloys (2098, 2198 and 2050), compared to second generation Al-Cu-Li alloys 2091 (Al-Li-Cu-Mg-Zr) and 2090 (Al-Cu-Li-Zr). The second generation alloy are presented as dashed boxes, the third generation as solid boxes (after Warner.,[118]).
Chapter 2: Materials and Microstructure 24
Figure 2.2: Schematic illustration of some key property variations as a function of Cu and Li con-centration in Al-Cu-Li alloys (after Warner., [118]).
2.1.2
Metallurgical considerations
According to Cu and Li content, there are a variety precipitation reactions occurring in Al-Cu-Li alloys. For Cu in the range 2 to 5%, three main hardening precipitates can be found.
• For low Li contents (≤ 0.6%) the non-shearable Ω (Al2Cu) phase is present in the presence
of silver [60].
• For medium Li content (≤ 1.0-1.5%) the main hardening phase is T1 (Al2CuLi) [38]. The
hardening effect of this phase is very large and it is promoted by the addition of Cu. T1can
heterogeneously nucleate on subgrain boundaries and dislocations. Its nucleation and growth are favored by the limited addition of Mg and Ag and dislocations formed through cold work prior to artificial aging [22].
• For high Li contents (≥ 1.4-1.5%) δ’ (Al3Li) phase also precipitates during artificial aging
and contributes to strengthening but to a lesser extent than T1[49]; its presence can be
Chapter 2: Materials and Microstructure 25
exposure, (e.g., 1000 h at 85◦C), and may lead to long-term stability issues, if not properly taken into account in the alloy design.
Fig. 2.3 displays the various precipitates observed by Silcock [102] in Al-Cu-Li alloys ac-cording to its Cu and Li contents. Table 2.1 lists the possible precipitates and their form in Al-Li-Cu system. While the Fig. 2.4 gives a schematic view of precipitates and dispersoids that contribute to strength and toughness in AA2099 and AA2199 alloys after Giummarra et al. [39].
Precipitate Composition Form δ’ Al3Li plate θ’ Al2Cu plate S Al2CuMg sticks
Ω Al2Cu plate
T1 Al2CuLi plate
Table 2.1: Possible precipitates and their forms in Al-Li-Cu system.
2.1.3
Dispersoids and Precipitate free zones
In aluminium alloys, Manganese (Mn) is often added to form Al20Cu2Mn3 incoherent
dispersoids as illustrated in Fig. 2.5b. The role of this phase is to help homogenize slip and thereby improve damage tolerance with regards to fracture toughness and fatigue [28]. Mn-bearing disper-soids also help to control grain size and texture evolution during thermo-mechanical processing. Zirconium (Zr) is added to form the coherentβ’ (Al3Zr) dispersoid (see Fig. 2.5a). This is the main
dispersoid used to control recrystallization. In aluminium-lithium, the strengthening δ’ (Al3Li)
Chapter 2: Materials and Microstructure 26
Figure 2.3: Observed precipitates in different Al-Cu-Li systems according Cu and Li contents. (after Silcock., J.M., [102])
Precipitate free zones (PFZ) are commonly situated around grain boundaries as illustrated in Fig. 2.6 observed by ¨Ozbilen [79] in an artificially aged Al-Li-Cu-Mg-Zr alloy. The PFZ’s may appear in all alloys where precipitation reactions occur. Precipitate free zones (or PFZ’s) occur for two reasons [84]: Firstly, the most common reason for the formation of PFZ’s is that precipitates nucleate heterogeneously on vacancies. A grain boundary is a sink for vacancies so that regions adjacent to the boundary are unable to nucleate the precipitates, even though the matrix may be supersaturated with solute. The second reason is the grain boundaries themselves are potent hetero-geneous nucleation sites. Particles may nucleate first at these boundaries, thereby removing suffi-cient solute from the adjacent matrix. The solute-depleted region in the proximity of the boundary therefore remains precipitate-free.
PFZs may be detrimental for the mechanical properties of a material as well as for corro-sion resistance. The yield strength of the PFZ is significantly lower than that of the main matrix. As such, strain concentrations may then occur in PFZs which may result in premature failure, which will especially influence fracture toughness [116].
Chapter 2: Materials and Microstructure 27
Figure 2.4: Schematic of precipitates and dispersoids that contribute to strength and toughness in 2099 and 2199 Al-Cu-Li alloys (after Giummarra et al., [39]).
2.1.4
Constituent phases
In aluminium alloys for structural applications, the coarse intermetallic particles (Al7Cu2Fe and Mg2Si) form during ingot solidification. These intermetallic particles are detrimental to corro-sion, fatigue and fracture toughness. A lower volume fraction of intermetallic compounds improve fracture toughness and fatigue behaviour. For example, the maximum iron content is 0.12% and silicon is 0.10% in 2224 as compared to 0.50% for both impurities in 2024. Due to the high cost of complete removal, these impurities are often limited in a certain range.
Chapter 2: Materials and Microstructure 28
b
0.1 µm
Figure 2.5: TEM micrograph of Zr containing dispersoid particles (a) and Mn containing dispersoid particles (b). The figure (a) refers to an Al-4.8Cu-0.45Mg-0.39Ag-0.14Zr alloy and the figure (b) refers to an Al-4.9Cu-0.46Mg-0.38Ag-0.32Mn alloy (after Cho et B`es, [26]).
Figure 2.6: TEM micrograph of Al-2.3Li-1.8Mg-0.15Zr-0.1Cu alloy associated with a clear PFZ. (after ¨Ozbilen., [79]).
Chapter 2: Materials and Microstructure 29
2.2
Materials studied
AA2198 is a new aluminium-copper-lithium alloy which was developed by the aluminium manufacturer Alcan. It is a candidate alloy for fuselage skins and some components of wings for fu-ture commercial aircraft. Table 2.2 gives the chemical composition limits of AA2198 alloy in weight percent and in atomic percent. AA2198 has lower Lithium content and higher copper content than the first and the second generation Al-Li alloys. The general trend in the Al-Li alloy development is higher copper and lower lithium content than previous Al-Li alloys [57]. The objective of this composition adjustment is to optimise the toughness and strength. It is important to note that the Lithium content of AA2198 in atomic percent is much higher than it’s weight percent. Lithium is the major alloying element when considering atomic percentage.
Cu Li Zn Mn Mg Zr Si Ag Fe
wt. % 2.9-3.5 0.8-1.1 ≤0.35 ≤0.5 0.25-0.8 0.04-0.18 ≤0.08 0.1-0.5 ≤0.01
at. % 1.23-1.48 3.11-4.26 ≤0.14 ≤0.25 0.28-0.88 0.01-0.05 ≤0.08 0.02-0.06 ≤0.05
Table 2.2: Chemical composition limits of AA2198 in weight percent (wt. %) and atomic percent (at. %).
For this work, two grades of 2198 aluminium-lithium alloy sheets with a nominal thick-ness of 2 mm (recrystallized sheet materials) and 6 mm (fibrous sheet materials) were supplied by Alcan Centre de Recherches de Voreppe (Alcan CRV). They are referred respectively to as R (Re-crystallized sheet materials) and F (Fibrous sheet materials) (see Table 2.3). For each grade, two different heat treatment conditions T351 and T851 were studied. Fig. 2.7 shows the heat treatment sequence applied to materials studied. All sheets are first solution heat treated, stretched by between 2-4% and naturally aged to obtain T351 condition materials, then an artificial ageing step was ap-plied to achieve T851 temper materials.
Chapter 2: Materials and Microstructure 30
Homogenization Solutionizing Quenching 2-4% Stretch
Natural Ageing T3 materials
Artificial Ageing T8 materials (40 min at 550◦C) (water) (T–51)
Figure 2.7: Two different heat treatment sequences applied to each grade (recrystallized sheet and fibrous sheet).
For both 6 mm-thick fibrous materials, sheets having a thickness of 2 mm were prepared by slicing the 6 mm sheet into two halves using electrical discharge machining. Each slice was then machined down on both sides to reduce the thickness to 2 mm as proposed in [81, 3] to study thick-ness effect on plasticity and fracture behaviour. Combining heat treatments and thickthick-nesses results in six different sheets for which a nomenclature is proposed in Table 2.3. For brevity, heat treatment T351 will be identified as T3 and T851 identified as T8 in the following, T–51 corresponds to a mechanical treatment (stress relieved by stretching) which was applied after quenching in our case. The difference between recrystallized sheets and fibrous sheets is not only in it’s sheet thickness but also in grain structure which can be seen in the following (cf. section 2.3.2). Thin recrystal-lized sheets are formed by cold rolling while thick fibrous sheets are by hot rolling. Cold rolling is conducted at temperature below the recrystallization temperature, while hot rolling is above the recrystallization temperature to create a finer grain size and less grain directionality.
2.3
Material microstructure
2.3.1
Definition of processing directions
The materials under study are rolled sheets, due to process of rolling which may create an anisotropic microstructure for sheet metal, it is important to define different processing directions