arXiv:0909.1546v1 [astro-ph.SR] 8 Sep 2009
CoRoT photometry and high-resolution spectroscopy of the
interacting eclipsing binary AU Mon
⋆
M. Desmet
1†
, Y. Fr´emat
2, F. Baudin
3, P. Harmanec
4, P. Lampens
2, E. Janot Pacheco
5,
M. Briquet
1, P. Degroote
1, C. Neiner
6, P. Mathias
7, E. Poretti
8, M. Rainer
8,
K. Uytterhoeven
8,9, P. J. Amado
10, J.-C. Valtier
7, A. Prˇsa
11,12, C. Maceroni
13and C. Aerts
1,141Instituut voor Sterrenkunde, K.U.Leuven, Celestijnenlaan 200 D, B-3001 Leuven, Belgium 2Royal Observatory of Belgium, 3 Avenue circulaire, B-1180 Brussels, Belgium
3Institut d’Astrophysique Spatiale, CNRS/Universit´e Paris XI UMR 8617, 91405 Orsay, France
4Astronomical Institute of the Charles University, Faculty of Mathematics and Physics, V Holeˇsoviˇck´ach 2, CZ-180 00 Praha 8, Czech Republic 5Universidade de S˜ao Paulo, Instituto de Astronomia, Geof´ısica e Ciˆencias Atmosf´ericas - IAG, Departamento de Astronomia, Rua do Mat˜ao, 1226 - 05508-900 S˜ao Paulo, Brazil
6Observatoire de Paris - Section de Meudon, Place Jules Janssen 5, 92195 Meudon cedex, France 7UNS, CNRS, OCA, Campus Valrose, UMR 6525 H. Fizeau, F-06108 Nice Cedex 2, France 8INAF - Osservatorio Astronomico di Brera, via Bianchi 46, 23807 Merate (LC), Italy
9Laboratoire AIM, CEA/DSM-CNRS-Universit´e Paris Diderot; CEA, IRFU, SAp, centre de Saclay, F-91191, Gif-sur-Yvette, France 10Instituto de Astrof´ısica de Andaluc´ıa (CSIC), Granada, Spain
11Villanova University, Dept. Astron. Astrophys., 800 E Lancaster Ave, Villanova, PA 19085, USA 12University of Ljubljana, Dept. of Physics, Jadranska 19, SI-1000 Ljubljana, Slovenia 13Osservatorio Astronomico di Roma, via Frascati 33, I-00040 Monteporzio (RM), Italy
14Department of Astrophysics, IMAPP, Radboud University Nijmegen, PO Box 9010, 6500 GL Nijmegen, the Netherlands
Received 8 September 2009; Accepted...
ABSTRACT
Analyses of very accurate CoRoT space photometry, past Johnson V photoelectric photo-metry and high-resolution ´echelle spectra led to the determination of improved and consistent fundamental stellar properties of both components of AU Mon. We derived new, accurate ephemerides for both the orbital motion (with a period of 11.d113) and the long-term, over-all brightness variation (with a period of 416.d9) of this strongly interacting Be + G
semi-detached binary. It is shown that this long-term variation must be due to attenuation of the total light by some variable circumbinary material. We derived the binary mass ratio MG/MB
= 0.17±0.03 based on the assumption that the G-type secondary fills its Roche lobe and rotates synchronously. Using this value of the mass ratio as well as the radial velocities of the G-star, we obtained a consistent light curve model and improved estimates of the stellar masses, radii, luminosities and effective temperatures. We demonstrate that the observed lines of the B-type primary may not be of photospheric origin. We also discover rapid and periodic light changes visible in the high-quality residual CoRoT light curves. AU Mon is put into perspective by a comparison with known binaries exhibiting long-term cyclic light changes.
Key words: stars: binaries: general – stars: binaries: eclipsing – stars: emission-line, Be –
accretion – stars: individual: AU Mon
⋆ Based on photometry collected by the CoRoT space mission as well as
spectroscopy obtained with the FEROS spectrograph attached to the 2.2-m telescope at ESO, La Silla, Chile, under the ESO Large Progra2.2-m2.2-me LP178.D-0361, and with the SOPHIE spectrograph of the Observatoire de Haute-Provence (France). The CoRoT space mission was developed and is operated by the French space agency CNES, with participation of ESA’s RSSD and Science Programmes, Austria, Belgium, Brazil, Germany, and
1 INTRODUCTION
AU Monocerotis was selected as one of the few known bi-nary targets in the asteroseismology field of the French-European
Spain. Based on observations collected at the Centro Astron´omico Hispano Alem´an (CAHA) at Calar Alto, operated jointly by the Max-Planck Institut f¨ur Astronomie and the Instituto de Astrof´ısica de Andaluc´ıa (CSIC).
CoRoT space mission (Convection, Rotation and planetary Tran-sits, Fridlund et al. 2006, see “the CoRoT book”) during the Initial Run (IRa01). We present here a detailed study of AU Mon based on a long, uninterrupted series of high-precision CoRoT photometry obtained in 2008 as well as on high-dispersion ´echelle spectra se-cured at three ground-based observatories in 2007.
AU Mon (HD 50846, HIP 33237) is an interacting, eclips-ing and double-lined spectroscopic binary consisteclips-ing of a Be star and an evolved late-type giant star which in all probability fills its Roche lobe and loses matter towards the Be star. To avoid con-fusion, we shall hereafter denote the gaining and the mass-losing components of AU Mon as the B- and G-stars respectively (We will indeed demonstrate that the cool component is a G-type star rather than an F-G-type star which was its classification based on photographic spectra). The orbit is circular and the or-bital period is 11.d11302 (see O-C diagrams1of Kreiner 2004). AU Mon is a rare Algol-type system member of the W Serpen-tis subclass, phenomenologically defined by Plavec & Koch (1978) and Plavec et al. (1980). These binaries are sometimes also called “massive or hot Algols”. According to current knowledge, they are characterized by a semi-detached configuration and several distinct components of circumstellar matter: a “cloud” of very hot plasma manifesting itself by emission lines in far-UV spectra and probably located outside the orbital plane, a disk, possibly optically thick, which mimics a false photosphere with a lower Teffthan the central star, a gas stream between both components, and a “hot-line region” arising from the interaction of the gas stream and the disk/cloud complex (Bisikalo & Matsuda 2007). We mention only some pub-lished studies of W Ser binaries, relevant to our present work. Elias (1990) studied centimeter observations of 6 different W Ser bina-ries and found very strong evidence for circumstellar matter around these systems. The same was claimed for SX Cas (Andersen et al. 1989) and RX Cas (Andersen et al. 1989) on the basis of photo-metry and spectroscopy. A system which is similar to AU Mon is W Cru, consisting of a B-star and a G supergiant. Pavlovski et al. (2006) found this object to have a very extended accretion disk with a clumpy rim, and suggested that the clumpiness may account for the light curve distortions and asymmetries, as well as for secular changes.
2 PREVIOUS KNOWLEDGE ABOUT AU MON
2.1 Light changes, orbital period and ephemeris
The eclipsing nature of AU Mon was discovered by Hoffmeister (1931). The first ephemeris was published by Florja (1937). Lause (1938) derived a slightly longer value of the period. Lorenzi (1977) observed it and concluded that its light curve was undergoing rapid cyclic changes. He suggested that this could be due to a fast apsidal motion with a period of 243.d2 but also pointed out problems with such an interpretation. Shortly thereafter, Cerruti-Sola & Lorenzi (1977) came up with the correct explanation: the brightness of the whole system varied secularly. To understand the phenomenon, Lorenzi (1980b) secured 2616 V differential observations between 1976 and 1979 at two observatories. From a detailed analysis of these data, Lorenzi (1980a) determined that the brightness of AU Mon varied cyclically with a period of 411 days and a peak-to-peak amplitude of about 0m.2. Taking this variation into account, he derived an improved ephemeris for the binary system:
1 http://www.as.wsp.krakow.pl/o-c/index.php3
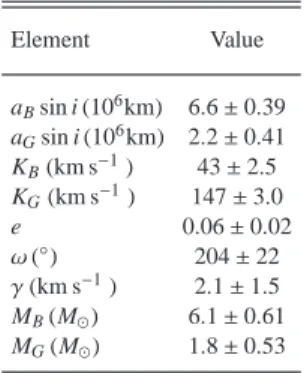
Table 1. Spectroscopic orbital elements for AU Mon derived by Sahade et al. (1997) in a spectroscopic analysis.
Element Value aBsin i (106km) 6.6 ± 0.39 aGsin i (106km) 2.2 ± 0.41 KB(km s−1) 43 ± 2.5 KG(km s−1) 147 ± 3.0 e 0.06 ± 0.02 ω(◦) 204 ± 22 γ(km s−1) 2.1 ± 1.5 MB(M⊙) 6.1 ± 0.61 MG(M⊙) 1.8 ± 0.53 TMin I= JD 2442801.3752(51) + 11.d1130371(68) × E, (1)
which has since been used by various other investigators. Lorenzi (1985) analyzed new observations from 1983 and 1984 and confirmed the periodic character of the brightness variations of AU Mon. A regularly updated ephemeris, based on all compiled times of minima, can be found in the database of the O−C dia-grams (Kreiner 2004)1.
2.2 Spectroscopic investigations
The first spectroscopic study aimed at the determination of the or-bital elements was carried out by Sahade & Cesco (1945). Helped in the spectral classification by Dr. Morgan, they concluded from the spectra, at maximum light and during the eclipse, that the pri-mary is a B5 main-sequence star and the secondary has a spec-tral class near F0. In a later study, Sahade & Ferrer (1982) investi-gated not only ground-based but also the far-UV spectra of the bi-nary obtained with the International Ultraviolet Explorer (hereafter IUE). Faint lines of the secondary were detected in the NaI5889 & 5895 ˚A doublet (Popper 1962) and later on measured quantitatively (Popper 1989). Popper (1962) also noted the presence of a double Hα emission. The first study, partly based on electronic spectra, was published by Sahade et al. (1997). A previous determinations of the orbital elements of AU Mon is listed in Table 1.
The far-UV spectra of AU Mon were obtained by IUE and studied by Polidan & Peters (1982); Peters & Polidan (1982); Peters (1988); Egikyan (1989); Peters (1991, 1994a,b, 1996) and Peters & Polidan (1998). Peters & Polidan (1982) confirmed that the gas stream between the components is seen in the UV resonance lines of NVand CIVin the orbital phase range 0.85 – 0.93, where phase zero corresponds to the time of primary eclipse. Egikyan (1989) found the electron density of the gas in the envelope to be ne∼2·1011cm−3, and the electron temperature to be Te∼20 000 K.
Peters (1988) found a correlation between the instantaneous mass transfer rate and the line and continuum spectrum along the 411-d cycle. At the maximum of the mass transfer rate, the object was fainter and the accretion disk denser while, at the brightness maximum, the high-temperature plasma was more prominent in the UV spectral lines. Analyzing the spectral energy distribution (SED) from the low-dispersion IUE spectra, Peters (1991) con-cluded that the optical brightness variations of the system are due to a 1200 K variation in the photospheric effective temperature of the Be primary. She also suggested the presence of a 10 000 K con-tinuum source from an optically thick accretion disk around the primary to model the SED. Peters (1994a,b) increased the estimate
of the temperature of that source to 12 000 K and suggested that the cyclic variations in the mass transfer rate could be due to pulsation of the mass-losing secondary. Peters & Polidan (1998) obtained a single high-dispersion ORFEUS-SPAS II far-UV spectrum (920 – 1210 ˚A) and concluded that it is typical of a B3 V star (the SED including the IUE data can well be fitted with Teff= 17 000 K and log g = 4.0 [cgs]) with v sin i = 120 km s−1.
Richards & Albright (1999) made an in-depth study of the types of accretion structures found in Algol systems. AU Mon was part of their Hα spectroscopic study. They have put AU Mon in the group with a widely separated double-peaked disk-like struc-ture. They have permanent, but variable, accretion disks similar to those found in cataclysmic variables. Miller et al. (2005) studied the properties of the accretion structures in AU Mon through a mul-tiwavelength spectral study. Double-peaked emission was detected in the observed Hα line confirming the presence of an enduring accretion disk. The strength of the emission varies with epoch.
In a careful study, Glazunova et al. (2008) derived new ro-tational velocities for the components of 23 close detached and semi-detached binaries. For AU Mon , they showed how the pres-ence of circumstellar matter can falsify the determination of the projected rotational velocities. They attempted to avoid the prob-lem and obtained vB sin i = 124 ±4 km s−1, and vG sin i = 42.1
±2.1 km s−1. They also derived the asynchronicity parameter of the B-star, FB= 5.2.
2.3 Published light curve solutions
To date, a few detailed photometric studies of AU Mon have been published. Several attempts, all of which are based on Lorenzi’s ob-servations prewhitened for the 411-d variation, were made to derive light curve solutions, Lorenzi (1982) himself made the first attempt, creating symmetric normal points from his light curve and using the Russell-Merrill method. Independently, and a few months be-fore him, Giuricin et al. (1982) solved the light curve using Wood’s model. Finally, another solution, this time based on the Wilson-Devinney (WD) method (Wilson & Wilson-Devinney 1971; Wilson 1994), was published by Vivekananda Rao & Sarma (1998). These au-thors concluded that no third light is present in the system. The main results of these studies are summarized in Table 2. We note a good agreement between the first and the third solution, which are based on two independent computer programmes.
3 THE NEW PHOTOMETRIC DATA AND THEIR
ANALYSIS
The new photometric data set consists of a continuous series of 139704 individual CoRoT photometric observations spanning an interval of 56 days, i.e., 5 orbital periods2. The spectral domain of CoRoT enfolds the range from 370 to 950 nm, the average time sampling was 32 s and roughly 10% of the datapoints were deleted because they were extreme outliers. An estimate of the noise level of the light curve, computed as the average of the periodogram be-tween 80 and 120 d−1 is 60 µmag. In addition to the CoRoT data, we critically compiled and homogenized all published photoelec-tric observations with known dates of observations as well as all available times of minima known to us and derived 6 new times of
2 The CoRoT data of AU Mon are public and can be accessed at http://idoc-corot.ias.u-psud.fr/
Table 2. Published light curve solutions based on Lorenzi’s 1980b obser-vations. The symbol q = MF/MBstands for the mass ratio while the sym-bols a, b, and c denote the relative dimensions of the triaxial ellipsoids, and the back, side, and pole radii for the WD model. The following codes are used to identify the authors: GMM82... Giuricin et al. (1982); L82... Lorenzi (1982); VRS98... Vivekananda Rao & Sarma (1998).
Element GGM82 L82 VRS98 i (◦) 78.4±0.5 80 assumed 78.74±0.06 rB 0.115±0.013 0.18 0.131±0.001 rF – 0.18 – aF 0.267±0.056 – 0.2741±0.0034 bF 0.242±0.038 – 0.2417±0.003 cF 0.232±0.031 – 0.2324±0.0031
Teff(B eq.) (K) 15 000 assumed 15500 assumed 14500±1000
Teff(B pole) (K) 15 010 – – Teff(F eq.) (K) 6 600±150 5300 6000±40 Teff(F pole) (K) 16 860 – – q 0.2 – 0.1985 LB 0.645 0.93 0.6590±0.0051 LF 0.355 0.07 0.3410
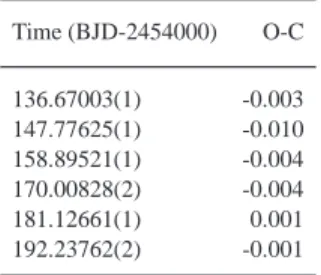
Table 3. The 6 new times of minima for AU Mon derived from the CoRoT data. The O-C values were calculated with our new ephemeris (2) for AU Mon. Time (BJD-2454000) O-C 136.67003(1) -0.003 147.77625(1) -0.010 158.89521(1) -0.004 170.00828(2) -0.004 181.12661(1) 0.001 192.23762(2) -0.001
primary minima from the CoRoT light curve. Table 3 lists the 6 new CoRoT minima. The published visual, photographic, photoelectric and CCD times of minima, reproduced in Table A1, were obtained from the General Search Gateway of the Variable-Star Section of the Czech Astronomical Society3where also references to original observers can be found.
3.1 Time-series analysis and new ephemeris
Fig. 1 shows the complete set of CoRoT observations vs. HJD. We converted CoRoT fluxes (F) to magnitudes (m) using m =
−2.5 log F + C0, with C0 a calibration constant. We derived C0 through a comparison between CoRoT magnitudes and visual mag-nitudes from literature for all constant stars in the CoRoT field of AU Mon. This gives a value of C0= 23.16 ± 0.05 mag.
First, we verified that Lorenzi’s ephemeris (1) can reconcile both the compiled published photometry and the CoRoT data. Con-sequently, we used his ephemeris for the initial analyses. In the final modelling of photometry and radial velocities (RV hereafter) with
thePHOEBEprogramme, described in Sect. 5, we derived the
fol-lowing improved orbital ephemeris
8.3 8.4 8.5 8.6 8.7 8.8 8.9 9 9.1 130 140 150 160 170 180 190 Magnitude Time (HJD−2454000) 8.3 8.4 8.5 8.6 8.7 8.8 8.9 9 9.1 130 140 150 160 170 180 190 Magnitude Time (HJD−2454000) 8.35 8.4 8.45
Figure 1. The complete CoRoT light curve of AU Mon. The upper panel shows an enlarged segment of the curve with very clear rapid non-orbital variations. The noise on the data is smaller than the symbol.
Tmin I= HJD 2454136.6734(2) + 11.d1130374(1) × E. (2)
We collected all the available photoelectric observations of AU Mon and put them onto a comparable photometric system. The journal of all observations is shown in Table 4, the data itself can be found in Table B1. We converted the uvby data to Johnson U BV us-ing the transformation derived by Harmanec & Boˇzi´c (2001). The Hipparcos data were transformed to the V magnitude of the John-son system using the transformation formula derived by Harmanec (1998). Fig. 2 shows the phased V light curve based on all the pub-lished observations we could collect from the literature, including the 2698 observations provided by Lorenzi (1980b, 1985). We can observe a systematic shift between two extreme states of the max-imum light (at the levels of 8.2 and 8.4 mag respectively) as well as of the primary minima (at the levels of 9.0 and 9.2 respectively). This effect is clearly due to the long-term periodicity reported by Lorenzi (1980a, 1985).
Subsequently, using subsets of V data sorted into narrow orbital-phase bins, as well as all the V data outside of the phase of primary minimum, we carried out a period search using the PDM (Stellingwerf 1978) and the CLEAN (Roberts et al. 1987) methods. Both algorithms yielded the same value of Plong = 417 ± 8 days.
Fig. 3 shows the V magnitude outside minima plotted versus phase of the 417-d period. Our linear ephemeris for the total brightness of the system reads as follows
Tmax.tot.brightness= HJD 2443105.1(±1.4) + 416.d9(±8.d7) × E. (3)
This also means that the CoRoT light curve was collected at a phase of total light minimum (in the phase range from 0.46 to 0.59).
The V-band light curves were inspected at the phases of light minima and maxima. The two curves are only shifted for about 0m.2 with respect to each other (see Fig. 2) but havethe same shape and amplitude, as already concluded by Cerruti-Sola & Lorenzi (1977). This was confirmed by tentative light curve solutions for both curves, which led to the same values of stellar radii and or-bital inclination. This result does not support the idea promoted by Peters (1991), that the observed changes could be related to appar-ent changes in the Teffand radius of the B-star’s false photosphere. If the 417-d variation were caused by some variable third light, then the eclipses should become shallower at the 417-d light maxima. Similarly, a precession of the orbit would lead to a changing orbital inclination. Since none of all these effects is present, we conclude
8.2 8.4 8.6 8.8 9 9.2 0 0.2 0.4 0.6 0.8 1 V(mag) Phase
Figure 2. Original V-band light curve phased against the period of 11.1130374 days. −0.7 −0.6 −0.5 −0.4 −0.2 0 0.2 0.4 0.6 0.8 1 1.2 U−B (mag) Phase (416.9 d) 0 0.05 0.1 0.15 0.2 B−V (mag) 8.1 8.2 8.3 8.4 8.5 V (mag)
Figure 3. The V magnitude of AU Mon outside minima plotted vs. phase of the 417-d period (top). The B − V and U − B colour changes along the 417-d cycle of AU Mon are shown in the middle and bottom panel (see Sect. 8 for details).
that the long-term variation must be caused by a periodic attenua-tion of the total light of the binary by some variable circumbinary matter. The reason why we do not see emission lines coming from this circumbinary envelope might be that the envelope is cool and dusty. Probably, this huge envelope will also have a small rotational speed. Thus its emission will be blended with the stronger emission from the circumstellar matter.
Table 4. Journal of available photometry of AU Mon with known times of observations.
Station Time interval No. of Passbands HD of comparison Source
(HJD−2400000) obs. / check star
1 42790.3–42879.3 278 V 50109/50346 Lorenzi (1980b)
2 43023.6–43843.4 2143 V 50109/50346 Lorenzi (1980b)
3 43877.7–43880.9 195 V 50109/50346 Lorenzi (1980b)
4 44284.4–44287.4 13 B−V all-sky Kilkenny et al. (1985)
4 44288.3–44289.4 2 UBV all-sky Kilkenny et al. (1985)
4 44677.3–44678.3 2 UBV all-sky Kilkenny et al. (1985)
5 45254.9–45322.8 14 uvby 50747/50820 Manfroid et al. (1991)
2 45343.4–45790.4 82 V 50109/50346 Lorenzi (1985)
6 47987.4–49056.1 81 Hp all-sky Perryman & ESA (1997)
7 54136.0–54192.8 139704 COR all-sky this paper, Corot
Individual observing stations and photometers distinguished by the running numbers in column“Station”:
1... Torino Observatory 1.04-m reflector, EMI 9502 tube; 2... Torino Observatory 0.60-m reflector, EMI 6256S tube; 3... Cerro Tololo 0.40-m reflector, EMI 6256 tube; 4... South African Astronomical Observatory (SAAO) 1.0-m & 0.5-m telescopes, EMI 6256 & 9659 tubes; 5... European Southern Observatory La Silla telescope; 6... Hipparcos Satellite; 7... Corot Satellite.
4 SPECTROSCOPIC ANALYSIS AND RADIAL
VELOCITIES
4.1 Initial analysis of the spectra
New high-dispersion spectroscopic observations were obtained si-multaneously with the CoRoT data over three consecutive orbital periods of AU Mon. They were carried out in the framework of the CoRoT ground-based follow-up programme (Uytterhoeven et al. 2008). The data we used here consist of 16 FEROS ´echelle spec-tra (R∼48000, Kaufer et al. 1997, 1999) from the 2.2-m ESO/MPI telescope at LaSilla, Chile, 11 well-exposed ´echelle spectra secured with the SOPHIE spectrograph (R∼70000, Perruchot et al. 2008) attached to the 1.93-m telescope of the Haute Provence Observa-tory, and four spectra taken with FOCES (R∼65000, Pfeiffer et al. 1998) at Calar Alto Astronomical Observatory. The journal of ob-servations, together with adopted radial velocities, is given in Ta-ble 5.
All data were subjected to the normal reduction process, which consists of de-biasing, background subtraction, flat-fielding and wavelength calibration. All the reduced spectra were subse-quently shifted to the heliocentric frame. Continuum rectification and cosmic-spike removal were carried out manually using the SPEFO programme (Horn et al. 1996; ˇSkoda 1996), written by the late Dr. Jiˇr´ı Horn and until recently being developed by Mr. J. Kr-pata4.
To have some guidance before application of more sophisti-cated methods, we first derived the RVs via classical measurements. Using the programme SPEFO we carefully rectified all red parts of the spectra (between 5500 and 6700 ˚A) and cleaned them from cos-mics and flaws. The RVs of both components were then measured comparing the direct and flipped line profiles. For the G-star, we measured CaI6102.723 ˚A, FeI6141.730 ˚A, and FeI6400.000 ˚A which are all well-defined, unblended, and relatively strong spec-tral lines. The r.m.s. errors of the mean RV of these 3 lines ranged from 1 to 4 km s−1. The corresponding orbital RV curve is shown by black circles in Fig. 4. The only strong and unblended line which seems to be related to the B-star in the studied red wavelength range is HeI5875.732 ˚A (open circles in Fig. 4). For the Hα line (red dots in Fig. 4), the setting was made on the steep wings of the double
4 Mr. J. Krpata passed away on February 6, 2009
Table 5. Radial velocities measured from the FEROS (FE), SOPHIE (SO) and FOCES (FO) data. The RVs of the G-star were derived via 1-D cross-correlation of suitable parts of the red wavelength region while the B-star RVs were derived near 4000 ˚A using a 2-D TODCOR-type cross-correlation. The last three RV columns are the measurements carried out in SPEFO – see the text for details. The last column denotes the instrument.
HJD − S/N RVB RVG RVHeI RVG RVHα I. 2454000 (km s−1) (km s−1) (km s−1) (km s−1) (km s−1) 76.6493 95 23.3± 4.2 -76.74± 3.60 41.4 -76.3 13.0 FO 76.6697 112 26.6± 3.1 -80.23± 4.06 42.7 -78.7 16.0 FO 78.6665 86 49.8± 4.4 -129.55± 3.15 78.2 -121.2 33.1 FO 78.6902 86 59.5± 6.2 -128.60± 2.84 91.3 -127.0 43.8 FO 103.7806 117 -6.553± 6.939 55.94± 1.73 26.9 56.4 -2.7 FE 104.6490 105 -2.108±10.153 121.79± 1.04 0.6 124.8 14.2 FE 104.8285 98 -7.657± 8.524 132.61± 1.36 14.0 137.3 11.2 FE 105.6557 107 -14.990± 9.559 168.19± 3.30 -7.5 175.2 1.7 FE 105.8796 118 -15.247± 8.629 172.65± 2.37 -20.1 174.6 3.4 FE 106.6320 76 -14.334± 7.206 171.27± 1.57 1.9 173.4 6.1 FE 106.8208 103 -16.287± 6.911 164.85± 1.78 -17.3 168.3 9.1 FE 107.7008 124 -10.859± 4.584 125.02± 2.30 -10.3 126.1 -24.3 FE 108.7038 129 -2.453± 0.644 42.17± 4.11 2.0 44.6 1.2 FE 108.8141 101 3.384± 3.488 28.12± 3.99 3.0 30.2 -5.2 FE 108.8739 159 0.963± 2.589 18.01±11.45 1.8 26.1 -6.7 FE 109.6744 93 16.264± 4.232 -57.97± 2.87 23.1 -55.0 15.1 FE 110.5600 125 36.924± 3.668 -111.92± 2.67 35.7 -105.7 27.2 FE 113.3762 72 26.498± 3.610 -65.29± 1.88 51.9 -59.4 74.2 SO 114.3554 38 19.044± 5.689 12.74± 1.48 90.7 15.2 61.4 SO 115.3513 41 -2.481± 4.473 94.00± 2.63 20.3 92.5 30.7 SO 118.3702 60 -13.448± 7.440 150.47± 2.79 -26.5 150.7 -2.8 SO 119.4596 53 -5.039± 5.894 79.44± 3.00 -13.3 90.6 -23.9 SO 121.3731 59 26.867± 7.542 -95.42± 3.96 18.2 -88.1 41.3 SO 125.7931 99 -37.327± 7.089 37.10± 2.34 7.2 41.0 31.6 FE 127.6520 103 -12.026± 9.820 161.75± 1.50 2.2 164.5 2.0 FE 128.3489 58 -9.204± 2.343 174.38± 1.69 7.5 177.8 – SO 128.6499 115 -13.868± 7.290 174.36± 2.42 -2.2 177.3 -10.0 FE 129.3422 64 -13.363± 6.859 155.57± 2.06 -6.6 158.1 -16.8 SO 130.3320 62 -2.870± 7.891 98.79± 1.55 2.5 98.4 -28.0 SO 131.3412 69 8.946± 1.713 -9.75± 4.66 5.8 -2.3 0.2 SO 132.3469 57 27.212± 6.149 -87.30± 1.37 18.5 -85.9 19.4 SO
−150 −100 −50 0 50 100 150 200 −0.2 0 0.2 0.4 0.6 0.8 1 1.2 Radial Velocities (km s −1 ) Phase
Figure 4. The RV curves of the late-type G-spectrum (black dots), B-spectrum (open circles) and the Hα emission wings (red dots) measured in SPEFO. One can see that the B-spectrum RV, based on the HeI5876 ˚A, and that of the Hα emission wings, define similar RV curves which are both shifted in phase with respect to the expected RV curve of the G-component.
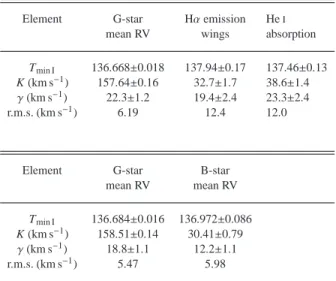
Table 6. Trial circular-orbit solutions for the direct RV measurements in SPEFO (top). FOTEL circular-orbit solutions for the RV measurements via cross-correlation of selected segments of the spectra as described in Sect. 4.4 and tabulated in Table 5 (bottom). The orbital period was kept fixed at 11.d1130374. The epoch of the primary minimum is in HJD-2454000, r.m.s. is the r.m.s. error of 1 observation.
Element G-star Hα emission HeI
mean RV wings absorption
Tmin I 136.668±0.018 137.94±0.17 137.46±0.13 K (km s−1) 157.64±0.16 32.7±1.7 38.6±1.4
γ(km s−1) 22.3±1.2 19.4±2.4 23.3±2.4
r.m.s. (km s−1) 6.19 12.4 12.0
Element G-star B-star
mean RV mean RV
Tmin I 136.684±0.016 136.972±0.086 K (km s−1) 158.51±0.14 30.41±0.79
γ(km s−1) 18.8±1.1 12.2±1.1 r.m.s. (km s−1) 5.47 5.98
emission and the measurements were carried out only when a reli-able setting was possible.
The RV curve of the G-star is well defined and appears sinu-soidal. To check on the presence of a possible small eccentricity, we first derived trial solutions for an elliptical orbit using the pro-grammes SPEL (unpublished, written by the late Dr. J´ıˇr´ı Horn) and FOTEL (Hadrava 1990, 2004a). We obtained e = 0.045 ± 0.006,
ω= 93.◦
5 ± 7.◦
2, and KG = 156.71 ± 0.92 km s−1and the test sug-gested by Lucy & Sweeney (1971) indicated that the eccentricity is significant. However, we do believe that the orbitis circular and the eccentricityis spurious, caused by a small difference between the photocentre of the Roche-lobe filling star and its centre of grav-ity and/or by the Rossiter - McLaughlin effect (as detailed in Sect. 6). It was pointed out by Harmanec (2001, 2003) that any
distur-Table 7. Basic properties of AU Mon estimated from spectroscopy (see the text for details). The values of v sin i were derived using the disentangled spectra (see Sect. 4.3), the semi-amplitude KG = 157 − 159 km s−1 was derived from our spectra and the orbital inclination was assumed to be in the range from 77◦to 83◦(see Sect. 5).
B-star G-star Teff 15000±2000 K 5750±250 K log g 3.5±0.3 – M 6.37+2.18 −1.12M⊙ 1.17+0.19−0.19M⊙ R 7.15+5.77 −2.92R⊙ 9.7+0.6−0.6R⊙ Vsynch.eq. 32+26−13km s −1 – v sin i 116±2 km s−1 43.8±3.5 km s−1 q = MG/MB 0.17+0.03−0.03
bance of the sinusoidal shape of the RV curve which is symmetric with respect to the systemic velocitymust lead to a formally eccen-tric orbit with a longitude of periastron of either 90◦
or 270◦
. This is exactly what we found. Note also that for these orientations of the binary orbit, the photometric minima are separated for exactly one half of the orbital period so that even very accurate photometry cannot provide an additional test.
Using FOTEL (Hadrava 1990, 2004a), we therefore derived a trial circular-orbit solution for the G star, which is compared to formal solutions for the RVs of the Hα emission wings and HeI5876 ˚A absorption in Table 6. The epoch of the primary min-imum derived from the G-star RVs agrees with that of (photo-metric) ephemeris (2). In contrast to this, the RV curve of the HeI5876 ˚A absorption and Hα emission are mutually similar but shifted in phase with respect to the clean anti-phase orbital mo-tion of the G-component. Popper (1989) also suggested such be-haviour. All this is the situation reminiscent of another W Ser star with a similar orbital period of 12.d9, namely β Lyr, where such a behaviour is due to the fact that the absorption and emission lines originate in bipolar jets emanating from the region of interaction of the gas streams (Harmanec et al. 1996). This may imply that we do not see really photospheric lines of the hot mass-gaining star of AU Mon.
4.2 Mass ratio and secondary mass
To cope with the above problem, we attempted to obtain some esti-mate of the mass ratio independent of the B-star’s RV curve. Since the contact components of semi-detached binaries usually rotate synchronously with their revolution (see e.g. Harmanec 1988), we made this assumption also for AU Mon and used the procedure devised by Andersen et al. (1989) as detailed in the Appendix of Harmanec (1990) to obtain an independent estimate of the mass ratio (q), component masses and the radius (RG) of the Roche-lobe filling secondary. Its principle lies in the fact that the relative dimen-sions of the Roche lobe depend solely on the binary mass ratio q while the absolute radius of the spin-orbit synchronized secondary is uniquely given by its equatorial rotational velocity, inclination i of its rotational axis (assumed to be identical to the inclination of the orbit) and by the rotational (=orbital) period. The binary sep-aration is given by the third Kepler law so that there is only one mass ratio for which the secondary is just filling the corresponding Roche lobe. We assumed a circular orbit, KG= 158 ± 1 km s−1and a range of orbital inclinations from 77 to 83o(see Sect. 5). We took
the uncertainties of the parameters KG, v sin i, and Porb.(used in the procedure) into account to provide the error estimates of the result-ing values of q, MG, and RG. The results are listed in Table 7. The mass ratio of AU Mon equals q = 0.17 ± 0.03. Our results agree with Vivekananda Rao & Sarma (1998, see Table 2). Sahade et al. (1997) found a mass ratio of q = 0.29 which is much larger com-pared to any other study. This is due to their usage of the value of KB, which is probably too optimistic. As Fig. 7 shows, their
B-spectrum RVs, from phase 0.0 to 0.5, are much more negative than any other recorded RVs. Moreover, our separate circular-orbit so-lutions for their B- and G-spectrum RVs give systemic velocities of 1.6 ± 2.1 km s−1, and 5.4 ± 3.3 km s−1, differing quite substantially from the systemic velocity found by us and in all other previous studies.
4.3 Spectra disentangling and spectral type classification To separate the spectra of both binary components in an objective way, we used the disentangling procedure developed by Hadrava (1995, 1997, 2004b, see references therein – Release 2.12.04 of theKORELprogramme made available to YF). The disentangling was applied to different parts of the spectra. The orbital period was fixed at the value derived by Lorenzi (1980a, see ephemeris (1) of the present paper) and a circular orbit was assumed.
Within the parameter range we investigated, the disentangled spectra were sufficiently stable to permit to derive the projected ro-tation velocity and the effective temperature of both stars. We there-fore disentangled the 5500–5700 ˚A, 6125–6275 ˚A, and the 4000– 4200 ˚A wavelength intervals. Eleven isolated lines were selected in the secondary’s spectrum and two in the primary spectrum, and we estimated the components’ v sin i by measuring the position of the first zero of the line profiles Fourier transform (Royer et al. 2002). The values we found are given in Table 7 and are in good agree-ment with those measured by Glazunova et al. (2008), who tried to avoid the effects linked to the presence of the companion and of the circumstellar matter. Though our result for the primary is somewhat smaller, the difference is not significant regarding the scatter and the small number of lines available in fast rotating early-type stars to carry out such kind of analysis. We then compared the component spectra to synthetic ones, computed for different effec-tive temperatures by means of theATLASLTE model atmospheres (Castelli et al. 1997; Castelli & Kurucz 2003) and the SYNSPEC (Hubeny & Lanz 1995) programme. This comparison was done in the red wavelength ranges for the secondary, while we mainly fo-cused on the bluest range for the primary. Since the studied spec-tral ranges do not show any strong log(g)–dependence, the surface gravity of the secondary (expected to be evolved) was fixed to log g = 2.5.
Furthermore, we assumed a microturbulence of 2 km s−1and a solar chemical composition. Since we used the hydrogen and he-lium stark-broadened line profiles for the B-star, our conclusions are in this case not significantly affected by these assumptions. For the G-star, spectra for different iron content (i.e. within 0.2 dex of the solar abundance) and within 2 km s−1of the adopted microtur-bulent velocity were computed and analysed. The differences be-tween the models with different iron abundances were found to be smaller than those obtained by using different effective tempera-tures within the estimated error bar of 250 K. Usually a change in microturbulence affects more significantly the spectrum. How-ever, the weaker lines which are present in the different wavelength ranges we have analyzed, and falling in the linear part of the curve of growth, are not affected by a change in microturbulence. These
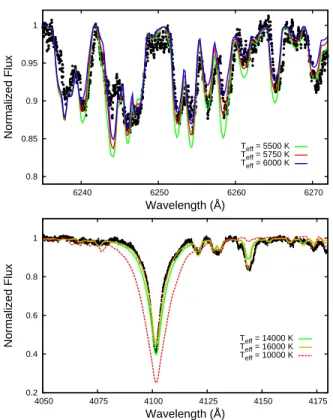
0.2 0.4 0.6 0.8 1 4050 4075 4100 4125 4150 4175 Normalized Flux Wavelength (Å) Teff = 14000 K Teff = 16000 K Teff = 10000 K 0.8 0.85 0.9 0.95 1 6240 6250 6260 6270 Normalized Flux Wavelength (Å) Teff = 5500 K Teff = 5750 K Teff = 6000 K
Figure 5. Comparison between synthetic spectra computed for different effective temperatures and the observed disentangled spectrum (black dots) of the cool G-component (upper panel) and the B-component (lower panel). The best fitting temperatures for the G and B-star are 5750 K and 15000 K respectively. The absorption lines around 4070 ˚A are coming from an A0 spectrum (extended photosphere) and are best reproduced with a spectrum of 10000 K.
lines were also used to estimate the effective temperature of the G-star and a good agreement was found between synthetic and ob-served spectra.
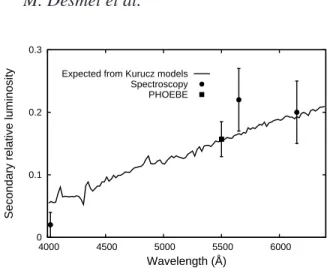
In Fig. 5, one can see the comparison between the disentan-gled and synthetic spectra for a selected wavelength range for the two components. The luminosity ratios we estimated in different wavelength domains are plotted in Fig. 6, while the astrophysical parameters we obtained are listed in Table 7. As a byproduct of the disentangling procedure we obtained the RVs for both components (see Fig. 7). For comparison matters, we further assumed a non-perturbed stellar evolution and a solar-like metallicity. To determine the mass, radius and equatorial rotation velocity at orbit synchro-nization of the B-star we made use of the evolutionary tracks cal-culated by Schaller et al. (1992). We interpolated the mass and ra-dius for the effective temperature and surface gravity of the B-star throughout these evolutionary tracks. The results of this method can be seen in Table 7. The errors on MBand RBare unfortunately too large to determine the age of the star. Our result firmly estab-lishes that the cooler star is a bright G-giant, and not an F-star as was tentatively classified in the past.
From the lower panel of Fig. 5 we see that the agreement be-tween the best synthetic and observed spectra for the B-star is not perfect. The B-star spectrum is clearly affected by the circumstellar matter that acts like an extended photosphere and produces addi-tional absorption lines generally found in A0 stars (Teff ∼10000 K; spectral lines around 4075 ˚A are coming from the A0 star spec-trum).
0 0.1 0.2 0.3
4000 4500 5000 5500 6000
Secondary relative luminosity
Wavelength (Å)
Expected from Kurucz models Spectroscopy PHOEBE
Figure 6. The expected wavelength dependence of the relative luminosity of the G-star to the total light of the system. We assumed effective tempera-tures of 15000 K and 5750 K for the B primary and the G secondary, respec-tively. The full line is based on Kurucz’ models. The light contribution at 6150 ˚A was fixed at 0.2. The luminosity ratio was estimated from detailed comparisons of the observed and synthetic spectra at several distinct wave-length regions and these values are shown by black dots with errors. The black square with an error box represents the luminosity ratio in the V band based on thePHOEBEsolution.
4.4 Determination of RVs from whole segments of spectra Since the motion of the circumstellar matter seems to be phase-locked with the orbital motion of the B-star, and the companion is a G-star with many weak but sharp spectral lines, the radial velocity determination for the G-star is quite straightforward. To avoid sys-tematic effects due to the presence of spectral lines belonging to the B-star, we concentrated on the 5500–5850 ˚A wavelength region and carried outa 1-D cross-correlation of the observations with a syn-thetic spectrum computed for the stellar spectral classes derived in Sect. 4.3. (See David & Verschueren 1995, for the correlation max-imum location.). To estimate the accuracy of our measurements, the cross-correlation was performed separately on 7 subparts of this spectral range, each sub-region providing one set of radial velocity measurements. In Table 5 we provide the mean RVs obtained from those 7 regions and their r.m.s. errors.
Due to the orbiting circumstellar matter and the fewer lines present in the spectrum of early-type stars, the RVs of the B pri-mary are much more difficult to measure. The systematic study of the whole available wavelength range shows a large scatter due to: 1. the lack of spectral lines, 2. the presence of a third spec-trum related to the matter orbiting the primary B-star (and show-ing lines generally formed in A0 stars) or/and due to bipolar jets or disk/stream interactions (see Sect. 4.1). The best wavelength re-gion candidate for the measurement of the primary’s radial veloc-ities is the one that encompassed the HeI4009 and 4026 ˚A lines where the effects of the (cooler) third (‘A0’) spectrum seem to be absent. Note that the G-star is more than 3 magnitudes fainter at these wavelengths according to Fig. 6. Still, to reduce any system-atic effect due to the faint G-star spectrum, we used a TODCOR-like procedure (Zucker & Mazeh 1994) using templates that reflect the spectral types of the components (see Sect. 4.3). This operation was carried out several times using different templates for the pri-mary, with the astrophysical parameters falling within 1-σ of the estimated values in order to have an estimate of the accuracy of the procedure. The results are given in Table 5 and compared to other published measurements in Fig.7.
−200 −150 −100 −50 0 50 100 150 200 0 0.2 0.4 0.6 0.8 1 Radial Velocities (km s −1 ) Phase Au Mon B (Sahade et al. 1997)
Au Mon G (Sahade et al. 1997)Au Mon B (Popper 1989) Au Mon G (Popper 1989)Au Mon B (KOREL) Au Mon G (KOREL)Au Mon B (SPEFO) Au Mon G (SPEFO) −150 −100 −50 0 50 100 150 200 PHOEBE model Au Mon G (1D Cor)Au Mon B (Todcor)
Figure 7. Radial velocities obtained in this study by various methods (SPEFO, TODCOR, 1D CC,KOREL) compared to published values. The top panel shows our new and final RVs for sake of clarity, the bottom panel shows the comparison. The black line shows the finalPHOEBEmodel for the G-star. The residuals for the G-star are pictured in Fig. 11.
We also derived FOTEL circular-orbit solutions for these RVs. The results are shown in Table 6. One can see that the so-lution for the G-star agrees reasonably well with that based on the directly measured RVs (see Table 6). The solution for the B-star RVs again shows a phase shift with respect to the expected instant of the primary minimum and a significantly lower systemic veloc-ity. The K-value for the B-star agrees within the errors with the K-value estimated from our principal analysis (see Table 6). Nev-ertheless, because of the phase- and systematic velocity shift, we will not use the RV curve of the B-star in the determination of the binary physical properties.
5 MODELLING OF THE LIGHT AND RV DATA
In order to derive physical properties from the combined light and radial velocity curves, we used thePHOEBEprogramme, release 031dev (with phoebe-gui-cairo, Prˇsa & Zwitter 2005) built on the 2003 WD method (Wilson & Devinney 1971; Wilson 1990), to per-form the linearised least-squares analyses with the differential cor-rections approach. We assumed a semi-detached system configu-ration (using Mode 5) and no third light nor spots were included. From previous considerations, we decided to rely only on the spec-troscopic estimation of the mass ratio and the RVs of the G-star for this modelling. We also fixed the effective temperature of the G-star at the value of 5750 K, since this value was reliably derived from the disentangled spectra (see Sect. 4.3).
The orbital period of 11.d113037 was initially fixed. For the bolometric albedos, ABand AG, and the gravity darkening coef-ficient, GB, we used their theoretical values corresponding to the type of atmosphere and to the spectral types of both stars (see e.g. Vuˇckovi´c et al. 2007). For the gravity darkening coefficient GG, we had to adopt a value of 0.9, i.e. much higher than the theoretical value of 0.32, to obtain a satisfactory fit with the data. This value
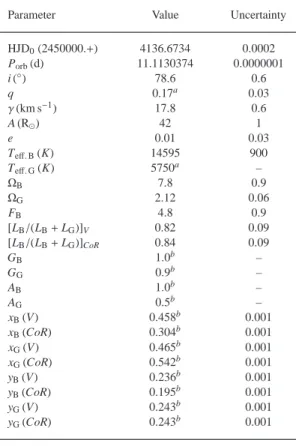
Table 8. Parameters of AU Mon together with their formal 3σ uncertain-ties (standard deviations) resulting from the combinedPHOEBEsolution for photometry and RVs.
Parameter Value Uncertainty
HJD0(2450000.+) 4136.6734 0.0002 Porb(d) 11.1130374 0.0000001 i (◦) 78.6 0.6 q 0.17a 0.03 γ(km s−1) 17.8 0.6 A (R⊙) 42 1 e 0.01 0.03 Teff. B(K) 14595 900 Teff. G(K) 5750a – ΩB 7.8 0.9 ΩG 2.12 0.06 FB 4.8 0.9 [LB/(LB+ LG)]V 0.82 0.09 [LB/(LB+ LG)]CoR 0.84 0.09 GB 1.0b – GG 0.9b – AB 1.0b – AG 0.5b – xB(V) 0.458b 0.001 xB(CoR) 0.304b 0.001 xG(V) 0.465b 0.001 xG(CoR) 0.542b 0.001 yB(V) 0.236b 0.001 yB(CoR) 0.195b 0.001 yG(V) 0.243b 0.001 yG(CoR) 0.243b 0.001
Roche Radii [in units of orbital separation]
rB(pole) 0.12 0.02 rB(point) 0.14 0.02 rB(side) 0.14 0.02 rB(back) 0.14 0.02 rG(pole) 0.22 0.02 rG(point) 0.31 0.02 rG(side) 0.23 0.02 rG(back) 0.26 0.02 Absolute dimensions log gB 3.78 0.09 log gG 2.50 0.03 Mbol,B(mag) −3.1 0.6 Mbol,G(mag) −0.25 0.11 MB(M⊙) 7.0 0.5 MG(M⊙) 1.2 0.3 RB(R⊙) 5.6 0.8 RG(R⊙) 10.0 0.8
aadopted from spectroscopy bassumed
lies very close to the value expected for a radiative envelope. The limb darkening coefficients x and y of the B- and G-stars were taken from Castelli & Kurucz (2004) for the Johnson V curve while new limb darkening coefficients specifically computed for the CoRoT passband, which are now implemented inPHOEBE(rel. 031dev), were used. The CoRoT limb darkening coefficients were derived
from a specific extension of the tables of van Hamme (1993) for the CoRoT transmission function (Fridlund et al. 2006), and computed by Van Hamme (private communication). The method is described in van Hamme (1993), it is a convolution of the outgoing intensi-ties with the CoRoT transmission curve for different angles. The errors on x (CoR) and y (CoR) coming from this method are 0.001. The heliocentric Julian epoch of the primary minimum, HJD0, the effective temperature of the B-star, Teff. B, the inclination, i, the di-mensionless potential, ΩB, the fractional luminosity of the B-star,
LB, the systematic velocity, γ, and the eccentricity, e, were all set as adjustable parameters. For the asynchronicity parameter, FB, we
used 4 ± 1 since the projected rotational velocity of the primary component appears to be ≈ 4 times the estimated synchronous ve-locity (which amounts to 30 ± 15 km s−1if we adopt the B-star’s ra-dius from the solution presented below). We also checked whether leaving FBas a free parameter improved our model. This was not
the case.
For practical reasons mainly, we constructed 10 different sub-sets from the CoRoT light curve. Given that the CoRoT light curve of AU Mon was largely oversampled, we have split the continuous time-series into 2 × 5 full orbital cycles selecting either even or odd data points in time, thus yielding 2 × 5 different CoRoT data subsets. In this way, no information was lost and we were able to obtain formal errors based on 10 independent subsets of the data. Thus, the 10 CoRoT data subsets, all the compiled V-magnitude photoelectric observations and the 1D cross-correlation RVs of the G-star from Table 5 were used in an iterative procedure to search for a consistent model. Of course the CoRoT data are of much higher quality compared to the V-band light curve which is reflected in the scatter (uncertainties) on the data.
First, we simultaneously modelled each individual CoRoT data subset with the past V-band light curve. In this step we used equal weights both for the CoRoT and the V-band data. This rapidly converged towards one possible light curve model obtained from averaging over the 10 found solutions. The mean parameters (com-puted with standard errors) were then adopted as the starting val-ues for the next step in the modelling. Next, we simultaneously modelled each individual CoRoT data subset and the past V-band light curve together with the cross-correlation RVs of the G-star. The weights we assigned in this step to the photometry are now inversely proportional to the square of the r.m.s. errors for each dataset. This means that the CoRoT data were given a much larger weight (0.98) than the V-band data (0.02) throughout these calcula-tions. The reduced χ2-values for each modelling approximated the value χ2 = 1.4 for the CoRoT subsets, the fit for the V-band light curve had a value of χ2 ≈2.1. Again, an improved light curve and RV model was obtained from averaging over the 10 found solu-tions.
Finally, we improved the orbital period and the epoch of pri-mary minimum, HJD0, of AU Mon usingPHOEBEand our best-fit model: we simultaneously fitted all the data with the orbital pe-riod and HJD0set as the only free parameters. This yielded a pe-riod of 11.d1130374(1), which is almost the same as the orbital pe-riod determined by Lorenzi (1980b) and which we adopted as a fixed parameter in our final modelling. The final value for HJD0is HJD0 = 2454136.6734(2). We checked whether inclusion of third
light in the modelling would improve our solution. This was not the case. We also verified that, when leaving the mass ratio q as a free parameter, its value was fully consistent with our spectroscopic estimate of q.
The mean parameters (with estimated uncertainties) and the resulting physical properties of both components are listed in
8.2 8.4 8.6 8.8 9 Magnitude −0.02 0 0.02 −0.2 0 0.2 0.4 0.6 0.8 1 1.2 Res. Phase 8.2 8.4 8.6 8.8 9 V (mag) −0.1 0 0.1 −0.2 0 0.2 0.4 0.6 0.8 1 1.2 Res. Phase
Figure 8. The finalPHOEBEmodel plotted in red on top of one part of the CoRoT light curve (top) and the V-band light curve (bottom), after removal of the long-term period of Plong= 417 ± 8 days, phased against the period
of 11.1130374 days. Below each light curve the residuals of the model and observations are shown.
ble 8. The true uncertainties will be larger because they depend on unknown systematic uncertainties and parameter dependencies which were not treated here. The observed V and CoRoT light curves and the synthetic model are shown in Fig. 8. There is a very good agreement between the CoRoT observations and the best-fit model: the mean residual value in all the subsets is of the order of 0.02 mag (Fig. 9), though somewhat larger near the phase of pri-mary minimum. We note however that the expected effective tem-perature for a normal main-sequence B-star with a mass of 7 solar masses would be higher than 15000 K we obtained, in the order of 20000-21000 K. The radius of 5.6 solar radii also appears too large, even for the mass of 7 solar masses, it should be of the order of 4 solar radii. This may indicate that also from photometry one measures the outer radius of the optically thick pseudophotosphere, rather than the true radius of the B star. Seen roughly equator-on, such a pseudophotosphere would also have a lower effective tem-perature. Fig. 7 shows thePHOEBEmodel for the RVs of the G-star. Fig. 10 illustrates the configuration of the binary at three different orbital phases.
6 CHARATERIZATION OF THE
ROSSITER-MCLAUGHLIN EFFECT OF THE G-STAR As already mentioned in Sect. 4.1, the RV curve of the G-star shows a small Rossiter-McLaughlin (RM) effect (Rossiter 1924; McLaughlin 1924) at phase 0.5. This red-/blue-shifted distortion at
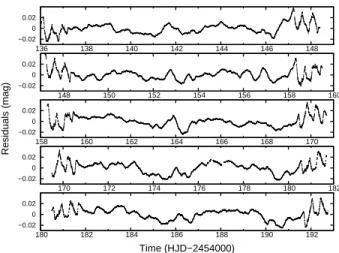
−0.02 0 0.02 180 182 184 186 188 190 192 Time (HJD−2454000) −0.02 0 0.02 170 172 174 176 178 180 182 −0.02 0 0.02 158 160 162 164 166 168 170 Residuals (mag) −0.02 0 0.02 148 150 152 154 156 158 160 −0.02 0 0.02 136 138 140 142 144 146 148
Figure 9. The O−C residuals from the final solution shown for the complete CoRoT light curve.
−0.4 −0.2 0 0.2 0.4 phase=0.0 −0.4 −0.2 0 0.2 0.4 z/A phase=0.25 B G −0.4 −0.2 0 0.2 0.4 −1 −0.5 0 0.5 1 x/A phase=0.5
Figure 10. Representation of the B and G-star of AU Mon pictured in three different phases. The cross in the middle panel denotes the center of mass. The system does not show a total eclipse.
the secondary eclipse is due to selective blocking of the light of the rotating star during an eclipse. When the primary star covers the blueshifted (redshifted) half of the stellar disk, the integrated light of the secondary appears redshifted (blueshifted). Because of this selective blocking of the stellar surface during the eclipse, a skewed line profile is created. This change in line profile shape results in a shift in RV, which in turn results in the redshift-blueshift distortion seen during the eclipse. The effect mainly depends on the projected rotation velocity of the star, the ratio of stellar radii, the orbital in-clination, and the limb darkening. To analyse this effect we have subtracted the orbital solution (solid curve in Fig. 7) from the RV measurements of the G-star. The orbit-subtracted RV residuals are shown in Fig. 11. We used the analytical description of this effect given in Gim´enez (2006) to simulate the RM effect. The ratio of the stellar radii rB/rG, the inclination and the radius of the G-star
−15 −10 −5 0 5 10 15 0.2 0.3 0.4 0.5 0.6 0.7 Radial Velocities (km s −1 ) Phase
Figure 11. The orbit subtracted RV residuals (dots) showing the RM effect at phase 0.5. The solid line is the simulation of the RM effect with the parameters given in the text, the dashed line shows the RM effect after an increase of the radius of the G-star.
relative to the size of the orbit rGwere taken from our final orbital
solution. The equatorial rotational velocity of the star was set to 44 ± 4 km s−1. The rotational axis of the G-star is assumed to be perpendicular to the orbital plane.
The result of our best fit is seen in Fig. 11. With our current input parameters we cannot fully explain the RM effect. A possi-ble explanation is that we are primarily not dealing with rotational effects but with the fact that the photocentre and gravity centre of the Roche-lobe filling star (G-star) are not identical and coinciding. Wilson et al. (1985) pointed out that this could also cause such dis-tortions in the RVs during an eclipse. Another explanation comes from the fact that we have circumstellar matter together with mat-ter circulating from the G to the B-component which has not been taken into account in the calculations. In order to check this, we have set the relative radius of the G-star rGas a free parameter. The
result is that we could fit the RM effect if we increase rGto 0.44A
(see Fig. 11).
7 VARIATIONS ON OTHER TIME SCALES
As Fig. 9 clearly shows, a systematic pattern of rapid light changes which is most pronounced near the phases of primary eclipse was detected by CoRoT at every orbital cycle. This is also the rea-son why the O-C’s calculated from our final ephemeris for these minima are significantly larger than their accuracy (see Table 3). The fast changes near the primary eclipse are reminiscent of what Pavlovski et al. (2006) found for W Cru (most evident in the U-filter). In accordance with them, we propose that the variations are due to a non-uniform brightness distribution, probably seated in the accretion disk. We also note that the Hα profiles from very similar orbital phases but from two different orbital cycles differ from each other – see Fig. 12. For instance, the additional red-shifted absorp-tion feature is more pronounced in the first cycle than in the last one.
As already mentioned in Sect. 2.2, Peters (1994a,b) suggested that the cyclic variations in the mass transfer rate could be due to pulsations of the mass-losing secondary. In order to investigate this we performed a frequency analysis on the residuals of the light curve after subtracting our finalPHOEBEmodel shown in Fig. 8.
0.8 1 1.2 6550 6560 6570 6580 Wavelength (Å) 0.39 7.70 0.8 1 1.2 0.35 18.37 0.8 1 1.2 0.34 29.34 0.8 1 1.2 Normalized Intensity 0.31 6.82 0.8 1 1.2 0.29 6.63 0.8 1 1.2 0.27 28.65 0.8 1 1.2 0.25 28.35 0.8 1 1.2 0.22 5.88
Figure 12. A sequence of the Hα line profiles showing a complicated ve-locity field and cycle-to-cycle variations. Data from 3 consecutive orbital cycles can be seen. In the left corner of each plot we list the time of mea-surement (HJD-2454100), in the right corner we give the orbital phase cal-culated from ephemeris (2).
The periodogram of the residual data set is completely con-taminated by the binary orbital frequency and its harmonics. As can be seen in Figs 8 and 9, the residuals of the CoRoT data near the phase of primary minimum show much larger variations than the residuals outside eclipse. This periodicity is due to the fact that the primary minima are not completely well fitted, thus introducing a strong signal with the orbital frequency of 11.11303 days. In order to avoid this we did not consider the residuals during the phase of primary eclipse and recomputed the Fourier Transform (FT). The result is shown in Fig. 13. The orbital frequency and its harmon-ics are still present (from 0 to 3 d−1) in the top periodogram. The frequency peaks in the range of 12 to 17 d−1are due to the CoRoT satellite orbital frequency ( forb,CoR = 13.97 d−1) and are thus in-strumental. We searched for frequencies using the PDM-method (Stellingwerf 1978) and prewhitened the data for the orbital fre-quency and 8 other low frefre-quency signals (< 0.2 d−1) using a spline fit to the bin means (see e.g. Waelkens & Rufener 1983). This re-sulted in a residual light curve without the binary and satellite sig-nature.
The residuals from the PDM-prewhitening procedure were analysed using the Short Time Fourier Transform (STFT) with a Hamming window (Harris 1978). The result can be seen in Fig. 14. The STFT was calculated using a window width of 10 days, and evaluated in 100 equidistant time points. The peaks at 10.4 ( f1) and 8.3 d−1( f2) are clearly visible as nearly continuous frequency bands. A short drop in amplitude is noticeable in the 8.3 d−1 quency band around day τ = 38 d. The power excess at lower
fre-Table 9. Frequencies found in the residuals together with their S/N ratio (we refer to the text for explanation). The error estimate (Montgomery & O’Donoghue 1999) for the frequencies is ±0.0002 d−1. The error on the amplitude is 0.01 mmag.
ID Frequency Amplitude S/N
[d−1] [µHz ] [mmag] f1 10.4081 120.46 0.34 14.8
f2 8.3033 96.10 0.25 9.2
quency cannot be attributed to one or several stable frequencies. In-stead, the time-dependent behaviour of low frequencies with short-living amplitudes are visible, resulting in a smeared out region of power excess in a full Scargle periodogram (see middle panel of Fig. 13). It is difficult to draw firm conclusions about the origin of these features, due to the added uncertainties from the PDM-prewhitening method in this frequency band. However the two frequencies in Table 9 are unaffected by our PDM-prewhitening method, and are definitely present in the Scargle periodogram. Their characteristics are listed in Table 9. Since these frequencies are not detectable in the spectra, we cannot directly assign a phys-ical origin to them. The frequencies f1 and f2 are likely to origi-nate from the B-star because it produces ∼ 82% of the light and it concerns isolated frequency peaks. Although, theory does not pre-dict such pulsations for B-stars (see e.g. Miglio et al. 2007), such frequencies have also been detected in CoRoT data of the Be star HD 49330 (Huat et al. 2009). This result puts AU Mon in the neigh-bourhood of the sample of semi-detached Algol-type eclipsing bi-naries with an oscillating mass accreting component (oEA stars, with RZ Cas as the best studied object Mkrtichian et al. 2007). AU Mon can not be fully classified as an oEA star, because oEA stars are at the end of the mass transfer regime which is still not the case for AU Mon.
On the other hand, theory predicts that the G-star should produce solar like oscillations (see e.g. Houdek & Gough 2002; Samadi et al. 2007). Since we know the mass, radius and Teffof the star, we predict νmax= MG/R2G·(Teff,G/5777)−0.5·3050 ≈ 34 µHz (= 2.94 d−1) to be the frequency at which to expect such oscillations (Kjeldsen & Bedding 1995). This value is in agreement with the lo-cation of the power excess in the Scargle periodogram of AU Mon (middle panel of Fig. 13). The amplitude of the power excess is not in disagreement with the amplitudes of the discovered solar-like os-cillations in the CoRoT data of red giants (De Ridder et al. 2009) taking into account the flux contribution of the G-star. Due to a lack of mode identification and uncertainty on the origin of the oscilla-tions, we are unable to exploit the detected frequencies seismically without additional spectroscopic information about them.
8 UNDERSTANDING THE LONG-TERM LIGHT
VARIATIONS
Other cases than AU Mon exist in which the discovery of long-term periodic or at least cyclic brightness variations (reminiscent of AU Mon ) have been claimed, namely those cases where sys-tematic photometry in a calibrated photometric system has been carried out or where interacting binaries with Balmer emission lines and hot mass-gaining components are discussed. Probably the first reports of such a behaviour are RX Cas (Kalv 1979), TV Cas = HD 1486 (Walter 1979) and V505 Sgr =BD−14◦
5578 (Walter 1981). However, the latter two systems exhibit only very faint
0 2 4 6 8 10 0 0.1 0.2 0.3 0.4 Amplitude (mmag) 0 0.1 0.2 0.3 0.4 0 2 4 6 8 10 12 14 16 18 20 Frequency (d−1) 0 0.2 0.4 0.6 0.8 1 −20 −10 0 10 20
Figure 13. The periodogram of the residuals out of primary eclipse together with the spectral window (top+inset). The middle panel shows the peri-odogram after prewhitening for 9 low-frequency signals. The bottom panel shows the final residual periodogram after prewhitening all significant fre-quency peaks.
Figure 14. The Short Time Fourier Transform of the residuals of the CoRoT light curve after prewhitening for the orbital frequency. The units of the colour scale are in mmag. See text for details.
single-peaked Hα emission and their long-term variations are prob-ably related to the presence of distant third components in these systems (Richards & Albright 1999; Vesper et al. 2001).
In Table 10, we provide basic information on galactic emission-line systems with cyclic long-term variability known to us. During the past five years, similar systems were also
dis-Table 10. Galactic hot emission-line binaries with cyclic long-term bright-ness changes. The tabulated mass ratio is always the ratio of the mass of the lighter (usually Roche-lobe filling) component to that of the B-star.
Name BD Porb. Plong Mass ratio Ref. RX Cas +67◦244 32.d312 516.d06 0.30±0.05 1, 2, 3, 4 AU Mon −01◦1449 11.d113 417.d0 0.17±0.03 5
CX Dra +52◦2280 6.d696 130d–180d 0.23 6, 7, 8
βLyr +33◦3223 12.d94 282.d37 0.225 8, 9, 10 V360 Lac +41◦4623 10.d085 322.d24 0.163 11, 12 References to original studies identified by the running numbers in column “Ref.”:
1... Kalv (1979); 2... Kˇriˇz et al. (1980); 3... Andersen et al. (1989); 4... Pustylnik et al. (2007); 5... this study; 6... Koubsk´y et al. (1980); 7... Horn et al. (1992); 8... Richards et al. (2000); 9... Harmanec et al. (1996); 10... Harmanec (2002) 11... Hill et al. (1997); 12... Linnell et al. (2006)
covered and studied rather intensively in the Magellanic Clouds (Mennickent et al. 2003, 2005b,a, 2006, 2008). In spite of all effort, the true cause of the long-term cyclic changes remains unexplained, although several different interpretations were put forward: Kalv (1979) interpreted the 516-d periodicity of RX Cas as pulsation of the Roche-lobe filling star. Harmanec et al. (1996) considered the possibility that the 282-d cycle of β Lyr is a beat period between the orbital period and rapid changes with a cycle of 4.d7 which they de-tected in spectroscopy. They also pointed out some similarity with the 164-d cycle of V1343 Aql = SS 433, a massive 13.d08 X-ray binary with bipolar jets. Wilson & van Hamme (1999) also studied
βLyr. They concluded that neither apsidal advance nor precession can account for the 282-d light variation. They were unable to ex-clude pulsations of the disk as the cause. As already mentioned, Peters (1991) concluded that the optical brightness variations of AU Mon are due to a 1200 K variation in the photospheric effec-tive temperature of the B primary.
Mennickent et al. (2003) reported the discovery of eclipsing binaries with long-term periodic brightness changes from OGLE photometry of the Magellanic Clouds. Mennickent et al. (2003) pointed out that the light maxima of the long cycles are al-ways accompanied by a mild reddening of the objects in ques-tion. Mennickent et al. (2005b) concluded that the long brightness changes are often cyclic rather than strictly periodic ones. Sub-sequently, Mennickent et al. (2008) concluded that the long-term variations must be due to variations in circumbinary matter as we found for AU Mon. They suggested that the system experiences su-percycles of mass outflow which lead to replenishment of the cir-cumbinary envelope.
AU Mon may become a key object to study the true nature of the long-term brightness changes since it is bright and the ampli-tude of the 417-d period is large. In spite of our effort to collect and homogenize existing photometry, available material on colour variations is, unfortunately, very scarce. In Fig. 3 we compare the V magnitude and B − V and U − B colour changes along the 417-d cycle for all observations we were able to transform into compara-ble U BV magnitudes. Unfortunately, there is no colour information near phases of the brightness maximum. A plot of both colour in-dices vs. time shows that there could also be colour variations on longer time scales, than those related to the 417-d cycle. If this is a more general pattern, this could perhaps also explain some-what contradictory reports on the colour behaviour of various ob-jects studied by Mennickent and his collaborators. Clearly, future
systematic calibrated multicolour photometry of AU Mon over the whole 417-d cycle is very desirable.
We tentatively suggest that the long-term brightness changes of AU Mon must be associated with some circumbinary matter and it is plausible to assume that the bulk of such material is associated with putative bipolar jets for which we find indirect support from the shift of the RV curves of some spectral lines associated with the B-star. Bisikalo et al. (2000) showed via hydro calculations for β Lyr that when the encircling stream hits the denser primary stream from the mass-losing star, it gets bended and goes out of the orbital plane resulting in jet-like structures. Peters (2007) reported proba-ble detections of bipolar jets of very hot plasma, perpendicular to the orbital plane, for three other hot interacting binaries: TT Hya, V356 Sgr and RY Per. However, Miller et al. (2007) studied cir-cumstellar matter of TT Hya and argued against jets. The variations themselves could have two possible causes: either cyclic changes in the mass outflow from the binary as suggested by Mennickent et al. (2008) or precession of the binary orbit which would change the at-tenuation of the binary due to changing projection effects of jets. This latter idea seems improbable, however, in the light of our finding that the light curve from the maxima and minima of the 417-d period lead to the same binary elements including the orbital inclination. It is clear that continuing systematic observations of AU Mon, including spectro-interferometry and polarimetry, could help to understand the nature of the remarkable changes of these interesting objects.
9 SUMMARY
Our analyses of very accurate CoRoT space photometry, past John-son V photoelectric photometry and high-resolution ´echelle spec-tra led to the determination of improved fundamental stellar prop-erties of both components of the massive and interacting system AU Mon. We derived new and accurate ephemerides for both the orbital motion (with a period of 11.d1130374) and the long-term, overall brightness variation (with a period of 416.d9). It is shown that this long-term variation must be due to attenuation of the total light by some variable circumbinary material. We derived the bi-nary mass ratio MG/MB= 0.17±0.03. Using this value of the mass ratio as well as the radial velocities of the G-star, we obtained a con-sistent and coherent light curve solution and a new estimate of the stellar masses, radii, luminosities and the effective temperatures.
We must point out that our final model does not include the gas stream and accreting matter on the B-star. It would be interesting to consider such complications in any future modelling of the binary. We also report the discovery of rapid and periodic light changes vis-ible in the high-quality residual CoRoT light curves. The rapid light changes visible in the residuals near primary minima repeat at every orbital period. They are probably due to a non-uniform brightness distribution, seated in the accretion disk. Outside the primary min-ima of the CoRoT light curve we detect two frequencies, they are in the expected frequency domain of B-stars. Complementary in-terferometric and polarimetric observations will be needed to even better understand the geometry and the nature of the circumbinary matter in AU Mon.
ACKNOWLEDGEMENTS
The authors acknowledge critical remarks and useful suggestions by Dr. Johannes Andersen on an earlier version of the paper. YF