RESERVOIRS TO MITIGATE FLOOD EVENTS ON THE RIVER
OURTHE IN BELGIUM
CONTEXT
Ancient and recent floods in Europe and all over the world proved continuously that rivers, as a part of nature, have to be mastered not by force but by understanding. Reservoirs can be used in this scope to mitigate flood events, as far as they provide sufficient storage capacities and are cleverly managed. Indeed, on the river reservoir can be used to retain the water volume of a flood peak in order to decrease the downstream discharge during the corresponding time. After the flood, the reservoir is emptied to recover its storage capacity before the next flood.
Beside environmental and structural studies, designing such reservoirs requires to precisely assess their potential hydrodynamic effect. Building a dam is not a miraculous solution to mitigate flood on a river: the storage capacity of the reservoir has to be sufficient regarding the river discharges as well as the flood durations, and the location of the structures has to be relevant. Moreover, the management laws of the reservoir have to be defined prior to its exploitation in order to avoid any malfunction during real events. Finally, the storage capacity of the reservoir to mitigate flood has to be maintained along the time, whatever the possible other uses of the structure, such as hydro-production, drinking water storage or leisure. To assess hydrodynamics impact of such reservoirs, using numerical flow solvers can be of a great interest. For example, river network models can very easily simulate the effects of a reservoir on the flood propagation or test different management laws. Other solvers can be used to assess the reservoir filling or the effect of a peak discharge decrease on the flood extension.
In this framework, the present paper covers a detailed description of the application of a state-of-the-art software package to the study of the hydrodynamics impact of three reservoirs to mitigate flood events on the river Ourthe in Belgium. Several free surface flow models, working with staggered scales, are successively applied to objectively set up the reservoirs potential efficiency. This study helps thus decision makers in their choice of the better solution regarding flood mitigation.
In a first time, on the basis of a sketch of three possible reservoirs located on the river Ourthe and its main tributary the Amblève, several scenarios of reservoir combination and management laws have been tested with a 1D model. The solver provided reliable information on the hydrographs propagation in the whole river network. Thus, for each scenario, the potentialities of the structures to mitigate flood discharges for different real events could be analysed.
In a second time, for the better combinations resulting form stage one, the effect of the peak discharge decrease has been assessed by simulating the flood extension with a 2D free surface
flow solver and using a very accurate digital elevation model. In this second stage, inundation maps have been computed on the most critical areas, water levels being defined house by house along 31 kilometres of the rivers.
NUMERICAL MODELS WOLF software package
The flow models applied in this study are integrated in the software package WOLF, which has been developed for more than ten years at the University of Liege. WOLF includes a complete set of numerical models for simulating free surface flows, process-oriented and spatially distributed hydrology (Archambeau, 2006), 1D and 2D hydrodynamics (Erpicum, 2005, Dewals & al., 2006), sediment transport (Dewals, 2006), air entrainment (André & al., 2003) as well as an optimisation algorithm (Erpicum, 2006) (Fig. 1). This last tool, based on the robust Genetic Algorithms technique, allows an objective calibration of friction coefficients for example.
Figure 1. General organization of the WOLF package
All the solvers are managed from a single user-friendly GIS interface, entirely designed and implemented by the authors (Archambeau, 2006), which makes the pre- and post-processing operations very convenient.
GIS Environnement
Management and using the large set of data necessary to perform relevant flow simulation on real rivers requires robust and efficient pre- and post-processing tools. A GIS environment included in WOLF performs the operations necessary to the preparation of the data and their subsequent use in the numerical models, as well as the results visualization and exploitation. Several databases containing topographic data, pictures of historic floods, characteristics of structures along the rivers (dams, bridges, weirs,…) are stored on a single data server with their geographic coordinates to be easily downloaded by any modeller.
1D flow model
Mathematical model: WOLF1D has first been developed to model flood waves propagation in natural river networks. As common methods based on conveyance considerations lead to substantial errors, the 1D solver takes explicitly into account the flows in compound channels, in both situations of large floodplains with totally developed streams or lateral storage areas
Pure hydrodynamics Hydrodynamics coupled with air and sediment transport WOLF AG
WOLF HYDRO WOLF 1D WOLF 2D
Parameters calibration
with hydraulic dead zones where water movements have the same order of magnitude in both directions.
The coexistence of several flow rates with shocks and bores in ramified nets of variable cross section arms requires dealing with suitable shock capturing methods to solve the conservative form of the 1D Saint-Venant equations. The complete set of equations solved in WOLF1D for each flow bed is expressed as follows:
0 L Q q t x ω ∂ +∂ − = ∂ ∂ (1) 2
cos cos b cos cos sin
x z Q Q g p g g J g p g t x ω θ ω ω θ x ω θ θ ω θ ⎡ ⎤ ∂ ∂ + ∂ + − + + + ⎢ ⎥ ∂ ∂ ⎣ ⎦ ∂ (2)
where ω is the cross section, Q the discharge, q the lateral exchanges, L θ the channel bottom slope, z the bottom elevation and b J a global term for bottom roughness and shear
fluid effect. The pressure terms are defined as follows, with h the water height and l the
channel width:
(
) ( )
0 , h pω =∫
h−ξ l x ξ ξd (3)(
) ( )
0 , h x l x p h d x ξ ξ ∂ ξ = − ∂∫
(4)WOLF1D has been extensively used as a management tool for analyzing extreme natural events. Now, since more efficient and accurate 2D or quasi-3D solvers, such as WOLF2D, are available for flood case studies even on large river sections, the one dimensional model is preferentially used for catchment or region scale modeling of river networks, dedicated to applications such as flood propagation, pollutant transport as well as the evaluation of the global water quality and of environmental effects. It is also used to give suitable boundary conditions to other models in linked 1D-2D simulations (Erpicum & al., 2006).
Numerical features: The spatial discretization of the equations is performed by a widely used finite volume method. Flux treatment is based on an original flux-vector splitting technique developed for WOLF (Archambeau, 2006). Efficiency, simplicity and low computational cost are the main advantages of this scheme.
Besides, an explicit Runge-Kutta scheme or an implicit algorithm is applied to solve the ordinary differential equation operator along time, and an original treatment of the confluences, based on Lagrange multipliers, allow the modeling in a single way of large river networks.
The model has been validated using other numerical existing models, experimental results as well as field measurements of the transient behaviour of natural river flows (Pirotton, 1994). 2D flow model
Mathematical model: The model WOLF2D solves the classical SWE. In this approach, the only assumption states that velocities normal to a main flow direction are smaller than those
in the main flow direction. As a consequence the pressure field is found to be almost hydrostatic everywhere. The large majority of flows occurring in rivers can reasonably be seen as shallow everywhere, except in the vicinity of some singularities (e.g. weirs). The divergence form of the shallow-water equations includes the mass balance:
0 i i q h t x ∂ ∂ + = ∂ ∂ (1)
and the momentum balance:
0 i j ji i fi i i i q q q H gh S t x h x x τ ⎡∂ + ∂ ⎛ ⎞⎤+ ⎛ +∂ ⎞+∂ = ⎢∂ ∂ ⎜ ⎟⎥ ⎜ ∂ ⎟ ∂ ⎝ ⎠ ⎝ ⎠ ⎣ ⎦ ; j=1, 2 (2)
where Einstein’s convention of summation over repeated subscripts has been used. H represents the free surface elevation, h is the water height, q designates the specific i discharge in direction i , S is the friction slope and fi τij are the depth integrated turbulence stresses.
Several turbulence models are implemented in WOLF2D, starting from turbulent viscosity algebraic relations to an original depth-integrated two additional equations model (Erpicum, 2006).
Algorithmic implementation: The space discretization of the 2D conservative shallow-water equations is performed by a finite volume method. This ensures a proper mass and momentum conservation, which is a prerequisite for handling reliably discontinuous solutions such as moving hydraulic jumps. As a consequence, no assumption is required as regards to the smoothness of the unknowns.
Designing a stable flux computation has always been a challenging and tough issue in computing fluid dynamics, especially if discontinuous solutions are expected. Flux treatment is here based on an original flux-vector splitting technique developed for WOLF (Mouzelard, 2002). The hydrodynamic fluxes are split and evaluated according to the requirements of a Von Neumann stability analysis. Much care has been taken to handle properly the source terms representing topography gradients (Erpicum, 2006).
Since the model is applied to transient flows and flood waves, the time integration is performed by means of a second order accurate and hardly dissipative explicit Runge-Kutta method.
Friction modeling: River and floodplain flows are mainly driven by topography gradients and by friction effects. The total friction includes three components: bottom friction (drag and roughness), wall friction and internal friction.
The bottom friction is classically modelled thanks to an empirical law, such as the Manning formula. The model enables the definition of a spatially distributed roughness coefficient. This parameter can thus easily be locally adjusted as a function of local soil properties, vegetation or sub-grid bed forms. An original evaluation of the real shear surfaces is realized and the friction along vertical boundaries, such as bank walls, is reproduced through a process-oriented model developed by the authors (Dewals, 2006).
The internal friction is taken into account by the turbulence model.
Multiblock grid and automatic grid adaptation: WOLF 2D deals with multiblock structured grids (Erpicum & al., 2004). This feature enables a mesh refinement close to interesting areas without leading to prohibitive CPU times. A grid adaptation technique restricts the simulation domain to the wet cells, thus achieving potentially drastic reductions in CPU times.
Besides, the model incorporates an original method to handle covered and uncovered (wet and dry) cells. Thanks to an efficient iterative resolution of the continuity equation at each time step, based on a correction of the discharge fluxes prior to any evaluation of momentum balances, a correct mass conservation is ensured in the whole domain (Erpicum & al., 2004). Mesh refinement: In case of transient computations, an automatic mesh refinement technique is used to enhance the convergence rate towards accurate steady-state solutions (Archambeau & al., 2004).
The computations are performed on several successive grids, starting from a very coarse one gradually refined up to the finest one. When the hydrodynamic fields are almost stabilized, the solver automatically jumps onto the next grid. The successive “initial solutions” are interpolated from the coarser towards the finer grid in terms of both water heights and discharges. This fully automatic method considerably reduces the number of cells in the first grids and then substantially decreases computation time, despite extra computation time for meshing and interpolation operations.
Digital Elevation Model
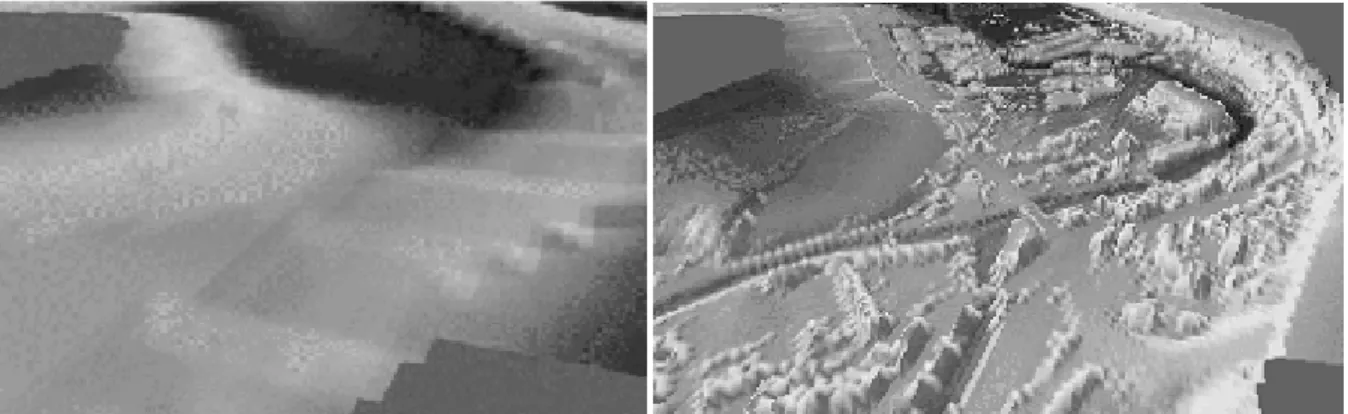
Very recently, the Belgian Ministry of Facilities and Transport (MET), and in particular the Service of Hydrology Studies (SETHY), acquired an accurate DEM on the floodplains in the whole Walloon Region. An airborne laser has been used to characterise the inundation area of the main rivers network and an echo-sonar technique has been applied to measure the bathymetry of the main channel on navigable rivers. On smaller non navigable rivers, cross sections have been interpolated to generate the main bed topography information.
Consequently, the poor and inaccurate 3D information available for many years, i.e. 30 m of plan resolution with a precision of several meters in altitude, has been replaced by an exceptional DEM since the precision in altitude is 15 cm and the information density is one point per square meter (Fig. 2).
Generally, specific features of flows in urban area, such as blockage by buildings, are taken into account in hydraulic numerical models by a local modification of the roughness coefficient. With the new set of topographic data, irregularities of the topography influence directly the inundation flows. This allows focusing on proper physical values of the roughness coefficient.
MITIGATION OF FLOOD EVENTS USING RESERVOIRS Introduction
The population of the river Ourthe basin in Belgium had to face recurrent large inundations during flood for years. This situation results from the specific characteristics of the 1844 km² hilly catchment of the river and of the flow dynamics during a flood between the Ourthe river and its main tributary, the Amblève.
To solve this problem, one of the solutions foreseen by the Walloon Region Administration is to build flood control reservoirs. The HACH has been entrusted by the Administration to assess the potential effect of these reservoirs regarding flood mitigation on the basis of numerical flow simulations. These studies, carried on with the WOLF package, are depicted in the following pages.
Reservoirs location, volume and management laws
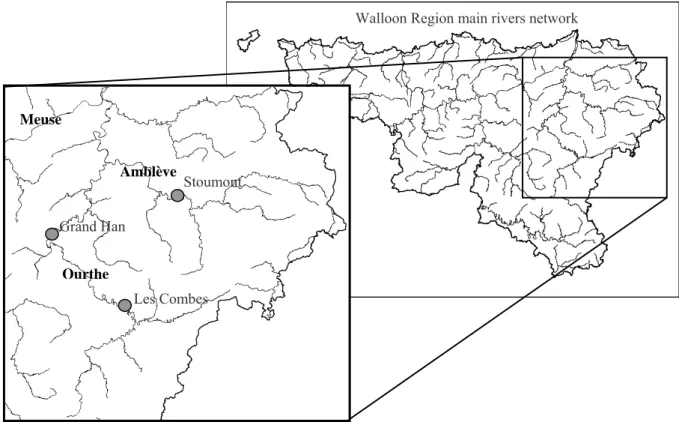
Prior to the hydrodynamics studies, the Administration chose three areas to locate a possible reservoir. Two are on the Ourthe river, the third one is on its main tributary, the Amblève. These locations have to deal with the important inhabitant density of the South part of Belgium (200 inh/km²) and have to be positioned in the river network in such a way they are useful regarding flood mitigation (Fig. 3).
Figure 3. River Ourthe network and location of the three potential reservoirs
Amblève Ourthe Meuse Stoumont Les Combes Grand Han
The storage capacity of the reservoirs, precisely computed by the WOLF interface from the DEM as a water height/volume curve, is detailed in the table 1.
Table 1. Storage capacity of the reservoirs (107 m³) Grand Han Les Combes Stoumont
1.2 1.5 0.47
The reservoirs management laws have also been defined by the Administration prior to the hydrodynamics studies. For each reservoir, a threshold discharge value as been defined: if the discharge in the river is greater than this value, the water volume exceeding the threshold is stored in the reservoir. If the water volume in the reservoir exceeds a second threshold value, the release discharge is incrementally increased till reaching, at the maximum, the value of the inflow. During flood decrease, if the inflow becomes smaller than the first threshold, the reservoir is emptied by releasing a higher discharge.
Three combinations of reservoirs and management laws have to be tested. “Grand Han” reservoir is considered every time with one of the two other reservoirs. When it is considered with the “Stoumont” reservoir, two management laws are tested (Table 2).
Table 2. Scenarios of reservoirs and management laws Grand Han Les Combes Stoumont
Scenario 1 Law 2 Law 1 No
Scenario 2 Law 1 No Law 1
Scenario 3 Law 2 No Law 1
Impact on discharge
In a first time, 1D simulations of the river network have been carried on to assess the effect of the reservoirs on discharges amplitude. On the basis of rain data on the whole catchment, the river network is fed in water to each computation nodes, i.e. every 50 to 150 m. These lateral inflows are then propagated in the network, considering the set of equations depicted in the paragraph describing WOLF1D.
Ten real flood events have been considered in this part of the study. They represent the ten larger floods of the period 1990-2002. For each real event, a first simulation has been carried on without any reservoir in order to validate the model regarding real discharge measurements. In a second time, each of the three scenarios for the reservoirs location and management has been tested. The figure 4 and 5 illustrate the results obtained after the 1D study.
The Figure 4 shows the good correlation between the computed and measured values at the Tabreux station on the Ourthe river. The effect of the “Grand Han” and “Les Combes” reservoirs is also visible with a flattening of the flood peak.
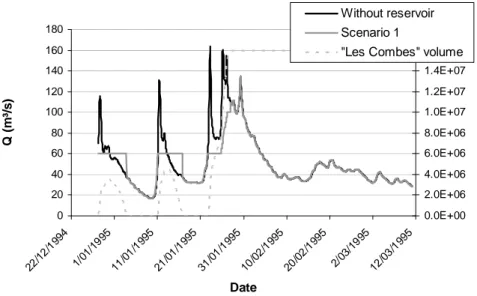
Figure 4. Discharge curves at the Tabreux station during the flood of January 2001 The figure 5 illustrates the discharge evolution with and without reservoir, downstream of “Les Combes”, for the flood of the beginning of 1995. The third curve shows the evolution of the water volume in the reservoir. The discharge limitation is visible at the beginning of the flood but at the end of January, the reservoir is full so it became ineffective.
Figure 5. Downstream discharge curves and water volume evolution at “Les Combes” reservoir during the flood of the beginning of 1995
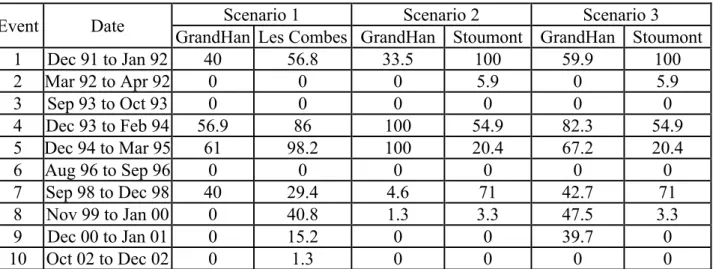
The table 3 summarizes the maximum filling rate of each reservoir for the ten flood events. In scenario 1, with two reservoirs following on the same river, the available storage capacity is not fully used. In this case, the reservoir filling and emptying should be performed very carefully and in an integrated way.
In scenario 2 and 3, the “Grand Han” reservoir is better used as it is the only one on the main river. On the other hand, the second reservoir stores the water of the Amblève to mitigate floods in the downstream part of the Ourthe.
0 20 40 60 80 100 120 140 160 180 25/12/2000 30/12/2000 4/01/2001 9/01/2001 14/01/2001 19/01/2001 24/01/2001 Date Q ( m ³/ s ) Without reservoir Real measure Scenario 1 0 20 40 60 80 100 120 140 160 180 22/ 12/ 1994 1/01 /199 5 11/ 01/ 1995 21/ 01/ 1995 31/ 01/ 1995 10/ 02/ 1995 20/ 02/ 1995 2/03 /1995 12/ 03/ 1995 Date Q (m ³/ s ) 0.0E+00 2.0E+06 4.0E+06 6.0E+06 8.0E+06 1.0E+07 1.2E+07 1.4E+07 1.6E+07 1.8E+07 Without reservoir Scenario 1
Table 3. Reservoir maximum filling rate during the ten flood events for the 3 scenarios (%)
Event Date Scenario 1 Scenario 2 Scenario 3
GrandHan Les Combes GrandHan Stoumont GrandHan Stoumont
1 Dec 91 to Jan 92 40 56.8 33.5 100 59.9 100 2 Mar 92 to Apr 92 0 0 0 5.9 0 5.9 3 Sep 93 to Oct 93 0 0 0 0 0 0 4 Dec 93 to Feb 94 56.9 86 100 54.9 82.3 54.9 5 Dec 94 to Mar 95 61 98.2 100 20.4 67.2 20.4 6 Aug 96 to Sep 96 0 0 0 0 0 0 7 Sep 98 to Dec 98 40 29.4 4.6 71 42.7 71 8 Nov 99 to Jan 00 0 40.8 1.3 3.3 47.5 3.3 9 Dec 00 to Jan 01 0 15.2 0 0 39.7 0 10 Oct 02 to Dec 02 0 1.3 0 0 0 0
Table 4 shows the decrease in peak discharge at the downstream extremity of the simulation. It reflects thus the global efficiency of each scenario for each flood. Maximum decrease is 28.7 %.
Table 4. Discharge (m³/s) and gain on peak values (%) at the “Sauheid” station, in the downstream part of the river Ourthe
Event Discharge without reservoir
Scenario 1 Scenario 2 Scenario 3
Discharge Gain Discharge Gain Discharge Gain
1 699.8 546.8 21.9 629.9 10 546.9 21.8 2 316 323.2 -2.3 302.2 4.4 302.3 4.3 3 138.1 142.8 -3.4 142 -2.8 142 -2.8 4 679.7 530.1 22 471.5 30.6 516 24.1 5 462.4 400.6 13.4 394.4 14.7 437.2 5.5 6 159.6 171.6 -7.5 161.5 -1.1 161.5 -1.1 7 433.4 358.3 17.3 387.1 10.7 308.9 28.7 8 325.6 287.8 11.6 328 -0.7 316.2 2.9 9 270.4 249.8 7.6 272.7 -0.8 240.1 11.2 10 259.8 265 -2 263.1 -1.3 263.1 -1.3 This first part of the global study of the hydrodynamic effects of the reservoirs shows that two solutions are possible to decrease the flood amplitude in the Ourthe river. Two reservoirs can be used on the main river to mitigate its floods while the Amblève stays in its natural state. On the other side, one reservoir can be built on each river to mitigate floods on both main parts of the network.
In the first case, the downstream part of the Ourthe still faces the Amblève floods and the integrated management of the two following reservoirs is of prime interest. In the second case the part of the river upstream of “Grand Han” is not protected but the reservoirs management is easier.
Impact on flood extension
When the gain in peak discharge value is known, the corresponding modification in flood extension has to be computed to really assess the opportunity to build the reservoirs. This second part of the study has been realized with WOLF2D using the high resolution DEM
described previously. Inundation area have been defined on 31 critical kilometers of the rivers, i.e. in dense urban areas, using 2 x 2 square meshes for the computation. A first calculation has been done on each place for a real event in order to have a reference inundation area and to validate the approach. In a second time, the reduced discharge has been modeled to assess the efficiency of the reservoirs regarding flood extension mitigation.
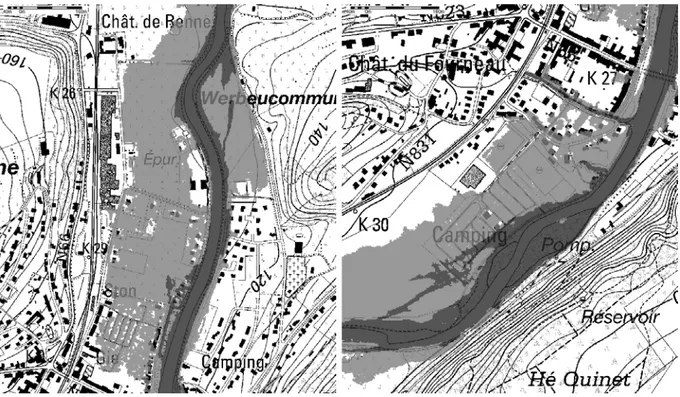
The following pictures (Fig. 6) show a comparison between the flood extension of a real event in a holiday village and the corresponding numerical results. The accuracy of both the DEM and the numerical model allow very precise prediction of the flood extension, even in difficult modelling situations such as bridges (A), villages (B), or flat area (C).
Figure 6. Comparison between a real flood event and the corresponding 2D simulation of the flood extension
Such results carefully analysed for each area to be studied, validate the numerical approach for flood extension modelling. They also provide the reference situations for each real flood. The same simulations for statistically defined 25-, 50- and 100-year floods provided another set of reference maps.
In a second time, the decreased discharge values corresponding to the better reservoirs scenario have been modelled in the same way for each flood scenario. Results such as in figure 7 have then been obtained by superposition of the two computed inundation maps. This directly shows the gain in flood extension, and thus the potential reduction of damages by the flood. These maps are a true indicator of the efficiency of the reservoirs to mitigate flood events.
Beside information on water heights, the 2D simulations provided also complete flow velocity patterns. Valuable risk maps associated with floods can then been automatically built. Such results are of prime interest to help decision makers in defining land use and housing policies and to help insurance companies to asses the risks associated with flooding.
C C A B A B
Figure 7. Examples of flood extension with (dark grey) and without (pale grey) the reservoirs The drawing of the numerical results on topographic maps shows the precision of the computations. Risk of flooding can be defined street by street and house by house thanks to very fined calculation grid and the accuracy of the DEM.
DISCUSSION
Reservoirs can represent a realistic solution to mitigate flood events. Nevertheless, prior to any environmental or structural studies, the potential effect of such structures on floods has to be carefully studied, for example by means of hydrodynamics numerical simulations.
In this framework, the application of a conscientiously developed software package, including flow solvers working on staggered scales, allows obtaining reliable results. Such a study has been described in this paper, considering the river Ourthe in Belgium. On the basis of an accurate DEM, 1 and 2D flow simulations have been successively performed. They allow to assess, in a first time, the potential effect on flood hydrograph of three different scenarios of reservoirs location and management, and to compute, in a second time, the corresponding gain in flood extension.
Beyond these useful results to help decision makers in their choice of the optimal solution for flood mitigation, the fine grid of the 2D simulations, associated with the considerable elevation precision, allows very precise impact and remediation studies, and the 2D model plays thus the role of a genuine tool for impact studies and risk management.
Resulting from several years of research and scientific development, numerical flow models, such as WOLF, are thus now fully operational and efficient for large scale real application thanks to the fast evolution of both calculation and data acquisition technologic resources.
REFERENCES
André, S., Dewals, B., Pirotton, M. and Schleiss, A. Quasi 2D-numerical model of aerated flow over stepped chutes. In Proc. of 30th IAHR Congress, Thessaloniki, Greece, (2003) 671-678
Archambeau, P., Dewals, B., Detrembleur, S., Erpicum, S. and Pirotton, M. A set of efficient numerical tools for floodplain modeling. In Shallow flows, Jirka G.H. & Uittewaal W.S.J. ed., Leiden: Balkema (2004) 141-158
Archambeau, P. Contribution à la modélisation de la genèse et de la propagation des crues et inondations, PhD Thesis. Liege : HACH, University of Liege (2006)
Dewals, B. Une approche unifiée pour la modélisation d'écoulements à surface libre, de leur effet érosif sur une structure et de leur interaction avec divers constituants, PhD Thesis. Liege : HACH, University of Liege (2006)
Dewals, B., Erpicum, S., Archambeau, P., Detrembleur, S. and Pirotton, M. Depth-integrated flow modelling taking into account bottom curvature. Journal of Hydraulic Research, 44(6): 787-795. (2006)
Erpicum, S., Archambeau, P., Dewals, B. Detrembleur, S. and Pirotton, M. Computation of the Malpasset dam break with a 2D conservative flow solver on multiblock structured grid. In Proc. of the 6th Hydroinformatics Conf., Liong S., Phoon K. & Babovic V. ed., Singapore (2004)
Erpicum, S., Archambeau, P., Dewals, B. Detrembleur, S. and Pirotton, M. Optimisation of hydroelectric power stations operations with WOLF package. In Proc. of Hydropower '05 - The backbone of sustainable energy supply, Stavanger, Norway (2005)
Erpicum, S., Archambeau, P., Dewals, B. Detrembleur, S. and Pirotton, M. 1D and 2D solvers coupling for free surface flow modelling. In Proc. of 7th Int. Conf. on Hydroinformatics, Nice, France (2006)
Erpicum, S. Optimisation objective de paramètres en écoulements turbulents à surface libre sur maillages multibloc, PhD Thesis. Liege : HACH, University of Liege (2006)
Mouzelard, T. Contribution à la modélisation des écoulements quasi tridimensionnels instationnaires à surface libre, PhD Thesis. Liege : HACH, University of Liege (2002)
Pirotton, M. Modélisation des discontinuités en écoulement instationnaire à surface libre. Du ruissellement hydrologique en fine lame à la propagation d'ondes consécutives aux ruptures de barrages, PhD Thesis. Liege : LHCN, University of Liege (1994)