This is an author-deposited version published in:
http://oatao.univ-toulouse.fr/
Eprints ID: 9152
To link to this article: DOI:
10.1016/j.plaphy.2013.05.019
URL:
http://dx.doi.org/10.1016/j.plaphy.2013.05.019
To cite this version:
Ecarnot, Martin and Bączyk , Paulina and Tessarotto ,
Lydie and Chervin, Christian Rapid phenotyping of the tomato fruit model,
Micro-Tom, with a portable VISeNIR spectrometer. (2013) Plant
Physiology and Biochemistry, vol. 170 . pp. 159-163. ISSN 0981-9428
!
O
pen
A
rchive
T
oulouse
A
rchive
O
uverte (
OATAO
)
OATAO is an open access repository that collects the work of Toulouse researchers and
makes it freely available over the web where possible.
Any correspondence concerning this service should be sent to the repository
administrator:
[email protected]
!
Rapid phenotyping of the tomato fruit model, Micro-Tom,
with a portable VISeNIR spectrometer
Martin Ecarnot
a, Paulina Ba
˛czyk
b, Lydie Tessarotto
b, Christian Chervin
b,*aINRA, UMR AGAP, 2 place Viala, 34060 Montpellier Cedex 2, France
bUniversité de Toulouse, INRA-INP/ENSAT, UMR GBF, BP 32607, 31326 Castanet, France
Keywords: Phenotyping Non-destructive Brix TSS Acidity Firmness Dry matter
a b s t r a c t
Tomato (Solanum lycopersicum) quality traits such as juice soluble solid content (Brix), juice pH, color parameters (Hue and Chroma), firmness and water content, are critical factors for fruit quality assess-ment. The need for screening very large numbers of fruit has led to the development of a high-throughput method using visibleenear infrared (VISeNIR) spectrometry. We are reporting here a set of results obtained with a portable spectrometer using the 350e2500 nm range, showing good pre-diction of the quality traits cited above, over a wide range of developmental stages from immature green to ripe tomato fruit, cv. Micro-Tom. This is a rather good set of quality traits compared to previous publications predicting tomato quality with VIS-NIR spectrometry, and the prediction is robust, as it was obtained by grouping sets of different operators. This would be a useful tool to phenotype hundreds of Micro-Tom per day, making it possible to follow the dynamics of the described parameters on growing fruits. Thus the method can be used to study the biochemistry and physiology of fruit development in planta.
1. Introduction
Because sorting large numbers of fruit in a minimum of time and efforts is a concern for breeders and wholesalers, non-destructive techniques such as near infrared spectrometry (NIRS) have received lots of attention in the two past decades[1]. A strong in-terest for spectrometry (as a non-destructive technique), is that information can be collected on the same fruit, at different times. This means that it gives access, not only to punctual information, but also to the dynamics of the measured characteristics. Regarding tomatoes, nice sets of data have been obtained that allowed to predict color and pigment content with good accuracy, as well as firmness to a lesser extent using the 400e1500 nm range[2]. These outcomes have obvious postharvest applications as correlating a spectral signature to tomato quality has a great importance for wholesalers or processors. However, Clément et al. [2]had less accurate results for the soluble solid content (SSC) and the pH. Using a larger wavelength range, 400e2350 nm, He et al.[3] ob-tained good predictions for these two latter parameters, but the color and the water content were not tested. Interesting works also
focused on fruit absorption and diffusion, using time-resolved[4], or spatially resolved[5]spectroscopy to predict fruit properties.
Here we report a set of data and calibrations allowing a good prediction of color main descriptors, Hue and Chroma[6], SSC, pH, firmness and water content using a portable VIS-NIR spectrometer. Those calibrations aim at being robust and accurate. To reach the first goal, it is primordial that the calibration set has a large variety of samples in order to include as many sample types as possible. As for the precision, full visible-NIR range was available, and the use of appropriate pretreatments enhanced it.
We developed the method using the Micro-Tom tomato cultivar, which is widely used in laboratories as a fruit model. This is a dwarf tomato plant developed to perform genomics approaches in the Solanaceae family[7], and a great number of laboratories world-wide are looking for tools for its rapid phenotyping.
2. Results and discussion
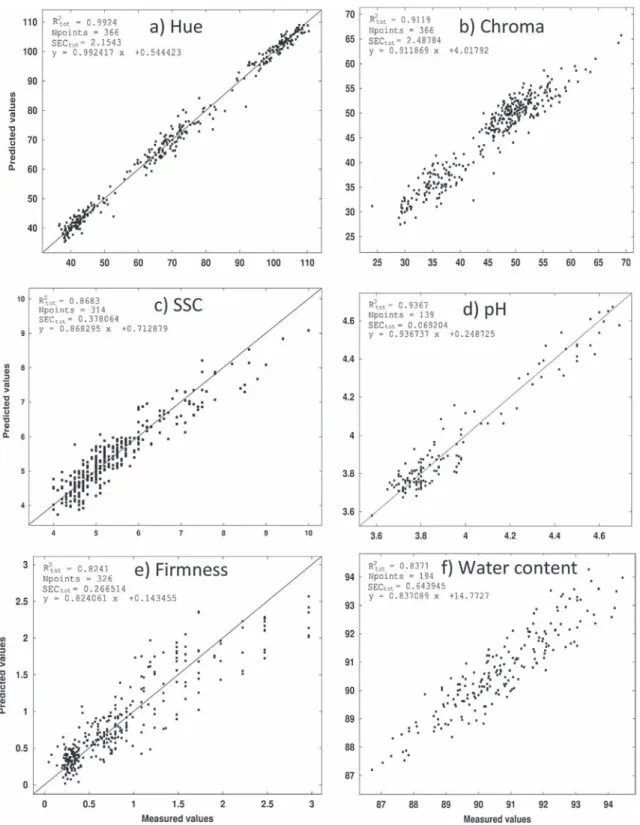
The tomatoes were sampled at various stages of development, corresponding to mature green to fully ripe[8], thus offering a large range of values for the quality parameters, also called reference data in the modeling process. Results of predicted values in the whole calibration set versus the measured (reference) values are shown inFig. 1. Hue angle varied from 110!, mature green-breaker
* Corresponding author.
E-mail address:[email protected](C. Chervin).
tomatoes, to 37!, red tomatoes. OnFig. 1a, it is clear to see the three
sampling groups: mature green-breaker tomatoes with Hue angle ranging from 90 to more than 110, tomatoes turning to yellow-orange with a Hue angle ranging from 60 to 80 and red tomatoes with Hue angle ranging from less than 40 to 50. While chroma data varied from 24, small pigment concentration common in the mature green tomatoes that are turning from green to pale-green,
to 69, fully red tomatoes with a higher pigment concentration. The chroma data were splitted into two groups only, the first one ranging from 30 to 40, corresponding to mature green and breaker fruit and the second one from 45 to 60 corresponding to fruit from turning to red. These wide ranges are very important in getting a good potential for correlating the reference data and the VIS/NIR spectra, as previously obtained by Clément et al.[2].
Fig. 1. Calibration plots for major quality descriptors of Micro-Tom fruit, (a) Hue angle characterizing the color on a chromatic circle, (b) Chroma characterizing the color saturation, (c) Soluble solid content of the juice expressed in Brix degrees, (d) pH of the juice, (e) firmness of whole fruit in N mm"1and (f) water content in %. The R2is the coefficient of
The soluble solid content (SSC) varied from 3.2 to 10!Brix, with
a coefficient of variation around 20% (Table 1). The latter value is rare on Micro-Tom tomatoes and represents a fully ripe fruit. Most of the tomatoes chosen for these experiments had SSC ranging between 4 and 6!Brix (Fig. 1c), which were the mature green,
yellow and pale red tomatoes, with only the fully ripe fruit showing an SSC from 7 to 10!
Brix. This trend of values grouped in the first part of the range was also observed for the pH and the firmness (Fig. 1d and e). On the contrary the water content values of unripe and ripe fruit were sprayed quite evenly over the full range from 87 to 94% of water (w/w), and it may be linked to slight differences in plant water status in various areas of the growth chamber, that are known to influence fruit development[9]. However the coefficient of variation of this water content was rather small, below 2%, and this might have limited the chances to get big differences in the spectral signatures in the water absorption range (primarily 1450 and 1950 nm).
Typical spectra of green, yellow-orange and red tomatoes are shown inFig. 2. The 3 spectra are clearly different in the visible part (350e750 nm), but look similar in the infrared (750e2500 nm) part. The green tomato spectrum is characterized by a valley near 670 nm which is due to chlorophyll absorption. Over the ripening, the chlorophyll valley disappears, and an absorption valley forms in the 400e550 nm, showing the presence of carotenoids.
For the different reference data, spectrum pretreatment was optimized in order to minimize the latent variables and maximize the cross-validation R2. For all data we used the multiplicative scatter correction (MSC), to correct additive and multiplicative ef-fects in the spectra, as it was shown to give interesting results in tomato quality prediction[3]. For all the calibrations, MSC was carried out after wavelength reduction (see remaining wavelength onTable 2). Indeed, the wavelength reduction is also useful for removing noisy parts of the spectrum, thus improving the effect of MSC. All spectra were derived (1st order) and smoothed using a 2nd order polynomial and 9 points of moving window (7 points for water calibration). The 1st order derivation is indeed a good compromise between making appear absorption peaks, and limiting noise generation (as with 2nd order derivation).
The quality of the calibration processes can be assessed by looking at the calibration coefficients of determination listed in
Table 2. For all six quality parameters (reference data), the R2values are bigger than 0.8. The smallest R2obtained for firmness is 0.82, corresponding to an R-value of 0.91. These calibration processes are as good as the best series published so far for tomatoes by He et al.
[3], but we added the data on color prediction and water content that were not tested before in their work.
To quantify the prediction quality, the calibration was tested on the validation set. Plots of predicted values by cross-validation versus measured values are presented inSupplementary data. We observed that the R2of the validation was nearly as good as for calibration in the case of color parameters, Hue and Chroma
(Table 2andFig. 1). This is logical as color is a surface parameter and the spectra are highly related to surface properties, and confirms the good results obtained by a Canadian team[2]. In our study, we obtained better results for the SSC prediction, probably because of the extension of the spectra up to 2500 nm, as the Chinese team obtained quite good results on the SSC prediction with a similar range of wavelengths[3]. The validation results were also very good for prediction of the pH with an R2of 0.90. This confirms that pH prediction by VIS/NIR spectroscopy is working well, as former studies succeeded in this approach on tomatoes[3]and on apples
[10]. The results obtained for validation of the SSC were satisfactory (Table 2 and Fig. 1), with a cross-validation R-value of 0.91 (R2¼0.82) equaling the one published previously for tomato SSC
[3], but we used a data set that was 10-fold larger than this latter study, and it was obtained with two different operators and different batches of fruit, with a 10-month interval. This allows us to describe this SSC prediction as quite robust, as described previ-ously [1]. A previous work had comparable data sets[16], with weaker precision (validation R ¼ 0.69, SEV ¼ 0.52), but only 780e 980 nm range was available. For the firmness, the validation R2was slightly less good that for the other parameters, and there was a higher number of outliers (Tables 1and2). This may also be due to a reference method that is more delicate to use, as Harpenden cali-pers are a hand-held tool with some variation between users. The use of a slower and more expensive tool such as a bench-top firmness tester, with the probes operated by an electric engine, would have probably given better results. However our results are quite similar to those obtained by He et al.[3]and Clément et al.[2]
Table 1
Descriptive statistics of the data set, Hue represents the color on a chromatic circle and is expressed in degrees, Chroma represents the color saturation and is a vector norm, the soluble solid content (SSC) is in degrees Brix, pH in pH units, firmness in N mm"1, and the water content is in %. “n” is the total number of reference data,
“out” is the number of outliers.
Mean Std Dev CV Range n Out
Hue 71.7 24.7 34.5 37e110 367 1
Chroma 45.6 8.4 18.4 24e69 367 1
SSC 5.4 1.0 19.4 3.2e10 319 3
pH 3.9 0.3 7.4 3.6e4.9 142 3
Firmness 0.83 0.65 78 0.05e3 332 6
Water content 90.7 1.7 1.9 87e95 198 4
Fig. 2. Light reflectance of Micro-Tom tomatoes of various ripening stages in the 350e 2500 nm spectral regions.
Table 2
Variables of the predictive models for reference data (detailed inTable 1). R2C totand
SECtotare variables of the calibration with entire set (R2is the determination
coefficient SEC is the standard error of calibration), R2CV and SECV are coefficients of
the leave-one-out cross-validation, R2V and SEV are coefficients of the 2/3e1/3
validation, RPD is the residual predictive deviation, and LV is the number of latent variables.
R2C
tot SECtot R2CV SECV R2V SEV RPD Wavelength
range (nm) LV Hue 0.99 2.15 0.99 2.46 0.99 2.32 10.7 450e1300 13 Chroma 0.91 2.49 0.91 2.58 0.90 2.75 3.24 450e2100 12 SSC 0.87 0.38 0.82 0.45 0.82 0.45 2.42 1150e2300 13 pH 0.94 0.07 0.91 0.08 0.90 0.089 3.45 450e1900 14 Firmness 0.82 0.27 0.78 0.30 0.76 0.30 2.14 450e2300 13 Water content 0.84 0.64 0.77 0.77 0.73 0.83 2.08 1350e2100 12
on smaller batches of tomatoes, as their cross-validation R2values for firmness were 0.67 and 0.75, respectively. We also obtained interesting results for predicting the water content, a parameter that was not tested in the two previous papers on tomatoes[2,3]. The calibration R2 of 0.84 was fairly high (Table 2), however the cross-validation R2obtained by the leave-one-out method was only of 0.77. This can be firstly explained by the very low variability of the water content in tomatoes. Nevertheless, the prediction of water content is economically very important, as the fruit weight is the critical parameter impacting postharvest prices and also yield estimation. It is also strongly linked to dry matter, which could be predicted as well using similar methods.
The SECV represent 3.4%, 5.7%, 6.6%, 6.1%, 10.2% and 9.6% of the full calibration set of Hue, Chroma, SSC, pH, firmness and water content, respectively (calculated fromTables 1and2). These values give also some good indication of the precision of the prediction. Obviously the firmness and the water content were the two pa-rameters predicted with slightly less accuracy, even if for some rapid and non-destructive screening of fruit batches in postharvest handling or breeding programs, such a precision may be sufficient to be economically interesting.
In conclusion, we are presenting here the most comprehensive set of data up-to-date to assess six very important quality traits of tomato, by using a rapid and non-destructive VIS/NIR method, in association with PLS calibration and leave-one-out cross-valida-tion. The robustness of this set of data, is quite good, as it has been compiled with different operators and different batches of fruit. The speed at which the method runs would allow testing around 200 tomatoes per hour.
The tool that is presented here makes it possible to assess to-mato biochemical changes throughout fruit ripening. Thus, this non-destructive technique with a portable spectrometer, can be used in planta. The dynamics of these changes could help to better understand the physiological and biochemical processes during fruit development and ripening.
This set of data has been validated with one tomato cultivar only, Micro-Tom, as it is going to be a very important tool in Solanaceae genomics in the coming years[7]. But applications to other tomato cultivars and small berries would be worth further studies. The models established with Micro-Tom cannot be applied to the to-mato cv. Ailsa Kraig (data not shown), but performing a different calibration set is possible. Furthermore the prediction of SSC or water content should be possible in tomatoes with different pigment content (like never-ripe or high-pigment) as the visible part of the spectra has been removed from the data set in calibra-tions for such quality traits.
3. Materials and methods 3.1. Plant material
Tomatoes (Solanum lycopersicum) cv. Micro-Tom, were grown in culture rooms under controlled conditions set as follows: 14-h-day/ 10-h-night cycle, 25/20 !C day/night temperature, 80% relative
humidity, 250 lmol m"2s"1intense light. Tomatoes were harvested
at different stages of development from 30 to 55 days after full bloom, to ensure a wide range of color and maturity stages. 3.2. Spectral measurements
Two reflection spectra (350e2500 nm) were taken at two oppo-site positions around the equator (approximately 180!) of each
to-mato with a field spectrometer (LabSpec 5000, Analytical Spectral Devices, Inc.). Two spectra per fruit were shown to be an acceptable number of data acquisition, even if 3e6 spectra per fruit gave even
greater precision [11]. For each reflectance spectrum, the scan number was set at 50. Thus, the total scan number for each example was 2 $ 50 (50 on each opposite side). The spectrometer was equipped with a 6 mm diameter reflectance probe (cat numb 135680, Analytical Spectral Devices, Inc.) powered by an external light supply located in the spectrometer box. To some extent this probe is a device close to what some authors call interactance probe, as the emitted light goes to the fruit target using glass fibers that are parallel to the fibers conducting the reflected light back in the analyzer[1]. To limit the collection of external light signals, the probe extremity was inserted into a black rubber stopper, which was adjusted so the probe touched the fruit surface, and was surrounded by this “black collar”. The reflectance base line was set with the use of a white Spectralon!
standard (Labsphere, Inc., New Hampshire, USA). 3.3. Physico-chemical measurements
Surface color was assessed with a chromameter (CR400, Konica Minolta), using the D65 illuminant and the L*, a*, b* space, and the data were processed to obtain Hue and Chroma as previously described[6]. Hue represents the color on a chromatic circle and is equal to tan"1(b*/a*) expressed in degrees, note that there is a þ180 correction added when a < 0. Chroma is the Euclidean norm of the a*, b* vector and represents the color saturation. The firmness was assessed using Harpenden calipers (British Indicators Ltd.), and the fruit deformability was transformed to firmness using the formulae described previously[12]. The firmness values obtained here were within a similar range than those obtained by latter authors on a different cultivar. Then quarters of tomatoes were cut and weighted, before being dried in a 60!C oven for three days, and weighted again
to get the water content. The remaining fresh tissues were grounded in an Eppendorf tube using a glass rod, the tube was centrifuged for 2 min at 16,000g and the juice was used to determine the SSC with a hand-held refractometer (Master 20T, Atago) and the pH using a mini-probe (HI1330B, Hanna) in a 1.5 ml Eppendorf tube.
3.4. Data processing
Pretreatment and calibration were developed thanks to SAISIR chemometrics package (http://www.chimiometrie.fr/saisir_ webpage.html) and GNU Octave software (http://www.gnu.org/ software/octave).
For each quality parameters to predict, PLS regression[13]was used to develop calibrations. The number of latent variables was determined with the lower standard error (SE) of leave-one-out (LOO) cross-validation (CV): with n samples, calibration was built on n " 1 samples and validated on the remaining one. The whole set was then randomly divided into a calibration set (2/3) and a validation set (1/3) (“2/3e1/3”). Coefficient of correlation (R2) and SE were computed from full set calibration (R2C
totand SECtot), and
“2/3e1/3” validation (R2V and SEV) sets. “2/3e1/3” calibration and validation was repeated 10 times, and then R2V and SEV were averaged. Residual predictive deviation (RPD), defined as the ratio between the standard deviation of the whole set and the standard error of cross-validation (SECV) was computed.
Pretreatments were applied on the spectra before carrying out the regression.
The first correction applied to the spectra is to remove the gap generated by the switch from one detector to the other (1000 and 1830 nm). The five points before the switch were linearly fitted in order to estimate the first point after this switch. The gap between the measured and estimated values for this point was then sub-tracted from all subsequent points. A Multi Scatter Correction (MSC)[14]was then applied to remove light scattering effects that can be different from one sample to the other. The total reflectance
spectra are reduced in order to keep only wavelength that are correlated to the parameter to predict. For this purpose, several wavelength reductions are tested, and the best one is retained. Finally, absorption peaks are enhanced thanks to a SavitzkyeGolay spectrum derivation[15].
Those pretreatment were tested with different parameters (wavelength reduction, parameters in derivation) and the best combination was kept, on the basis of the higher cross-validation determination coefficient (R2CV). R2
C the outliers were defined with a filter set at &30% of the full range of the errors in the pre-dicted vs measured cross-validation.
Acknowledgments
Acknowledgments to the Institute National Polytechnique de Toulouse for financial support (Preciput ANR) regarding the VIS/NIR spectrometer equipment, and to the COST action FA1106 “Quality-Fruit”. We also thank two anonymous referees for their time and comments.
Appendix A. Supplementary data
Supplementary data related to this article can be found at
http://dx.doi.org/10.1016/j.plaphy.2013.05.019. References
[1] B.M. Nicolaï, K. Beullens, E. Bobelyn, A. Peirs, W. Saeys, K.I. Theron, J. Lammertyn, Nondestructive measurement of fruit and vegetable quality by means of NIR spectroscopy: a review, Postharvest Biol. Technol. 46 (2007) 99e118.
[2] A. Clément, M. Dorais, M. Vernon, Nondestructive measurement of fresh to-mato lycopene content and other physicochemical characteristics using visible-NIR spectroscopy, J. Agric. Food Chem. 56 (2008) 9813e9818.
[3] Y. He, Y. Zhang, A.G. Pereira, A.H. Gómez, J. Wang, Nondestructive determi-nation of tomato fruit quality characteristics using VIS/NIR spectroscopy technique, Int. J. Inform. Technol. 11 (2005) 97e108.
[4] P. Eccher Zerbini, M. Vanoli, A. Rizzolo, S. Jacob, A. Torricelli, L. Spinelli, R.E. Schouten, Time-resolved reflectance spectroscopy as a management tool in the fruit supply chain: an export trial with nectarines, Biosyst. Eng. 102 (2009) 360e363.
[5] Y. Peng, R. Lu, Analysis of spatially resolved hyperspectral scattering images for assessing apple fruit firmness and soluble solids content, Postharvest Biol. Technol. 48 (2008) 52e62.
[6] R.G. McGuire, Reporting of objective color measurements, HortSci. 27 (1992) 1254e1255.
[7] K. Aoki, K. Yano, A. Suzuki, S. Kawamura, N. Sakurai, K. Suda, A. Kurabayashi, T. Suzuki, T. Tsugane, M. Watanabe, K. Ooga, M. Torii, T. Narita, T. Shin-I, Y. Kohara, N. Yamamoto, H. Takahashi, Y. Watanabe, M. Egusa, M. Kodama, Y. Ichinose, M. Kikuchi, S. Fukushima, A. Okabe, T. Arie, Y. Sato, K. Yazawa, S. Satoh, T. Omura, H. Ezura, D. Shibata, Large-scale analysis of full-length cDNAs from the tomato (Solanum lycopersicum) cultivar Micro-Tom, a refer-ence system for the Solanaceae genomics, BMC Genomics 30 (2010) 11e210. [8] R.L. Shewfelt, J.K. Brecht, C.N. Tai, Classification of tomato ripeness and
maturity by food colorimetry, HortSci. 27 (1992) 651.
[9] T. De Swaef, K. Steppe, K. Verbist, W. Cornelis, Tomato stem and fruit diameter dynamics in response to changing water availability, Acta Hortic. 952 (2012) 953e957.
[10] J. Lammertyn, B. Nicolaï, K. Ooms, V. De Smedt, J. De Baerdemaeker, Non-destructive measurement of acidity, soluble solids, and firmness of Jonagold apples using NIR-spectroscopy, Trans. ASAE 41 (1998) 1086e1094. [11] N. Khuriyati, A. Matsuoka, S. Kawano, Precise near infrared spectral
acquisi-tion of intact tomatoes in interactance mode, J. Near Infrared Spectr. 12 (2004) 391e395.
[12] P. Lesage, M.F. Destain, Measurement of tomato firmness by using a non-destructive mechanical sensor, Postharvest Biol. Technol. 8 (1996) 45e55. [13] H. Martens, T. Næs, Partial least squares regression, in: Multivariate
Calibra-tion, John Wiley & Sons, 1998, pp. 116e165.
[14] T. Isaksson, T. Næs, The effect of Multiplicative Scatter Correction (MSC) and linearity improvement in NIR spectroscopy, Appl. Spectrosc. 42 (1988) 1273e 1284.
[15] A. Savitzky, M.J.E. Golay, Smoothing and differentiation of data by simplified least squares procedures, Anal. Chem. 36 (1964) 1627e1639.
[16] K.H.S. Peiris, G.G. Dull, R.G. Leffler, S.J. Kays, Near-infrared (NIR) spectrometric technique for nondestructive determination of soluble solids content in pro-cessing tomatoes, J. Am. Soc. Hortic. Sci. 123 (1998) 1089e1093.