O
pen
A
rchive
T
OULOUSE
A
rchive
O
uverte (
OATAO
)
OATAO is an open access repository that collects the work of Toulouse researchers and
makes it freely available over the web where possible.
This is an author-deposited version published in :
http://oatao.univ-toulouse.fr/
Eprints ID : 12781
Official URL:
http://dx.doi.org/10.1109/CGC.2013.75
To cite this version :
Da Costa, Georges and Zilio, Thomas and Jarus,
Mateusz and Oleksiak, Ariel Energy - and Heat-aware HPC Benchmarks.
(2013) In: International Workshop on European Actions Towards
Eco-Friendly Data Centers (EuroEcoDc), co-located with 3th International
Conference on Cloud and Green Computing (CGC 2013), 30 September 2013
- 2 October 2013 (Karlsruhe, Germany).
Any correspondance concerning this service should be sent to the repository
administrator:
[email protected]
Energy- and Heat-aware HPC benchmarks
Georges Da Costa ([email protected])
Thomas Zilio ([email protected])
IRIT, Toulouse University
Mateusz Jarus ([email protected])
Ariel Oleksiak ([email protected])
Pozna´n Supercomputing and Networking CenterAbstract—To evaluate data centers is tough. Several metrics are available to provide insight into their behaviour, but usually they are tested using simple benchmarks like linpack for HPC oriented data centers. A good choice of benchmarks is necessary to evaluate all the impact of applications on those data centers. One point that is often overlooked is their energy- and thermal-quality. To evaluate these qualities, adequate benchmarks are required from several points of view: from the nodes to the whole building.
Classical benchmarks selection mainly focuses on time and raw performance. This article aims at shifting the focus towards an energy- and power-point of view. To this end, we select benchmarks able to evaluate data centers not only from this performance perspective, but also from the energy and thermal standpoint. We also provide insight into several classical bench-marks and method to select an adequate and small number of benchmarks in order to provide a sensible and minimum set of energy- and thermal-aware benchmarks for HPC systems.
I. INTRODUCTION
Power consumption is of major importance now for HPC datacenters as large power consumption became a barrier that prevents from reaching exascale computing.
Usually, data centers are evaluated only using instanta-neous power consumption of the computing elements like for the Green500[1] list of most powerful supercomputers. It is already a first step in the right direction compared to raw computing power evaluation like the Top500[2] list.
More general evaluations try to take into account all power-related costs, like cooling or infrastructure consumption. For instance PUE links the total power consumption of data-centers to the one that goes actually to the computing elements.
One of the usually overlooked element is the time dimen-sion. Due to time and power consumption, different amounts of heat are to be managed by the cooling infrastructure. Also thermal considerations are quite important as power consump-tion of electronic elements is directly linked to temperature[3]. As an example, similar servers can have different power consumption for the same workload just due to their position in a rack[4].
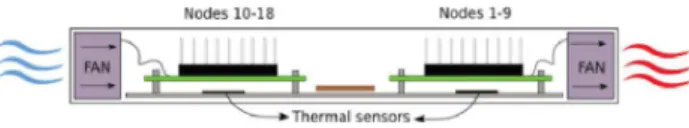
For more recent high density architecture, heat flow has even more impact. For instance in RECS[5], air flow from one node goes through another node as shown in Figure 9.
The CoolEmAll project aims at providing tools to evaluate the energy- and thermal-quality of data centers, from several points of view: from the nodes to the whole building. One element to provide this evaluation will be reference bench-marks. Classical benchmarks mainly focus on time and raw performance.
Fig. 1. Airflow in RECS: a high density computing infrastructure. Air flow comes from the side, go through two heat-sinks before leaving the server case. Each server case is composed of 9 such rows.
Indeed a large number of benchmarks with different goals are available. It is not possible to run all existing benchmarks while evaluating a data center. Thus a choice of representative benchmarks is necessary. If selected wisely, those selected benchmarks can serve for evaluation purpose for a data center infrastructure, but also for its middleware. They can also be used to evalute metrics related to power, energy and heat. Also, those benchmarks can be used for standardization purposes as there is a lack of standard for heat-related evaluation of data centres.
This article shows a methodology that leads to select a minimum set of benchmarks able to evaluate data centres not only from performance point of view, but also from the energy and thermal point of view.
The rest of this article is organized as follows: Section II will provide an overview of the benchmarks tested on the CoolEmAll platform, but also of the limits of one of the most classical power-related benchmark: SPECPower.
Section III will show the proposed methodology to select interesting benchmarks.
Section IV will provide experimental results of the selected benchmarks’ impact on power and temperature. Those data will serve as a basis for the selection of representative bench-marks.
The final section (Section V) will describe the selec-tion process of representative benchmarks, as well as the selected ones. Those benchmarks will be used as a first set of benchmarks to evaluate the behaviour of the CoolEmAll infrastructure during the life of the project.
II. HPCBENCHMARKS
A. Energy- and Heat-aware existing benchmarks
Most benchmarks are performance-oriented. One of the few power-oriented benchmarks is the standardized SPECBench-mark. Surprisingly, to our knowledge no benchmark set is available to evaluate precisely the energy and heat behavior of HPC systems. This comes from at least two reasons: First the standardization process is usually quite long to define new
benchmark sets, and this thematic has only been put on the spotlight recently. As a matter of comparison, PUE (Power usage effectiveness), which is a measure of how efficiently a data center uses its power, is still under standardization while being a reference in data centers since years. Second, precise hardware equipment to measure power consumption and heat production are widely available only since recently. Without those data it was difficult to define good quality benchmark sets.
B. Performance only benchmarks
There are several types of benchmarks used to evaluate HPC benchmarks. The three most classical kinds of bench-marks are:
• Micro benchmarks, testing only one particular sub-system like memory accesses;
• Single-host benchmarks, usually used to test a partic-ular host;
• Classical distributed benchmarks from the HPC com-munity like NPB (Nas Parallel Benchmarks). Those level of benchmarks follow the different levels an architecture can be tested: Node level, Node-group level and Rack level.
Those benchmarks usually provide insight into the raw computing performance of data centers, but as seen in the next section, they can be used in energy- and thermal-context.
1) MemLoop (Micro benchmark): MemLoop[6] is a micro-benchmark used to load the memory subsystem. It can load at several levels the memory hierarchy and has been used in other projects in order to model the impact of memory accesses on node power consumption. In the current benchmark case, it is used to charge the memory at full capacity.
2) CpuBurn (Micro benchmark): CpuBurn[7] is designed to load x86 CPUs as heavily as possible for the purposes of system testing. There are several versions optimized for different processors. FPU and ALU instructions are coded an assembler endless loop. They do not test every instruction. The goal has been to maximize heat production from the CPU, putting stress on the CPU itself, cooling system, motherboard (especially voltage regulators) and power supply. It makes nearly no memory access or bus access of any kind.
3) Pybench (Single-host benchmark): Pybench[8] offers a standardized way to measure the performance of Python implementations. In the past it has been used to track down performance bottlenecks or to demonstrate the impact of optimization and new features in Python. In contrast to the other benchmarks, it was run on one core only to test the power profile of servers running single-threaded applications
Pybench is a single-threaded application; it therefore places a much smaller load on the processor.
4) OpenSSL (Single-host benchmark): The OpenSSL Project[9] is a collaborative effort to develop a robust, commercial-grade, full-featured, and Open Source toolkit im-plementing the Secure Sockets Layer (SSL v2/v3) and Trans-port Layer Security (TLS v1) protocols as well as a full-strength general purpose cryptography library. The openssl
Fig. 2. C-ray power consumption and CPU temperature over time
application that ships with the OpenSSL libraries can perform a wide range of cryptography operations and can be used as a benchmark for processors and memory. As a benchmark, it tests the signing and decoding of messages using several cryptography algorithms such as md5, sha1, rsa, and others.
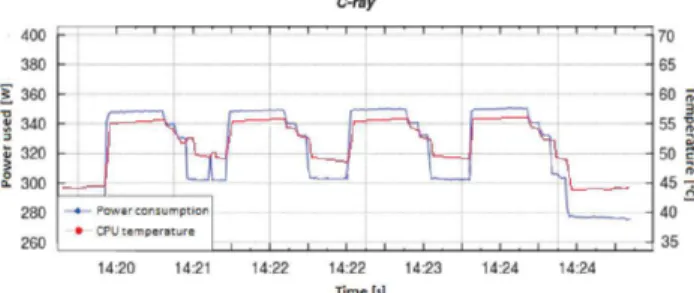
5) C-ray (Single-host benchmark): This is a simple ray-tracing benchmark[10], usually involving only a small amount of data. This software measures floating-point CPU perfor-mance. The test is configured with a significantly big scene, requiring about 60 seconds of computation but the resulting image is written to /dev/null to avoid the disk overhead. Its execution consists of periods of higher and lower load. Figure 2 presents the power consumption of the CPU (Intel Xeon 5160) and its temperature while running C-ray. Small inertia of the temperature is visible in this graph.
6) Abinit (Single-host benchmark): It is a software for ma-terials science[11], computing electronic density and derived properties of materials ranging from molecules to surfaces to solids. It is mainly written in FORTRAN and can be deployed as a parallel workload using MPI. In the given tests, Abinit was used to calculate one of the example inputs shipped with the source package.
7) Nas Parallel Benchmark (Distributed benchmark): One of the most used HPC benchmark is the NAS Parallel Bench-mark suite [12]. This benchBench-mark provides 7 applications (IS, FT, EP, BT, LU, CG and SP) with workloads representatives of HPC applications. They exhibit a range of behaviours between an embarrassingly parallel code (EP) to decomposition of matrix (LU) encompassing both computations and communi-cations phases. Each of those applicommuni-cations is well described in the literature and presents well-known communication and computing patterns.
The original benchmarks specified in NPB 1 mimic the computation and data movement in computational fluid dy-namics (CFD) applications: four kernels
• IS - Integer Sort, random memory access • EP - Embarrassingly Parallel
• CG - Conjugate Gradient, irregular memory access and communication
• FT - discrete 3D fast Fourier Transform, all-to-all communication
and three pseudo applications
• SP - Scalar Penta-diagonal solver • LU - Lower-Upper Gauss-Seidel solver
All those applications or kernels use either a communica-tion library like MPI or a shared memory library like OpenMP.
C. SPECPower
The Standard Performance Evaluation Corp. (SPEC) has released SPECpower ssj2008[13], one of the first industry-standard benchmark that measures power consumption in relation to performance for server-class computers. The aim of this benchmark suite is to evaluate industry-type compute equipment and define the whole software stack to use. It also defines a list of accepted power measurement tools.
Its goal is slightly different from the goal of this article, which aims to assess points of comparison between data-centres, but also scheduler from an energy- and thermal- point of view. SPECPower focuses on power and does not address the thermal impact of application and middleware on the infrastructure.
The benchmark itself has a closed source with a fee to access the benchmark. The methodology is provided with an open access. The experimental plan is provided. A measure-ments plan always starts with a few runs for warming up the infrastructure, then the real measurements starts at 100% load, going down by 10-percent segments.
It uses classical operations for a corporate selling site like: New Order, Payment, Order Status, Stock Requests, and Cus-tomer Report. It is oriented towards cloud-like infrastructures more than HPC-ones.
The output of the benchmark is an aggregated value con-cerning CPUs, caches, memory hierarchy, and the scalability of shared memory processors (SMPs), as well as implementations of the Java Virtual Machine (JVM), JIT (just in time) compiler, garbage collection, threads, and some aspects of the operating system.
III. BENCHMARKEVALUATION
A. Methodology
The goal of this article is to describe the methodology that can lead to select the necessary benchmarks to evaluate a data center as a whole: infrastructure, scheduler, but also the whole integration of the work-flow.
From a higher level, the methodology is as follows: 1) Monitoring of resource usage, power-profile and time
for a large number of benchmarks;
2) Clustering of benchmarks depending on the measure-ments;
3) Selection of representative benchmarks.
B. Monitoring
In order to select benchmarks, data on their behaviour is required. Precise profiles or their resource consumption but also of their power consumption is needed as well as precise information on those data over time.
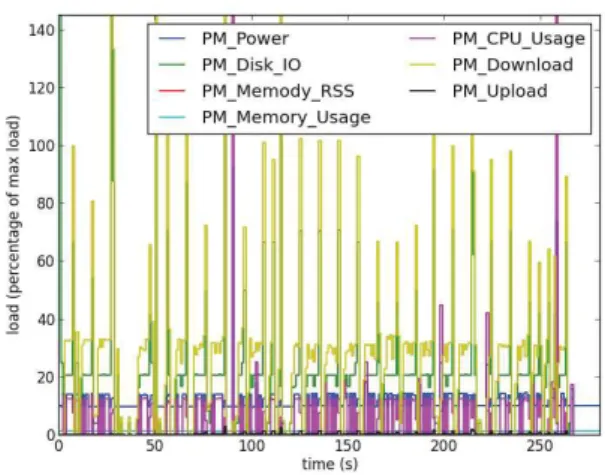
Fig. 3. Fine-grained monitoring of a net and disk benchmark
In order to select benchmarks, the profiles concern all the subsystems, such as processor usage but also memory, network, disk,... Those data are of three types:
• system values: values that concern the interaction of the benchmark with the Operating System (OS); • hardware counters: values that concern processor and
buses;
• power monitoring.
1) System monitoring: As applications are managed by the OS, all high level values are measured by it. It is possible for example to measure the number of bytes sent or received over the network or read and written to the disk. It is also possible to monitor the load of a particular application compared to the others.
2) Hardware counters: Hardware counters are monitoring tools for profiling applications that are inserted directly in the hardware of the CPU. These tools provide very fine-grained information about the software execution. The counters can generally be configured to gather information of different components from the CPU point of view. They can provide information about the number of memory or cache accesses, or the number of floating point instructions and can be further used to to discriminate different classes of applications[14].
This type of application monitoring is very dependent on the architecture and manufacturer of the processor. Generally this information is retrieved at the OS level with an abstraction that lets use the same counters across different architectures.
Figure 3 presents an example of the monitoring of an application where two phases are alternating. The red line is an evaluation of the change in resource consumption between one second and the next.
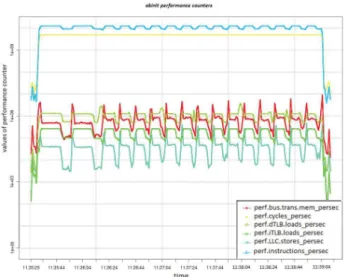
Similarly, Figure 4 presents the monitoring of abinit ap-plication. It clearly shows the values of different performance counters that can be used to further discriminate the classes in a quantitative way taking into account various criteria, such as main memory usage.
Fig. 4. Values of performance counters for abinit application
Fig. 5. Average node power consumption while running different several benchmarks for different CPU frequencies.
3) Power monitoring: In order to evaluate the heat impact of benchmarks, it is important to monitor its power consump-tion during its life-time. There are two techniques to obtain this power consumption:
• External measurement: it consists of plugging the servers running the benchmarks on monitored outlets such as intelligent PDU (Power Distribution Units); • Power models: it is also possible to use models
that take as input the resource consumed by the benchmarks and computes using models its theoretical power consumption[15].
Figure 5 presents the power consumption of the whole node while running OpenSSL, C-ray and Pybench applications. OpenSSL and C-ray put higher load on the CPU than Pybench, therefore the power consumption is also higher in case of these two applications.
4) Benchmarks profiles: Usually, the monitoring infrastruc-ture measures all of the previously described data every second.
Fig. 6. Coarse-grained monitoring of a network and disk benchmark (same as Figure 3)
Fig. 7. C-ray at a coarse-grained level
The focus of this article is the thermal impact of benchmarks. From this point of view, a split-second phenomenon has little impact on the heat. Heat changes are due to change of power over some time as on such system there is usually a large thermal inertia because of heat-sinks for example.
For this reason, benchmarks are characterized at a coarser grain than one second. They will be characterized using phases which are periods of time during which their resource usage do not vary to much. If a large variation of resource usage is detected after a pre-defined amount of time, a new phase is detected. This amount of time is there to ensure the change will have a thermal impact.
Each second a vector of monitored data will define the behaviour of an application during this second. This vector is aggregated (averaged) for the duration of an application or a phase in order to obtain a signature vector. This signature vector represents the resource consumption of the application or phase and can be used to evaluate the thermal impact of this phase or application.
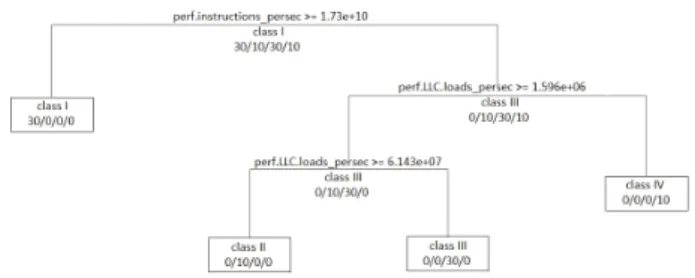
Fig. 8. Example of classification tree for 4 classes
Using those coarse grained benchmark profiles it is pos-sible to classify their behaviour as it makes comparison of benchmarks easier.
As an example, a benchmark with a complex behaviour such as transferring a file over the network is a succession of really different phases as shown in Figure 6. On the contrary a simple benchmark like C-ray which has quite a simple cpu-intensive behaviour can be considered as a single phase even if there are slight variation of resource consumption over time as shown in Figure 7.
C. Benchmark clustering
In order to find the smaller set of benchmarks that pro-vides the maximum diversity of behaviour, similar profiles are grouped together using clustering algorithms. Indeed if two benchmarks have exactly the same profile, it means it is not interesting to execute them both as they will evaluate the same profile.
To create the groups of applications sharing similar char-acteristics, the hierarchical clustering with the Ward’s method is used[16], where the objective function is the error sum of squares. It minimizes the total within-cluster variance. At each step, the pair of clusters that leads to the minimum increase in total within-cluster variance after merging is selected. The result of this method is a dendrogram, a special tree structure that shows the relationships between clusters.
Using this method it is possible to choose the number of categories depending on the depth selected on the dendrogram. An example of a classification tree leading to 4 classes of benchmarks is shown in Figure 8. In places where the tree branches out different conditions are visible that specify which branch to choose for a particular case.
This method can be used at several grains. It can be used at the whole application level, such as shown in Figure 8, or independently for each monitored resource. In the following, the clustering will be applied at the resource level.
D. Benchmark selection
The goal of selecting benchmarks is to provide interesting behavior. Contrary to a classical multi-dimension clustering, the clustering is done independently on each (dimension). Two benchmarks with exactly the same clusters will be considered as equivalent. In this case any of them can be selected as the representative of this class.
The goal of this research is to provide benchmarks which can be used to evaluate the power, energy and thermal behavior of platforms. The selection will particularly take into account benchmarks with the same resource consumption but with different power, energy and thermal impact.
IV. ANALYSIS OF BENCHMARKS’PROFILES The first two phases are presented in Table I. Applications were executed on the CoolEmAll testbed at PSNC.
A. Experimental setup
The primary project testbed for performing thermal and energy oriented experiments is located at PSNC (Poznan, Poland) and it is based on the RECS (Resource Efficient Cluster Server) system units delivered by Christmann1.
The RECS that was used during experiments is a RECS 2.0 base system fully equipped with eighteen Intel i7 nodes interconnected with a Gigabit network as shown in Figure 9.
• 14 nodes: CPU: Intel Core i7-3615QE CPU @ 2.30GHz, CPU Cache: 6144 KB, RAM: 16 GB • 4 nodes: CPU: Intel Core i7-2715QE CPU @
2.10GHz, CPU Cache: 6144 KB, RAM: 16 GB Experiments were executed on the i7-3615QE part of the infrastructure.
In the context of the present article, the selected commu-nication method for NPB was MPI using OpenMPI library and 4 nodes were used. The programs were compiled using GNU Fortran compiler 4.4.6. Other application were compiled using gcc 4.4.6. The operating system is CentOS 6.3 and the submission system for the HPC workload is Slurm.
From a technical point of view, results provided in the following use the whole CoolEmAll HPC platform: Job sub-mission, Application monitoring, Application profile. The data are obtained from several levels:
• System level (network, disk, load)
• kernel level using hardware performance counters (main memory, cache access, branch instructions). There is one measurement every second. Power consumption is monitored for each node every second using external power-meter.
All data are obtained through application monitoring that fills an internal database. Once execution of a benchmark is finished, those monitored data are treated in order to obtain the benchmark profiles and then the classification.
Those profiles (Table I) show that most of the benchmarks have different ways to access resources. As a remark, even if not shown on those graphs, the resource consumption of those benchmarks is mostly constant during their lifetime and across nodes. On more complex applications, it would not be the case. For instance, C-ray has a more periodic power consumption profile as seen in the previous section. This periodic behaviour has an impact on its power consumption which is lower than
Level Network Main memory Cache Branch Instruction
Disk Load Low EP, CpuBurn,
C-ray, LoopMemory, OpenSSL, PyBench, Abinit
EP, CpuBurn, OpenSSL, PyBench
LoopMemory SP,BT, EP, LU All Medium CG, SP, BT, LU FT, SP, BT, LU,
CG, C-ray
CG, SP, LU, IS, Py-Bench
IS,FT, CG, C-ray, OpenSSL, PyBench, Abinit High IS, FT IS, LoopMemory,
Abinit FT, EP, BT, CpuB-urn, OpenSSL, C-ray, Abinit CpuBurn, LoopMemory All
TABLE I. RESOURCE USAGE OF BENCHMARKS
Fig. 9. RECS structure. In a 1U rack space it can pack up to 18 computing elements
others. But even C-ray has a quite simple profile as shown in Figure 7 as the variation of resource consumption stays small on the tested infrastructure.
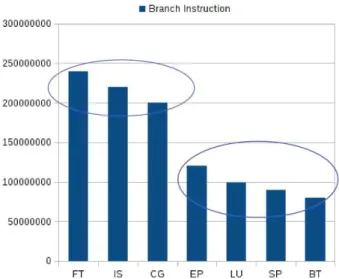
Those levels were obtained using clustering techniques with the objective of less than three categories. For certain categories such as disk access, the classification was done by hand, knowing that the current infrastructure does not have any disk hardware. As an example, Figure 10 an Figure 11 show an example of clustering for a subset of benchmarks (NPB) for respectively: Branch Instructions and Cache References.
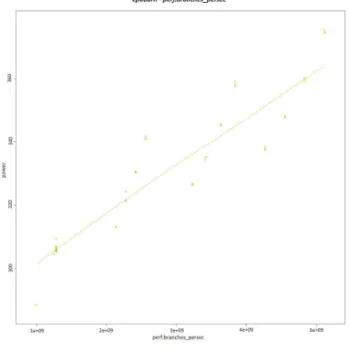
Figure 12 and Figure 13 present the values of branches persec performance counters in relation to the power consumed by the node. The values in case of Burn application are an order of magnitude higher than in case of the C-ray benchmark.
From a power-consumption point of view, they are clas-sified using the same methodology. The thermal impact of a benchmark is the impact of running it once as a classical application. Thus, a high power benchmark that lasts only a few seconds will have a limited thermal impact due to the inertia of the heat-sink. See Figure 14 for example of thermal impact of several benchmarks. Similarly, Figure 15 presents the temperature of the CPU during the application execution. Higher temperature is clearly visible in case of two benchmarks: C-ray and OpenSSL. The effect is different if the high power lasts for a long time. The thermal impact is not applicable for the repetition of the same benchmark. Also as we can see between Table I and Table II, applications with the same loads have completely different power-, energy-, and thermal profiles. Load-only is not sufficient to discriminate
Fig. 10. Example of resource clustering: NPB benchmarks have two behaviros concerning their cache references.
Fig. 11. Example of resource clustering: NPB benchmarks have two behaviros concerning their call to branch instructions.
Level Power Consumption Length Thermal Impact Low IS, EP, Pybench,
LoopMem-ory
EP, IS, Pybench EP, IS, Pybench Medium FT, C-ray CG, FT FT, CG, LoopMemory High SP,BT,LU,CG, OpenSSL,
CpuBurn, Abinit
SP, BT, LU, CpuBurn, OpenSSL, C-ray, LoopMemory, Abinit
LU, SP, BT, CpuBurn, C-ray, OpenSSL, Abinit
TABLE II. POWER-CONSUMPTION OF BENCHMARKS
Fig. 12. Values of perf.branches persec performance counter for Burn application.
Fig. 13. Values of perf.branches persec performance counter for C-ray application.
Fig. 14. Mean temperature of air that passed through a heat-sink during several benchmarks after an idle period.
Fig. 15. Mean temperature of the CPU while running several benchmarks.
between different benchmarks from the point of view of their impact on resources.
V. POWER-ANDTHERMAL-AWARE SELECTION OF BENCHMARKS
Tables I and II show a large variety of behaviours be-tween benchmarks concerning resource consumption, power consumption and heat production.
The final objective of this article is to find interesting representative benchmarks that give the most insight into the behaviour of a data-center. As an example, those two categories are considered interesting in this context:
with the current benchmarks, for instance IS and FT have similar but not exactly equal resource profiles, but have completely different power and heat impacts. The most identical benchmarks from the point of view of resources with different power and heat impact are EP and CpuBurn.
• Different resources/same power: in the contrary it is interesting to have several benchmarks using different means but with similar impact. For instance IS and EP have similar time and power characteristics while using completely different subsystems.
Using the currently available data it is thus possible to create several of such categories, then to choose a representative benchmark out of each category.
Different levels of load are necessary for some metrics like the extended version of PUE. Several methods are available to obtain those levels. It is possible to reduce the number of nodes running the benchmarks, i.e. using the middleware to tune the obtained load. In this case there will be a large asymmetry between the nodes. Another method is to reduce the workload on each node of the infrastructure. From some metrics those two methods are the same, for instance from the productivity, the two methods process the same work. But for other metrics like thermal imbalance the second is better as all nodes have the same temperature. For total energy consumed, the first one is better as it uses fewer servers.
As of now, running EP, CpuBurn and IS already provides an interesting insight from the resources point of view, but also from the thermal point of view as using those three benchmarks satisfies the two proposed categories. Results from experimen-tation shown in Table I and Table II show that an interesting benchmark-set is: EP, CpuBurn, IS, LoopMemory, C-ray and CG as a first benchmark set out of the 12 currently available benchmarks. Those benchmarks provide a good coverage of most of the available resource consuming level possibilities.
VI. CONCLUSION AND NEXT STEPS
The goal of this article was to propose the methodology to select a set of benchmarks that can be used in order to evaluate an HPC data-center from an energy- and thermal-point of view. As an example, the selected benchmarks will be used to assess the infrastructure of the CoolEmAll project, but also the quality of its middleware and will help to define interesting metrics. It is of particular interest for this project as one of its goal is to propose innovative schedulers. Indeed, the thermal impact of a benchmark is linked to its temporal behaviour.
As of now, running EP, CpuBurn and IS already provide an interesting insight from the resources point of view, but also from the thermal point of view. Results from experimentation shown in Table I and Table II show that an interesting benchmark-set is: EP, CpuBurn, IS, LoopMemory, C-ray and CG as a first benchmark set out of the 12 currently available benchmarks.
The next step will consist of executing a larger variety of benchmarks now that the prototype is up and running, linking those benchmarks with the result of not only resources
measured, but also the results of other metrics than the raw computing performance one, energy- and thermal-metrics.
The benchmarks presented in this article are linked to the world of HPC but the next work will also take into account other fields such as clouds benchmarks. It will help reach a broader view of benchmarks impact as contrary to HPC benchmarks, cloud ones are not always running at maximum load.
ACKNOWLEDGMENT
The results presented in this paper are funded by the European Commission under contract 288701 through the project CoolEmAll.
REFERENCES
[1] W.-c. Feng and K. W. Cameron, “The green500 list: Encouraging sustainable supercomputing,” Computer, vol. 40, no. 12, pp. 50–55, 2007.
[2] J. J. Dongarra, H. W. Meuer, E. Strohmaier et al., “Top500 supercom-puter sites,” Supercomsupercom-puter, vol. 13, pp. 89–111, 1997.
[3] A. P. Chandrakasan and R. W. Brodersen, “Minimizing power consump-tion in digital cmos circuits,” Proceedings of the IEEE, vol. 83, no. 4, pp. 498–523, 1995.
[4] A.-C. Orgerie, L. Lef`evre, and J.-P. Gelas, “Save watts in your grid: Green strategies for energy-aware framework in large scale distributed systems,” in ICPADS. IEEE, 2008, pp. 171–178.
[5] Christmann (2009). Description for Resource Efficient Computing Sys-tem (RECS). http://shared.christmann.info/download/project-recs.pdf. [6] G. Da Costa and H. Hlavacs, “Methodology of measurement for energy
consumption of applications,” in Grid Computing (GRID), 2010 11th
IEEE/ACM International Conference on. IEEE, 2010, pp. 290–297. [7] R. Redelmeier, “Cpuburn, june 2001.”
[8] Http://svn.python.org/projects/python/trunk/Tools/pybench/README, PYBENCH - A Python Benchmark Suite.
[9] Http://www.openssl.org/ OpenSSL: The Open Source toolkit for SSL/TLS.
[10] Http://www.futuretech.blinkenlights.nl/c-ray.html, John Tsiombikas, C-Ray Simple C-Raytracing Tests.
[11] X. Gonze, J.-M. Beuken, R. Caracas, F. Detraux, M. Fuchs, G.-M. Rignanese, L. Sindic, G.-M. Verstraete, G. Zerah, F. Jollet et al., “First-principles computation of material properties: the abinit software project,” Computational Materials Science, vol. 25, no. 3, pp. 478–492, 2002.
[12] D. H. Bailey, E. Barszcz, J. T. Barton, D. S. Browning, R. L. Carter, L. Dagum, R. A. Fatoohi, P. O. Frederickson, T. A. Lasinski, R. S. Schreiber et al., “The nas parallel benchmarks summary and preliminary results,” in Supercomputing, 1991. Supercomputing’91. Proceedings of
the 1991 ACM/IEEE Conference on. IEEE, 1991, pp. 158–165. [13] K.-D. Lange, “Identifying shades of green: The specpower
bench-marks.” IEEE Computer, vol. 42, no. 3, pp. 95–97, 2009.
[14] M. Witkowski, A. Oleksiak, T. Piontek, and J. Weglarz, “Practical power consumption estimation for real life hpc applications,” Future
Generation Comp. Syst., vol. 29, no. 1, pp. 208–217, 2013. [15] L. Cupertino, G. Da Costa, A. Sayah, and J.-M. Pierson, “Valgreen: an
applications energy profiler,” International Journal of Soft Computing
and Software Engineering [JSCSE], 2013.
[16] J. Mateusz, A. Oleksiak, T. Piontek, and J. Weglarz, “Runtime power usage estimation of hpc servers for various classes of real-life applica-tions,” Future Generation Comp. Syst., 2013.