JOURNAL OF ADVANCED VETERINARY AND ANIMAL RESEARCH ISSN 2311-7710 (Electronic)
http://doi.org/10.5455/javar.2019.f384 December 2019
A periodical of the Network for the Veterinarians of Bangladesh (BDvetNET) VOL 6, NO. 4, PAGES 567–574
ORIGINAL ARTICLE
Feeding practices of dairy cows in Algeria: Characterization, typology, and impact on
milk production and fertility
Said Boukhechem1, Nassim Moula2, Nedjoua Lakhdara1, Rachid Kaidi3,4
1Institute of Veterinary Science, University of Mentouri Constantine 1, 25017 Constantine, Algeria 2 Department of Animal Production, Division of Genetics and Biostatistics, Faculty of Veterinary Medicine, University of Liege, 4000 Liege, Belgium 3 Institute of Veterinary Sciences, Laboratoire des Biotechnologies liées à la Reproduction Animale (LBRA), University of Blida 1, PB270 Blida, Algeria 4School of Veterinary Medicine and Science, University of Nottingham, Nottingham, Leicestershire, UK
Correspondence Said Boukhechem said.boukhechem@umc.edu.dz Institute of Veterinary Science, University of Mentouri
Constantine 1, 25017 Constantine, Algeria.
How to cite: Boukhechem S, Moula N, Lakhdara N, Kaidi R. Feeding practices of dairy cows in Algeria: Characterization, typology, and ABSTRACT
Objective: To explore feeding strategies and identify eventual errors that could cause poor pro-duction and reproduction performances in dairy farms in the north of Algeria.
Materials and Methods: A survey was conducted among 211 farms of different sizes, from 2014 to 2018 to compose a database that is analyzed statistically. Results: The results relative to the nutritive value of the rations showed an average dry matter intake of 15.9 ± 4.74 kg/cow/day, providing 13.2 ± 4.34 UFL (Feed Unit for Lactation) of net energy and 1306 ± 456 gm of protein digested in small intestine (PDI)/cow/day. A high proportion of concentrate intake is observed, with an average of 64.7% ± 17.4% of energy intake and 70.2% ± 16.2% of nitrogen intake. Dairy cows performances were characterized by a low milk production regarding their genetic potential (14.2 ± 4.73 kg of milk/cow/day), a calving interval > to one year (397 ± 20.4 days), though the coverage rates of their nutrient requirements reached 120%. The typology of the dietary rations allowed grouping them into three categories: deficient rations cluster (DR), correct rations cluster, and excessive rations cluster (ER). DR and ER, which are not adjusted to animals’ needs, were found in 57.8% of farms. Conclusion: It is obvious that the feeding management in the dairy farms in the North of Algeria is not based upon scientific achievements, contributing to relatively low performances of cows as well as to important financial losses. This finding imposes the necessity to adopt a correct and accurate rationing of animals. ARTICLE HISTORY Received August 07, 2019 Revised September 08, 2019 Accepted September 09, 2019 Published November 02, 2019 KEYWORDS Algeria; calving interval; dry matter; fertility; net energy intake; nitrogen intake Introduction
Algeria is considered as one of the largest consumers of milk, and its products with an annual average estimated to 150 l per capita recorded in 2015 [1], while international standards set by the World Health Organization evaluated at 90 l/capita/year. Consumption that the local produc-tion can only satisfy by 33% [2]; therefore, the shortfall is filled by imports of milk powder at around 67% (868 million dollars a year milk imports invoice [3]), which is obviously an important overhead cost on the Algerian state budget [3].
Although the milk production recorded a positive increase between 2009 and 2015 following the measures taken by the government in the context of several plans to develop and to improve the sector, it remains low consid-ering the genetic potential of modern dairy cattle, which can grow on average between 5000 and 6000 kg per lacta-tion in their country of origin [4].
The low productivity of dairy cattle is the result of sev-eral ecological, technical, and socio-economic obstacles, which limit the farms profitability [5], and bother the good expression of the genetic potential of the cows, which
This is an Open Access article distributed under the terms of the Creative Commons Attribution 4.0 Licence (http://creativecommons.org/ licenses/by/4.0)
show a drastic drop of their milk production (national milk production average estimated at 13.38 l/cow/day) [6]. In addition to the insufficiency of forage resources, an uncon-trolled diet is undoubted the most incriminated reason for low production [4]. The aim of this study is to describe and evaluate the feeding management of dairy cows in Algerian farms and, thereby, identify possible errors of rationing that contribute to the fall in milk production of cows in order to correct them in the future.
Materials and Methods
Study area and choice of farms
The study was conducted in 211 farms of different sizes distributed in five regions of the north of Algeria (Fig. 1): 146 farms were located in the region of Relizane [35°74′N, 0°55′E at 85 m above sea level (ASL)], 59 farms in Souk-Ahras (36°28′N, 7°95′E at 683 m ASL), four farms in Constantine (36°34′N, 6°66′E at 703 m ASL), one farm in Tipaza (36°59′N, 2°68′E at 221 m ASL), and one farm in the region of Medea (36°22′N, 2°56′E at 687 m ASL). These farms gathering a total of 3758 dairy cows of differ-ent breeds were chosen for practical reasons of accessibil-ity and availabilaccessibil-ity of data (convenience sampling). Survey
The descriptive investigation approach adopted involves the use of cross-sectional surveys. They were carried out for 4 years (from 2014 to 2018) and allowed to recover a large number of data. The questionnaire established to achieve these surveys covered the compositional aspects as well as the amount of daily food rations served to the cows, the amount of the milk collected daily, the data of the milk fat analyzes realized by the collector, and, finally, the dates of calvings.
Data analysis
First, the nutritional values of the rations were calculated from the Ruminant Feed Nutritional Value, Tables of Institut
National de Recherche Agronomique (INRA) [7] to deter-mine their total dry matter (DM), net energy, nitrogen, and mineral intakes (calcium and phosphorus). Afterward, the theoretical needs of cows were calculated. Maintenance needs were first estimated according to an average live weight of 600 kg, production needs were determined upon the daily milk yield average, which allows evaluating the coverage rates of different nutrient requirements of dairy cows per farm. The average dairy performances per cow, per farm, and per day were estimated for the month cor-responding to the visit by dividing the total amount of the produced milk during this month by the number of the days and by the number of the lactating cows. Concerning the assessment of the fertility in the farms and the calving interval (CI), the most technico-economic criterion in dairy production [8,9] was deduced by calculating the average of the recorded intervals.
Statistical analysis
Analysis of variance was performed with GLM procedure in SAS (Statistical Analysis System; SAS Release 9.1) to study the effect of certain factors (qualitatives). The used model form is: Yijkl= u + Ri + STj + SZk + FNl + eijkl
u = general mean
Ri = region effect (i = 1–5)
STj = effect of the farm status (j = 1– 2)
SZk = effect of the season (k = 1–4)
FNl = effect of the forage nature (l = 1–4)
eijkl = residual error
To study the effect of certain factors (quantitatives), the Pearson correlation coefficients were calculated using the CORR procedure by the R software (version 3.4.4).
To establish the typology of the distributed rations of the cows, a principal component analysis (PCA) was done by the R software.
Results and Discussion
Global characteristics of feeding practices
The studied diets were characterized by a total average dry matter intake varying from 5.2 to 29.7 kg per cow and per day with an average of 15.9 ± 4.74 kg, equal to 2.65 kg per 100 kg of live weight. This value is slightly below the cited standards in the literature [10] and those observed by Ouarfli and Chehma [11] in Ouargla in the desert (19.5 kg), Ghozlane et al. [12] in Constantine (19.3 ± 2.02 kg/ day) and Srairi and Kessab [13] in Morocco (19.4 kg/day). In fact, in 3.3% of the farms, the rations were only com-posed of fodder, in 13.3%, the concentrate provided less than 30% of dry matter, whereas it has brought more than 50% in 39.8% of the farms.
Hence, the proportion of fodder in dry matter intakes varied from 17.95 to 100% for an average of 55% ± 15.6% per farm. In the majority of farms (56.9%), the fodder
distributed was in its dry form (hay or straw), while green fodder was present in 39.8% served alone (4.7%) or with dry roughage (35.1%). Silage was observed only in 3.3% of the farms.
As a result, the concentrate provided 44.9% ± 15.6% of the dry matter, ranging from 0% to 82.1%. This proportion is represented by a mean daily concentrate intake of 8.47 ± 3.71 kg per cow, per day, and per farm. Concentrates were offered twice daily before or during milking. This value, which is comparable to that reported by Ghozlane et al.
[12] in Constantine (41.9% ± 8.33%) and lower than that recorded by Ouarfli and Chehma [11] in Ouargla (58.6%), remains above the recommended standards [14]. It is due to a lack of fodder sources area and poor quality fodder. The high proportion of concentrate in the diets may cause an increase in risk of metabolic diseases and increase the production cost.
It was found that the amount of concentrate distrib-uted, and thus, the forage/concentrate ratio varied upon the nature of the fodder composing the basic ration. When the latter consisted only of dry fodder (hay and/or straw), a proportion of concentrate of 51% was recorded compar-ing to 35.3% when the basic ration was composed of dry fodder mixed with green fodder.
Nutritive value and equilibrium state of diets
The total net energy average provided by the diets is evalu-ated at 13.2 ± 4.34 UFL per cow per day, equal to 0.83 UFL per 1 kg of dry matter. This energy intake allows theoret-ically producing an amount of milk equivalent to 18.7 kg.
It is important to note that concentrate gives the cows nearly 2/3 of this energy: 64.7% ± 17.4%. This ratio is higher than those recorded by Ouakli and Yakhlef [15] in the dairy basin of Mitidja (56% ± 0.25%), Madani et al. [16]
in the semi-arid region of Sétif (42% to 53%), Ghozlane et al. [12] in Constantine (56.0% ± 7.42%), and El-Khattar
[17] and Srairi [18] in the region of Rabat-Salé in Morocco (51% and 55%, respectively). On the other hand, it is lower than that reported by Ouarfli and Chehma [11] in the saha-rien region of Ouargla (71%) and Srairi and Kessab [13] in six specialized farms in Morocco (73.1%).
The yield of the net energy of concentrate per kg of the produced milk is 0.66 ± 0.39 UFL/kg. It is higher than those reported by Madani et al. [16] in three farms in Sétif (0.32 to 0.53 UFL/kg) and lower than those observed by Kadi et al. [19] in Tizi Ouzou (0.80 ± 0.14) and Srairi and Kessab [13] in Morocco (0.75 UFL/kg). This situation is caused by the poor quality of the fodder but especially by the small quantities consumed.
Regarding nitrogen rationing, the average total intake of nitrogenous matter was 1306 ± 456 g PDI per cow per day, with a mean difference recorded between protein digested in the small intestine when rumen-fermentable nitrogen is
limiting (PDIN) and protein digested in the small intestine when rumen-fermentable energy is limiting (PDIE) of 138 ± 142 g PDI. The theoretical amount of milk allowed by this intake is 19.1 kg/day.
The proportion of concentrate in the total nitrogen intake is 70.2% ± 16.2%, lower than 75.6% reported by Ouarfli and Chehma [11] in Algeria’s desert.
This high proportion of concentrate in energy and nitro-gen intakes may indicate that this one also covers some of the maintenance needs, while the latter is supposed to be covered by the basic ration composed of fodder [10].
Excessive use of concentrate may increase the risk of metabolic disorders, particularly the subclinical form that constrains both production and fertility of cows [20] and increases production costs and, therefore, causes consid-erable economic losses.
This finding was made earlier by several researchers
[21,22]. It is due, according to them, to the fodder deficit
that characterizes the whole farms in Algeria with a low production (poor exploitation of the available agricultural area and low irrigation) and/or the insufficiency of the supply of fodder resources. In most farms, the fodder is of poor quality and is only used for its filling effects.
The nitrogen/net energy ratio of the diet presents an average of 99 ± 13.3 gm of PDI/UFL. It is close to recom-mendations (95 gm) and just below the upper tolerated limit (100–105 gm) to cover the needs of animals while avoiding nitrogen wastes and their negative environmen-tal impacts and controlling the food cost [23]. A quarter of farms (25.1%) have a nitrogen/net energy ratio greater than 105 gm.
The microbial ratio (Rmic), which determines a toler-able deficit in PDIN relative to the PDIE, compensated by PDIN from salivary urea [23] ranged from −79.2 to +35.6 gm of PDI/UFL. It was below the threshold value (−8 for a production level ranging from 15 to 25 kg milk/d/cow) in 26.5% of farms. Nevertheless, there are not very high Rmic values that may be detrimental from an environmen-tal point of view (higher urinary nitrogen release) and eco-nomic (nitrogen concentrates are often expensive).
The mean difference between the theoretical milk yield allowed by the net energy and that allowed by the nitro-gen of the ration was 2.89 ± 3.22 kg of milk reflects an imbalance of the rations. This gap between the energy and protein intakes of the ration (energy wastage) is a limiting factor that determines the resultant production of a com-promise between the two factors. Body reserves would serve as a buffer, at least for relatively short periods and allow cows to be in good body condition [24].
The coverage rates of energy and nitrogen require-ments were estimated with mean values ranging from 120% ± 43.4% and 120% ± 46.5% consecutively. Energy requirements were covered in 68.1% of rations, while in
31.9%, these needs were not covered. Similarly, nitrogen requirements were covered in 65.4% of farms.
Regarding the contributions of mineral materials, they were deficient with a total average calcium intake of 41.4 ± 22.1 gm and, therefore, an overall coverage rate of 48.2% ± 28.3%. Rations in which calcium requirements were covered accounted for only 5.76% of the total, while phos-phorus requirements were covered in 66.5% of the visited farms with an average total intake of 135 ± 68.3 gm per cow and per day and an average coverage rate of phospho-rus requirements of 124% ± 51.4%.
Phosphocalcic requirements were not covered in most farms. This may be due to low inputs of forages considered as the main source of ingested minerals. These phospho-calcic deficiencies and imbalances can have multiple con-sequences (sterility, low milk production, milk fever, less resistance to microbial and parasitic diseases, etc.), induc-ing serious economic impact [23].
The variations of the nutritional values of these rations according to different factors have been disparates. The statistical study shows that a large variability in the nutri-ent intakes of rations from one region to another (p < 0.01) with an increase in DM, net energy, nitrogen, calcium, and phosphorus intakes has been observed starting from the east to the west of the country. This is probably due to the increase in the proportion of the concentrate in the diet that has varied in the same way. The coverage rates of dif-ferent nutrient requirements of the cows remain, however, independent of the effect of the region factor (p > 0.05). The feeding practices were not therefore specific to the regions.
On the other hand, the status of the farm (public or private), the herd size, and the ration season had no sig-nificant effect on different nutrients intakes of the rations (p > 0.05), while the ration season had a significant effect only on the coverage rates of net energy and nitrogen requirements (p < 0.05). In addition, rations of winter period had the best coverage rates compared to spring and summer periods. This can be explained by the high intake of concentrate during the wintering.
Farms performances
The milk yield represented by the average daily produc-tion was 14.2 4.73 kg per cow and per farm, ranging from 2.68 to 27.2 kg. This value is comparable to the national average (13.38 l) [6] and that recorded by Ghozlane et al. [12] in Constantine (14.9 ± 2.74 kg/cow/per day) but higher than those reported by Ouarfli and Chehma [11] in Ouargla (11.5 kg/cow/day) and by Kadi et al. [19] in Tizi Ouzou (12.78 ± 3.67 l).
An extrapolation permitted to estimate a production in 305 days of approximately 4333 ± 1444 kg/cow. Despite the net energy and nitrogen intakes, which in theory allow
to produce higher quantities, this performance remains low and far from the performances recorded in the devel-oped countries [25]. It reflects a poor expression of the genetic potential of cows. This can be explained by a devi-ation of the metabolism according to the composition of the ration and/or the existence of other stress sources (livestock buildings, temperature, hygiene), where, any deficiency, excess or imbalance in the diet may reduce milk production, degrade its quality, or even more cause nutri-tional diseases [10].
Dairy production was highly influenced (p < 0.01) by dry matter, net energy, nitrogen intakes, the coverage rates of energy and nitrogen requirements, and to a lesser degree by the forage/concentrate ratio (p < 0.05).
A large difference (p < 0.01) was also observed between private and public farms, where the best production means were observed (Table 2).
Similarly, improvement in dairy performance was observed with the increase in the herd size (p < 0.05, Table 2). This can be explained by variations in practices between traditional and industrial livestock farming.
On the other hand, the average of the farms milk pro-duction was independent of the influence of the region, the ration season, and the nature of forages, the phosphocalcic intake and the lactation stage (p > 0.05).
The produced milk fat (MF) was estimated at 33.8 ± 1.63 gm/kg. It was highly influenced by farm status, regions, dry matter, net energy and nitrogen intakes, forage and concentrate proportion in the diet (p < 0.01), and at a less degree by ration season, calcium, and phosphorus intakes (p < 0.05). It should be noted that there was no significant effect (p > 0.05) of the herd size, the nature of forages, and the lactation stage on the variations of the fat matter con-tained in the produced milk.
Concerning the fertility of the cows represented by the calving interval, it was estimated meanly of 397 ± 20.4 days per cow and per farm. Knowing that the accepted standard for this parameter is around 365 days [8], only 3.66% of farms had a CI average less than or equal to 365 days.
Fertility was not influenced by diet composition and intakes with the exception of nitrogen and calcium intakes (p < 0.05). All other factors including milk performance had no significant influence on fertility (p > 0.05).
Typology and factors of variation
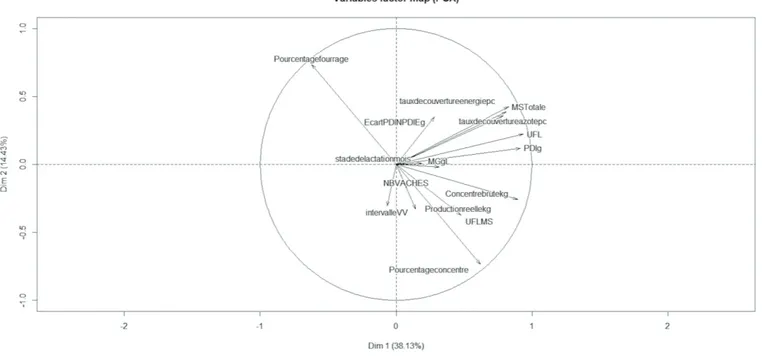
In order to establish a typology of dietary rations of the sample, a PCA of 211 rations was applied to 15 quantita-tive variables contributing to a total inertia of the three first axes of 62.4%. The main plan (defined by axes 1 and 2) allowed a good graphic discrimination (Fig. 2): on the x-axis, the nutrient intakes of the rations (total DM, net energy intake, nitrogen intake, and coverage rates of
energy and nitrogen requirements), on the ordinate level of performances (milk production, calving interval) as shown in Table 3.
The hierarchical ascending clustering (HAC) was per-formed on 15 variables. In this case, three clusters (ration types) were identified (Table 4) keeping a variance between the clusters of 62.42% of the total variability (Fig. 3).
Table 1. Total intakes means of the studied rations.
Parameter Total DM
(kg) proportion (%)Concentrate Net Energy (UFL) Nitrogen (gm of PDI) Ca (gm) P (gm)
Mean ± standard deviation 15.9 ± 4.74 44.9 ± 15.6 13.2 ± 4.34 1306 ± 456 41.4 ± 22.1 61.4 ± 23.4 Status Public (1.4%) 12.7 ± 0.99 42.9 ± 10.2a 11.3 ± 2.46 1236 ± 283 55.8 ± 19.1 57.1 ± 10.2 Private (98.6%) 16 ± 4.75 45 ± 15.6b 13.2 ± 4.36 1307 ± 458 61.5 ± 23.5 55.0 ± 15.6 Herd size < 5 (1.4%) 19.3 ± 1.70 48.8 ± 6.83 18 ± 5.57 1869 ± 595 64.2 ± 21.3 51.2 ± 6.83 5–9 (34.6%) 16 ± 4.69 42.1 ± 16.8 12.9 ± 4.23 1267 ± 440 59.8 ± 23.1 57.9 ± 16.8 10–19 (45%) 15.9 ± 4.88 46.6 ± 15.7 13.3 ± 4.37 1292 ± 460 62.7 ± 24.1 53.4 ± 15.7 20–49 (14.2%) 15.6 ± 5.19 44.4 ± 13.0 13.1 ± 4.78 1302 ± 464 61.3 ± 25.3 55.6 ± 13 50–99 (2.4%) 16.7 ± 3.60 43.5 ± 6.28 14.3 ± 3.20 1536 ± 373 57.3 ± 14.2 56.5 ± 6.28 ≥ 100 (2.4%) 15.6 ± 2.37 56.6 ± 11.5 14.2 ± 2.13 1577 ± 393 63.3 ± 19 43.3 ± 11.5 Season Winter (22.8%) 18.8 ± 3.67 49.7 ± 11.5 15.8 ± 3.51 1585 ± 400 72.8 ± 22.8 50.3 ± 11.5 Spring (21.8%) 13.8 ± 3.42 42.2 ± 17.2 11.9 ± 3.53 1213 ± 369 61.2 ± 20.0 57.8 ± 17.2 Summer (43.6%) 15.1 ± 4.98 42.8 ± 17.2 12.2 ± 4.46 1176 ± 466 54.4 ± 23.4 57.2 ± 17.2 Autumn (11.8%) 17.4 ± 4.97 48.7 ± 9.10 14.5 ± 4.38 1417 ± 419 65.8 ± 22.1 51.2 ± 9.10 Typology clusters Cluster 1 (30.8%) 11.3 ± 3.50a 30.1 ± 15a 8.48 ± 2.51a 823 ± 255a 44.6 ± 20.1a 69.8 ± 15a Cluster 2 (42.2%) 16.4 ± 2.75b 55.1 ± 9.20b 14 ± 2.3b 1385 ± 258b 63.7 ± 20.4b 44.9 ± 9.20b Cluster 3 (27%) 20.4 ± 3.66c 46.1 ± 10.1c 17.5 ± 3.13c 1731 ± 369c 77 ± 19.1b 53.9 ± 10.1b abcThe values on the same column with different letters in superscript are different in p < 0.05. Table 2. Performances means of the surveyed farms.
Parameter Milk production (kg) Milk fat (gm/kg) CI (day)
Total sample 14.2 ± 4.73 34.7 ± 1.68 397 ± 20.4 Status Public 16.5 ± 1.44a 34 ± 00a 392 ± 6.66a Private 14.2 ± 4.75b 34.7 ± 1.68a 397 ± 20.5a Herd size < 5 11.0 ± 1.61 36 ± 00a 393 ± 5.66a 5–9 14 ± 5.09 34.6 ± 1.77a 401 ± 16.6a 10–19 14.1 ± 4.58 34.9 ± 1.56a 396 ± 23.6a 20–49 14.8 ± 3.92 34.6 ± 1.93a 392 ± 20.3a 50–99 18.1 ± 3.17 34 ± 00a 390 ± 7.97a ≥ 100 16.2 ± 8.90 32 ± 00a 390 ± 2.83a Season Winter 15.1 ± 5.71a 35.4 ± 1.27a 401 ± 13.8a Spring 14.9 ± 4.78a 34.1 ± 1.68a 393 ± 18.1a Summer 13.5 ± 4.37a 34.3 ± 1.87a 398 ± 25a Autumn 13.5 ± 3.47a 35.5 ± 1.15a 397 ± 17.2a Typology clusters Cluster 1 13.2 ± 4.49a 33.3 ± 1.54a 395 ± 23.8a Cluster 2 16.5 ± 4.59b 35.3 ± 1.34a 402 ± 21.5b Cluster 3 12.4 ± 4.00c 35.0 ± 1.58a 392 ± 10.9a abcThe values on the same column with different letters in superscript are different in p < 0.05.
Finally, three types of rations were identified:
• The Cluster 1 (deficient rations) is the group of the deficient rations found in 30.8% of farms. These diets
are characterized by lower DM, net energy, and nitro-gen intakes (Table 1), and therefore, all cows nutrient requirements are not covered in this cluster. The cov-erage rate is estimated on avcov-erage at 80.7% ± 22.8% for energy needs; 80.2% ± 25.5% for nitrogen needs; 37.1% ± 17.7% for calcium needs, and 92.3% ± 39.6% for phosphorus needs. The average milk yield in this group is 13.2 ± 4.49 kg/cow/day/farm, close to the overall mean, while the calving interval of 395 ± 23.8 days is below the overall average.
• The Cluster 2 (correct rations) gathers the so-called correct rations, distributed in 42.2% of the farms with DM, net energy, and nitrogen intakes compara-ble to total averages (Tacompara-ble 1) where the majority of the nutrient needs are covered. These rations cover 116% ± 16.2% of energy needs; 114% ± 21.5% of nitrogenous requirements; 120% ± 43.4% of phos-phorus requirements, and 37.4% ± 14.9% of calcium
Table 3. Statistical links of variables with the first three axes.
Variables Symbol in the factor map Dim1 (%) Dim2 (%) Dim3 (%)
Total Dry Matter MSTotale 65.7 15.0 10.4 Forage percentage Pourcentagefourrage 38.4 54.0 01.7 Concentrate percentage Pourcentageconcentre 38.4 54.0 01.7 Energetic intake UFL 87.8 05.0 03.6 Nitogenous intake PDIg 83.7 01.4 01.3 Energy coverage rate Tauxdecouvertureenergiepc 68.4 18.0 07.9 Nitrogen coverage rate Tauxdecouvertureazotepc 62.0 12.9 15.0 Milk production Productionreellekg 02.1 10.8 75.4 MF MGgl 10.0 0 0.9 Calving Interval intervalleVV 0.5 09.4 0.3
Figure 2. HAC of the individuals.
Table 4. Degree of statistical signification of axes with the clusters.
Cluster 1 Cluster 2 Cluster 3
Dim 1 p < 0.001 p < 0.001 p < 0.001
Dim 2 p < 0.05 p < 0.01 p < 0.001
Dim 3 p < 0.01 p < 0.01 p < 0.01
requirements. The amount of milk recorded in cows fed these rations was the highest among the groups with an estimated average of 16.5 ± 4.59 kg. On the other hand, the mean calving interval of 402 ± 21.5 days is the highest of the groups. This finding could be attributed to the antagonism between milk pro-duction and fertility [25].
• The Cluster 3 (excessive rations) corresponds to excessive rations found in 27% of farms with DM, net energy and nitrogen intakes were higher than the overall averages (Table 1), where all nutrient require-ments are fully covered. These rations cover 171% ± 33.5% of energy needs, 172% ± 38.4% of nitrogen requirements, 74.6% ± 33.6% of calcium ments, and 164% ± 46% of phosphorus require-ments. Despite the high intakes, the amounts of milk recorded in cows consuming rations of this group were the lowest among the clusters with an aver-age of 12.4 ± 4 kg (lower than the overall averaver-age). In addition, fertility in this group was better with an average CI of 392 ± 10.9 days below the overall mean.
Conclusion
The study of the characteristics of the served rations in some farms allows emphasizing the following points:
• Lack of a food strategy based on covering the nutrient requirements of cows according to scientific rules. Observed feeding practices are conditioned by other constraints, including forage availability and food prices. This had led to the excessive use of concen-trate to cover the needs of cows despite its negative impact on health status, profitability, and production cost.
• Production values that do not deviate from the national average reflecting technical management problems of farms.
• Food wastage was observed in 50.2% of farms (where coverage rates of nutrient requirements were greater than 110%). This is in addition to production costs. Regardless of the other aspects of breeding, it is nec-essary to provide technical support to breeders based primarily on the control and the improvement of forage production techniques and forage preservation in addition to technical and economic controls of feeding for a good use of the available resources, as well as for a good profitability.
Acknowledgment
The authors wish to thank infinitely all the people who facilitated their access to the farms, especially Dr. MECHMACHE, Dr. ZOUAOUI, and Dr. AMARA.
Conflict of interest
The authors would like to declare that there is no conflict of interest related to the publication of this paper.
Authors’ contributions
SB designed the study, led the surveys, interpreted the data, and draft the manuscript. NM did the statistical anal-ysis. NL took part in preparing and critical checking of this manuscript. RK oversaw the study and reviewed the manuscript.
References
[1] Chemma N. La dépendance laitière: où en est l’Algérie?. Revue d’Études en Management et Finance d’Organisation 2017; (5):1–19.
[2] MADR. Ministère de l’Agriculture et du Développement Rural,
Statistiques agricoles, superficies et production, Séries A et B 2013; 2014:2015.
[3] Makhlouf M, Montaigne E, Tessa A. La politique laitière algérienne:
entre sécurité alimentaire et soutien différentiel de la consomma-tion. New Medit 2015; 14(1):12–23.
[4] Kalli S, Saadaoui M, Ait Amokhtar S, Belkheir B, Benidir M, Bitam A,
et al. Éléments d’enquête générale sur la filière lait en Algérie. Int J Innov Financ Strateg 2018; 1:12–9.
[5] Herbut P, Angrecka S, Walczak J. Environmental parameters to
assessing of heat stress in dairy cattle—a review. Int J Biometeorol
2018; 62:2089; https://doi.org/10.1007/s00484-018-1629-9
[6] Adem R. Les exploitations laitières en Algérie: structure
de fonctionnement et analyse des performances techni-co-économiques: cas des élevages suivis par le CIZ. 4th edition, journées de recherches sur les productions animales. Tizi-Ouzou, 13 p, 7 au 9 décembre 2003..
[7] Agabriel JL. Alimentation des bovins, ovins et caprins. Besoins des
animaux-Valeurs des aliments: tables Inra. Edition remaniée–– Quae éditions 2010; 312
[8] Grimard B, de Boyer des Roches A, Coignard M, Lehébel A, Chuiton
A, Mounier L, et al. Relationships between welfare and repro-ductive performance in French dairy herds. Vet J 2019; 248:1–7;
https://doi.org/10.1016/j.tvjl.2019.03.006
[9] Dalcq A, Beckers Y, Mayeres P, Reding E, Wyzen B, Colinet F, et al.
The feeding system impacts relationships between calving interval and economic results of dairy farms. Animal 2018; 12(8):1662–71;
https://doi.org/10.1017/S1751731117003020
[10] Kleefisch MT, Zebeli Q, Humer E, Gruber L, Klevenhusen F. Effects of feeding high-quality hay with graded amounts of concentrate on feed intake, performance and blood metabolites of cows in early
lactation. Arch Anim Nutr 2018; 72(4):290–307; https://doi.org/
10.1080/1745039X.2018.1474004
[11] Ouarfli L, Chehma A. Étude critique de la pratique de l’alimen-tation des bovins laitiers dans la région d’Ouargla. Revue des Bioressources 2011; 1(2):13–18.
[12] Ghozlane F, Bousbia A, Benyoucef MT, Yakhlef H. Technical-economic impact of the concentrate/fodder ratio on the bovine dairy production: case of the farming of constantine. Livest
Res Rural Dev 2009; 21(6); http://www.lrrd.org/lrrd21/6/
ghoz21094.htm (Accessed on August 01, 2019)
[13] Srairi MT, Kessab B. Performances et modalités de production laitière dans six étables spécialisées au Maroc. INRA Prod anim 1998; 11(4):321–6.
[14] Alstrup L, Søegaard K, Weisbjerg MR. Effects of maturity and har-vest season of grass-clover silage and of forage-to-concentrate ratio
on milk production of dairy cows. J Dairy Sci 2016; 99(1):328–40;
https://doi.org/10.3168/jds.2015-9802
[15] Ouakli K, Yakhlef H. Performances et modalites de production laitière dans la Mitidja. Recherche Agronomique INRA Algérie 2003; 1(13):15–24.
[16] Madani T, Mouffok C, Frioui M. Effet du niveau de concentré sur la rentabilité de la production laitière en situation semi-aride algéri-enne. 11th edition, Rencontres de la Recherche sur les Ruminants, Paris, France, p 11, 2004.
[17] El Khattar K. Élaboration d’une stratégie d’appui technique aux éleveurs bovin laitier de la région de Casablanca, cas de quelques
unités pépinières. Mémoire de 3ème cycle Agronomie, option
pro-duction animale, IAV Hassan II., Rabat, Morocco, p 215, 1994. [18] Srairi MT. Conduite technique de cinq unités de production
dans la wilaya de Rabat-Salé. Actes de l’Institut Agronomique et Vétérinaire Hassan II (Maroc) 1998; 19:41–51.
[19] Kadi SA, Djellal F, Berchiche M. Characterization of feeding prac-tices of the dairy cows in Tizi-Ouzou area, Algeria. Livest Res Rural
Dev 2007; 19(4); http://www.lrrd.org/lrrd19/4/kadi19051.htm
(Accessed on August 01, 2019)
[20] Valente T, Sampaio C, da Lima E, Deminicis B, Cezário A, Santos W. Aspects of acidosis in ruminants with a focus on nutrition. J Agric
Sci 2017; 9(3):1916–9760; https://doi.org/10.5539/jas.v9n3p90
[21] Houmani M. Situation alimentaire du bétail en Algérie. Recherche agronomique––INRA Algérie 1999; (4):35–45.
[22] Abdelguerfi A, Zeghida A. Utilization des engrais par culture en Algérie. Food and Agriculture Orgnalization, Rome, Italy, Edition, 56 p, 2005.
[23] Brocard V, Brunschwig P, Legarto J, Paccard P, Rouille B, Bastien D, et al. Guide pratique de l’alimentation du troupeau bovin laitier. 1st edition, l’institut de l’élevage, Éditions Quae - 78026 Versailles Cedex, France, p 264, 2010.
[24] Humer E, Gruber L, Zebeli Q. Effects of meeting the requirements
in energy and protein, and of systemic inflammation on the inter-val from parturition to conception in dairy cows. Czech J Anim Sci
2018; 63(6):201–11; https://doi.org/10.17221/13/2017-CJAS
[25] Coffey EL, Horan B, Evans RD, Berry DP. Milk production and fertility performance of Holstein, Friesian, and Jersey purebred cows and their respective crosses in seasonal-calving commercial
farms. J Dairy Sci 2016; 99(7):5681–9; https://doi.org/10.3168/